


Report Overview
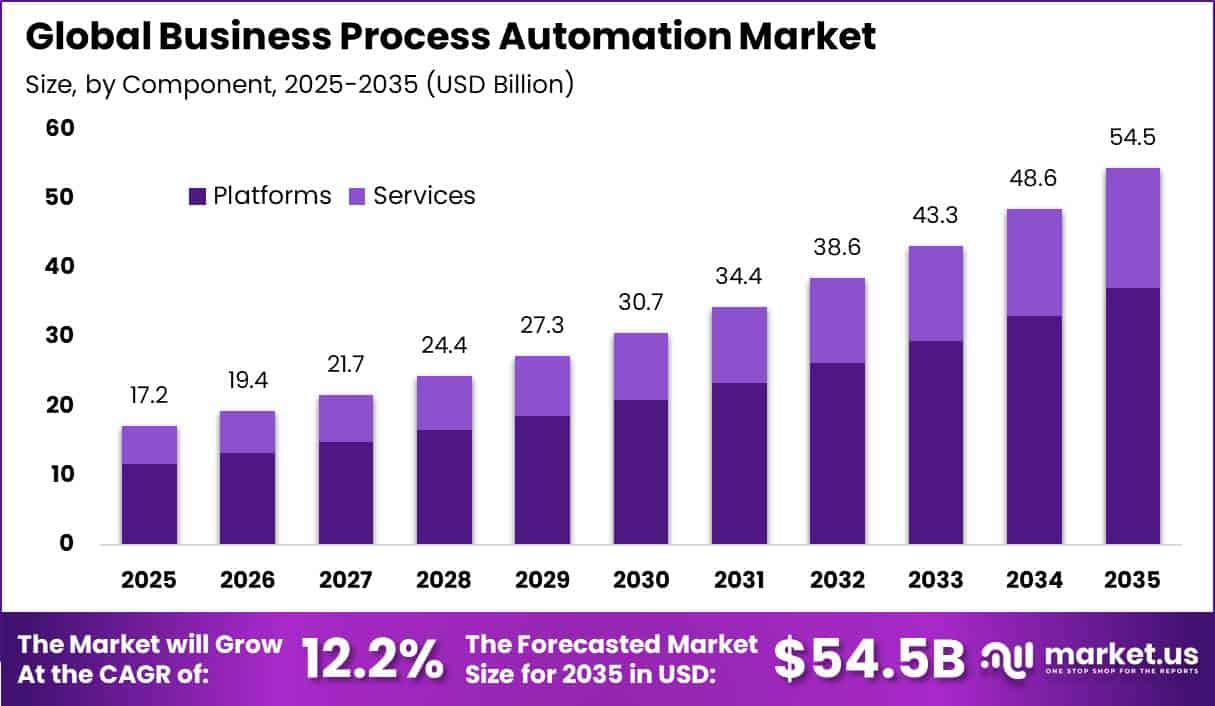
In 2025, the Global Business Process Automation Market was valued at USD 17.2 billion. The market is projected to grow at a CAGR of 12.2% during 2026–2035, reaching approximately USD 54.5 billion by 2035. North America dominated the global market in 2025, accounting for more than 35.7% of the total market share and generating approximately USD 6.1 billion in revenue.
This growth is supported by the rapid digitization of business and government operations. The global E-Government Development Index increased from 0.61 in 2022 to 0.63 in 2024, representing a 4.59% increase. Public-sector digital investment reached USD 90.9 billion in 2023, compared with around USD 700 million a decade earlier.
This expansion is increasing the use of automation for document processing, approvals, citizen services, and administrative workflows. In addition, global services trade grew by 8.0% year-on-year in the third quarter of 2024. Services account for more than 63% of global GDP, valued at over USD 67.5 trillion, creating a large economic base where automation can improve productivity and control operating costs.
The U.S. recorded 5.2 million new business applications in 2024, representing a 47.8% increase compared with 2019. Growing business formation supports demand for scalable digital workflows and low-headcount operating models. Automation is also becoming more important across developed economies, with nearly 14% of jobs considered at high risk of full automation and another 32% identified as partially automatable.
Key Takeaway
- The Business Process Automation Market was valued at USD 17.2 billion in 2025 and is projected to reach USD 54.5 billion by 2035 at a 12.2% CAGR.
- Platforms dominated the component segment with a 68.2% market share.
- Cloud led the deployment segment, accounting for 61.7% of the market.
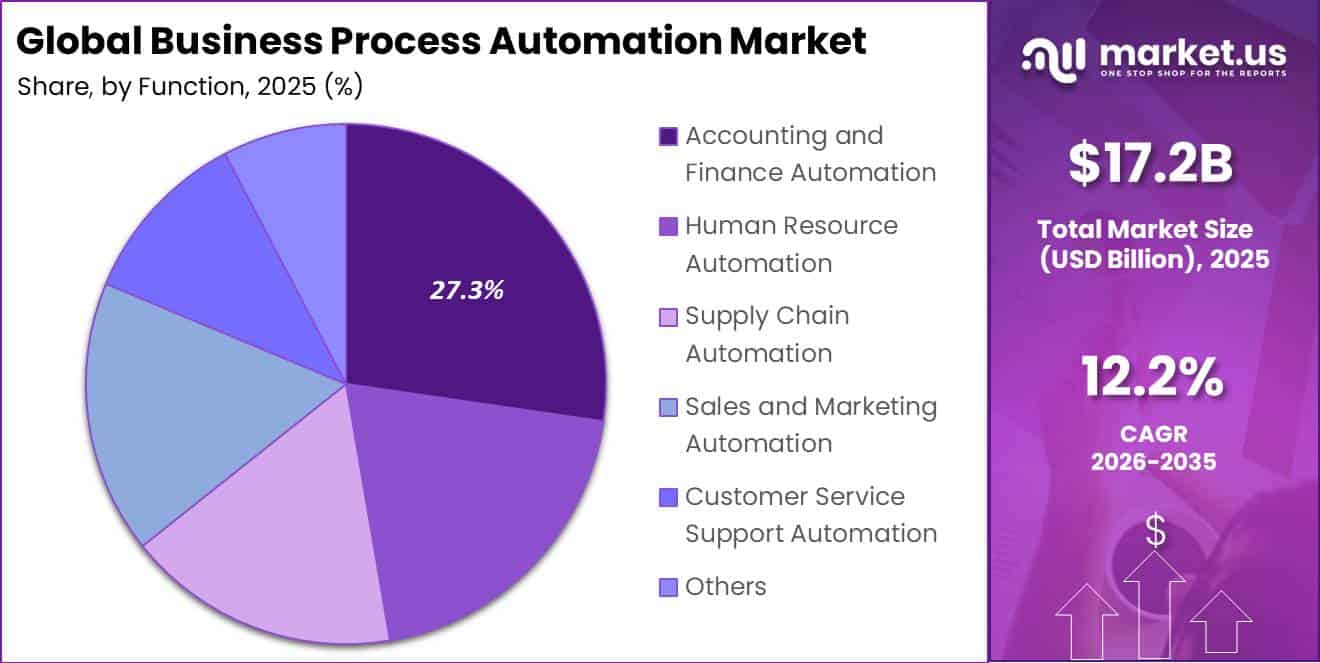
- Accounting and Finance Automation held the largest functional share at 27.3%.
- BFSI emerged as the leading end-use segment with a 29.6% share.
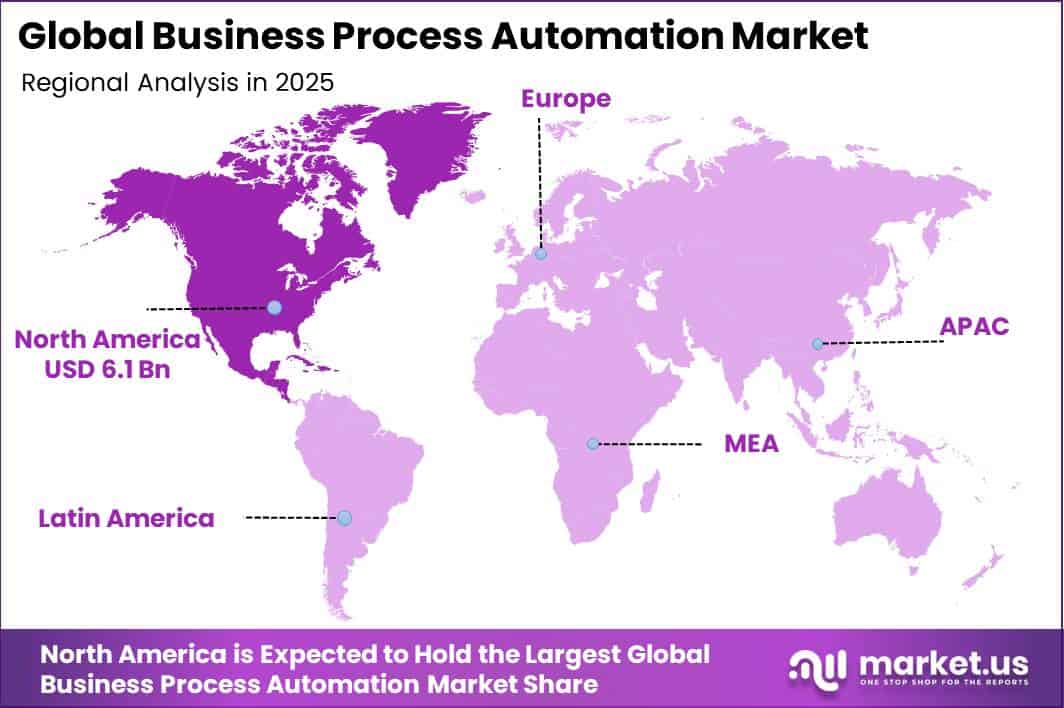
- North America led the market in 2025 with a 35.7% share, generating approximately USD 6.1 billion in revenue.
Market Statistics and Data Insights
- In 2025, 52.7% of EU enterprises used paid cloud computing services, up 7.4 percentage points from 2023. Among enterprises using paid cloud services, 58.2% used finance or accounting applications, 30.1% used ERP software, 27.9% used CRM applications, and 26.1% used cloud platforms for application development, testing, or deployment.
- Eurostat reported that 20.0% of EU enterprises with at least 10 employees used AI technologies in 2025, compared with 13.5% in 2024, an increase of 6.5 percentage points. Around 11.8% used AI to analyse written language, 9.5% used it to generate images, video, or audio, and 8.8% used it to generate written or spoken language.
- During FY2025, the U.S. Internal Revenue Service processed 271.4 million tax returns and other forms, collected USD 5.3 trillion in gross taxes, and issued USD 638.8 billion in refunds. IRS.gov also received 958.9 million visits, while users downloaded 590.7 million files, indicating the scale of digital finance and compliance interactions suitable for automated workflows.
- The Federal Reserve reported 236.6 billion noncash payments by U.S. consumers and businesses in 2024, an increase of 31.9 billion compared with 2021. Cards represented more than three-quarters of transactions by number, while ACH accounted for almost three-quarters of noncash payment value.
- GAO identified 11 critical U.S. federal legacy systems requiring modernization. Of these, 8 used outdated programming languages, 4 had unsupported hardware or software, and 7 operated with known cybersecurity vulnerabilities.
- The U.S. federal government spends more than USD 100 billion annually on IT and cyber investments, with agencies historically reporting about 80% of this spending on operations and maintenance. As of February 2025, 7 of 10 previously identified critical system modernizations remained unfinished.
- Microsoft’s 2026 Cyber Pulse reported that more than 80% of Fortune 500 companies were already using AI agents. However, only 47% of organizations had implemented dedicated generative-AI security controls, while 29% of employees reported using unsanctioned AI agents for work activities.
- As of June 2025, the U.S. Technology Modernization Fund had invested approximately USD 1.03 billion across 68 IT modernization projects. Among them, 24 projects expect combined savings of USD 1.06 billion, while 11 had already delivered USD 13.5 million in savings. Another 21 projects, representing 98.3% of expected savings, anticipate most savings from FY2027 onward.
- OECD data show that 74.1% of surveyed tax administrations had virtual assistants or chatbots in 2024. Among administrations with virtual assistants, 97.5% used pre-programmed rules, but only 27.5% used AI to personalize interactions. Separately, only 22.2% used AI during taxpayer interactions outside virtual assistants.
- The Clearing House RTP network processed 142 million transactions worth USD 576 billion in Q2 2026. By July 2026, average daily payment value reached USD 6.7 billion, and participation exceeded 1,322 financial institutions. The system supports transactions of up to USD 10 million and reports 100% uptime with zero scheduled downtime.
- Microsoft reported that Ramp’s Azure-based automation processes approximately 400,000 invoices and 5 million receipts per month while saving around 30,000 hours of manual work. Its OCR system achieves approximately 90% accuracy on OCR fields.
By Component
The Platforms segment held a strong position in the Business Process Automation market, accounting for 68.2% of the total share. This dominance is supported by the growing use of cloud infrastructure as the preferred model for enterprise software. In 2025, around 52.7% of EU enterprises used paid cloud computing services, an increase of 7.4 percentage points compared with 2023.
Cloud adoption among large enterprises reached 84.7%, showing that bigger organizations are increasingly moving important business applications to cloud environments. This trend directly supports BPA platforms, as they depend on cloud infrastructure to connect departments, manage cross-functional workflows, and scale operations without major on-premises hardware investments.
In the United States, private fixed investment in information processing equipment and software reached USD 1.19 trillion in 2024, reflecting continued spending on digital infrastructure. BPA platforms benefit from this investment because they combine workflow automation, low-code development, analytics, and process management within a single system.
By Deployment
The Cloud segment held a leading position in the Business Process Automation market, accounting for 61.7% of the total share. This dominance is supported by the rapid expansion of cloud infrastructure and increasing government use of hosted services. Global data centre electricity consumption reached 415 terawatt-hours in 2024 and increased at an average rate of 12% annually over the previous 5 years, more than 4 times faster than overall electricity demand.
Government adoption is also supporting the segment. U.S. federal cloud spending reached approximately USD 17 billion in FY2024, while total federal IT spending exceeded USD 130 billion. These spending levels show a continued shift from traditional on-premises systems toward cloud-hosted platforms.
By Function
The Accounting and Finance Automation segment held a leading position in the Business Process Automation market, accounting for 27.3% of the total share. This leadership is supported by the large volume of financial transactions that businesses and government agencies must process digitally. In FY2025, the IRS processed 271.4 million federal tax returns and supplemental documents and received 4.5 billion third-party information returns.
Around 93.9% of these information returns were submitted electronically, showing the high level of digital processing already used in financial operations. Accounting activities such as invoicing, reconciliation, tax reporting, and data entry involve repetitive and rule-based tasks, making them well suited for automation to reduce errors and improve processing speed.
OECD data also shows that 70% of the 54 Forum on Tax Administration members use AI tools for compliance and fraud detection, while around 60% provide fully pre-filled tax returns. These figures highlight the strong adoption of automation across finance-related functions. The high transaction volume and structured nature of accounting processes continue to make finance one of the most important areas for BPA investment.
By Vertical
The BFSI segment held a dominant position in the Business Process Automation market, accounting for 29.6% of the total share. This leadership is mainly supported by the huge volume of banking and payment transactions that must be processed quickly and accurately. In 2024, the Federal Reserve’s ACH network processed nearly 1.8 billion Treasury payments valued at USD 8.5 trillion.
At the same time, The Clearing House RTP network handled 343 million instant payments worth USD 246 billion, representing a 94% year-on-year increase. Managing this level of payment activity requires automated systems for reconciliation, fraud monitoring, transaction screening, and real-time settlement. The Bank for International Settlements also reported that global cross-border bank claims reached USD 41 trillion in Q3 2024, increasing by 3.4% year-on-year.
These large transaction volumes create major compliance and operational workloads for financial institutions. As a result, banks and other financial service providers increasingly depend on BPA for payment processing, KYC checks, account reconciliation, fraud detection, and settlement activities, supporting the strong position of the BFSI segment.
Key Market Segments
By Component
- Platforms
- Services
By Deployment
- Cloud
- On-premises
By Function
- Accounting and Finance Automation
- Human Resource Automation
- Supply Chain Automation
- Sales and Marketing Automation
- Customer Service Support Automation
- Others
By Vertical
- BFSI
- Manufacturing
- IT and Telecom
- Retail and Consumer Goods
- Healthcare
- Others
Geopolitical Impact Analysis
Rising U.S.-China trade tensions are increasing the cost of hardware and cloud infrastructure used in the Business Process Automation market. Following the January 2026 Section 232 proclamation, the U.S. imposed a 25% tariff on imported advanced computing chips and related products. This was added to an existing 50% Section 301 tariff on semiconductors from China, bringing blended effective tariffs on Chinese-origin technology imports to around 33% by mid-2026.
Since BPA platforms depend on server processors, GPUs, networking chips, and data centre equipment, higher import duties can raise infrastructure costs and reduce vendor margins. A further 15% tariff on polysilicon also took effect in 2026, adding pressure across semiconductor and data centre supply chains.
Shipping disruptions in the Red Sea are creating another challenge. Carriers rerouting around the Cape of Good Hope have increased transit times on Southeast Asia-to-U.S. East Coast routes by 47%, while China-to-Europe routes have seen increases of around 25%. Median transit times on some affected routes are now close to 2 months.
These delays can slow the delivery of servers, networking equipment, and IoT devices needed for BPA deployments. Despite these pressures, demand for automation remains strong. Global bank cross-border claims reached USD 41 trillion in Q3 2024, rising 3.4% year-on-year. This growing transaction volume continues to support demand for payment processing, compliance, and financial workflow automation, even as hardware and logistics costs increase.
Regional Analysis
North America held the leading position in the global Business Process Automation market, accounting for 35.7% of the total share and generating approximately USD 6.1 billion in 2025. The region benefits from strong enterprise IT spending, advanced cloud infrastructure, and high adoption of digital technologies across finance, healthcare, and government organizations.
The U.S. Bureau of Economic Analysis reported that private investment in information processing equipment and software reached USD 1.19 trillion in 2024, providing a strong financial base for automation deployment across major industries.
Asia Pacific is emerging as the fastest-growing region, supported by rapid digitalization and expanding connectivity. Developing Asian economies grew by 5.5% in 2025. Between 2019 and 2023, fixed broadband coverage increased by 17.7%, while mobile broadband coverage expanded by 5.0%, reaching approximately 2.20 billion and 2.25 billion people, respectively.
Internet performance also improved significantly, with fixed broadband download speeds rising by 156% and mobile download speeds increasing by 396% during the same period. In addition, Southeast Asia’s digital economy is expected to exceed USD 300 billion in gross merchandise value in 2025 and move toward USD 1 trillion by 2030.
Key Regions and Countries
North America
- US
- Canada
Europe
- Germany
- France
- The UK
- Spain
- Italy
- Rest of Europe
Asia Pacific
- China
- Japan
- South Korea
- India
- Australia
- Rest of APAC
Latin America
- Brazil
- Mexico
- Rest of Latin America
Middle East & Africa
- GCC
- South Africa
- Rest of MEA
Market Dynamics
Drivers
| Driver | (~) % CAGR | Geographic Relevance | Impact Timeline |
|---|---|---|---|
| Enterprise AI Agent Adoption | +2.1% | Global | Short term (2 years or less) |
| Cloud Workflow Migration | +1.7% | North America and Europe | Short term (2 years or less) |
| Financial Compliance Digitization | +1.4% | Global | Medium term (2 to 4 years) |
| Shared Services Modernization | +1.0% | North America and Asia Pacific | Medium term (2 to 4 years) |
| Low-Code Builder Expansion | +0.8% | Global | Medium term (2 to 4 years) |
Enterprise AI Agent Adoption
Enterprise AI agents are changing BPA from task automation into workflow execution across finance, service, procurement, and IT operations. Microsoft reported that Azure exceeded USD 75 billion in revenue in fiscal 2025, rising 34%, while Microsoft Cloud revenue rose 23% to USD 168.9 billion, per its fiscal 2025 annual report.
Oracle reported fiscal 2025 cloud-services revenue of USD 24.5 billion, up 24%, according to its SEC filing, and IBM reported USD 7.7 billion in automation revenue in fiscal 2025, per its annual segment disclosure. These investments lower the cost and deployment time of building automation agents, supporting an estimated +2.1% incremental contribution to the 12.2% baseline CAGR through higher platform subscriptions, workflow consumption, and services attach rates.
Restraints
| Restraint | (~) % CAGR | Geographic Relevance | Impact Timeline |
|---|---|---|---|
| Data Sovereignty Requirements | -1.8% | Europe, China, Middle East | Short term (2 years or less) |
| High Enterprise Integration Costs | -1.4% | Global | Medium term (2 to 4 years) |
| SME Budget Constraints | -1.1% | Emerging Markets | Short term (2 years or less) |
| Regulated Model Validation | -0.9% | North America and Europe | Medium term (2 to 4 years) |
| Cross-Border Data Limits | -0.7% | Asia Pacific and Europe | Medium term (2 to 4 years) |
Data Sovereignty Requirements
Data-localization and AI governance rules can delay BPA projects involving sensitive payroll, customer, health, banking, and public-sector data. The EU AI Act entered into force on August 1, 2024, with prohibited-practice rules applying from February 2, 2025, and major high-risk system obligations beginning in August 2026.
Eurostat reported that 52.7% of EU enterprises used paid cloud services in 2025, while OECD digital-government work covers 38 member economies. Additional legal reviews, regional hosting, security testing, and supplier controls can increase deployment costs and delay multi-country projects, creating an estimated -1.8% drag on the baseline CAGR.
Challenges
| Challenge | (~) % CAGR | Geographic Relevance | Mitigation Horizon |
|---|---|---|---|
| Legacy System Interoperability | -1.6% | Global | Long term (4 years or more) |
| Automation Skills Shortfall | -1.3% | Global | Medium term (2 to 4 years) |
| Process Data Fragmentation | -1.0% | Global | Medium term (2 to 4 years) |
| Cybersecurity Control Burden | -0.9% | Global | Short term (2 years or less) |
| Model Reliability Monitoring | -0.8% | North America and Europe | Medium term (2 to 4 years) |
Legacy System Interoperability
Legacy-system interoperability remains a major challenge because BPA platforms must connect with older ERP, banking, mainframe, document, and customer-data systems without disrupting operations. IBM reported USD 8.6 billion in transaction-processing revenue in fiscal 2025 and USD 15.7 billion in infrastructure revenue, highlighting the large installed base that still requires modernization.
Federal agencies also continue to operate critical legacy systems with modernization costs running into billions of dollars. Enterprises must therefore invest in APIs, data cleansing, testing, security, and parallel-run controls before realizing automation benefits. These requirements can create an estimated -1.6% friction drag and extend BPA project payback periods.
Opportunities
| Opportunity | (~) % CAGR | Geographic Relevance | Execution Window |
|---|---|---|---|
| Autonomous Finance Operations | +2.0% | Global | Medium term (2 to 4 years) |
| Industrial Edge Workflow Automation | +1.5% | Asia Pacific and Europe | Long term (4 years or more) |
| Public Sector Agent Platforms | +1.3% | Asia Pacific, Europe, Middle East | Medium term (2 to 4 years) |
| Vertical Automation Acquisitions | +1.1% | Global | Short term (2 years or less) |
| Outcome-Based Automation Pricing | +0.9% | North America and Europe | Medium term (2 to 4 years) |
Autonomous Finance Operations
Autonomous finance is still a future opportunity, as most enterprises automate individual finance tasks rather than fully agent-led operations. The IRS received 4.5 billion information returns in fiscal 2025, with 93.9% submitted electronically, showing strong potential for automated validation and exception handling.
The Bank for International Settlements reported USD 41 trillion in cross-border bank claims in Q3 2024, while the Federal Reserve processed 1.5 million FedNow transactions during 2024. If automation reduces manual exception handling by 20% to 30%, outcome-based pricing models could improve service margins and potentially add around +2.0% upside to the baseline CAGR.
Key Players Analysis
The Business Process Automation market has a two-tier competitive structure, with large technology companies leading through broad platforms and specialist vendors focusing on specific workflow needs. Microsoft remains a major Tier-1 player, reporting USD 281.7 billion in FY2025 revenue. Microsoft Cloud generated USD 168.9 billion, increasing 23% year-on-year, while R&D spending reached USD 32.5 billion, equal to 12% of revenue.
These investments support products such as Power Automate, Copilot, and Dynamics 365. Oracle recorded FY2025 revenue of USD 57.4 billion, while cloud services and license support revenue increased 12% to USD 44.0 billion, representing 77% of total revenue. IBM generated USD 7.7 billion in automation revenue in FY2025, compared with USD 6.6 billion in FY2024, while consulting segment income reached USD 3.5 billion.
Tier-2 companies compete mainly through automation services and industry-focused solutions. Accenture reported FY2025 revenue of USD 69.7 billion, up 7%, while investing USD 0.8 billion in R&D and USD 3.3 billion across acquisitions, R&D, and training. Genpact’s Data-Tech-AI revenue reached USD 2.4 billion in FY2025, up from USD 2.2 billion, while financial services generated USD 1.3 billion.
Top Key Players in the Market
- Laserfiche
- TIBCO Software Inc.
- OptimumHQ
- Kissflow Inc.
- Microsoft Corporation
- Zoho Corporation Pvt
- Oracle
- Accenture
- Appian Corporation
- BP Logix, Inc.
- Genpact
- IBM Corporation
Recent Developments
- In 2026, IBM completed its acquisition of Confluent on March 17 for approximately USD 11.0 billion, paying USD 31 per share in cash. Confluent supports more than 6,500 enterprises, including around 40% of Fortune 500 companies.
- In 2025, Microsoft introduced Microsoft 365 Copilot Tuning and multi-agent orchestration in Copilot Studio on May 19. Microsoft also reported that more than 230,000 organizations, including 90% of Fortune 500 companies, were already using Copilot Studio to create and customize agents.
Report Scope
| Report Features | Description |
|---|---|
| Market Value (2025) | USD 17.2 Billion |
| Forecast Revenue (2035) | USD 54.5 Billion |
| CAGR (2026-2035) | 12.2% |
| Base Year for Estimation | 2025 |
| Historic Period | 2020-2024 |
| Forecast Period | 2026-2035 |
| Report Coverage | Revenue Forecast, Market Dynamics, Competitive Landscape, Recent Developments |
| Segments Covered | By Component – (Platforms, Services); By Deployment – (Cloud, On-premises); By Function – (Accounting and Finance Automation, Human Resource Automation, Supply Chain Automation, Sales and Marketing Automation, Customer Service Support Automation, Others); By Vertical – (BFSI, Manufacturing, IT and Telecom, Retail and Consumer Goods, Healthcare, Others) |
| Regional Analysis | North America – US, Canada; Europe – Germany, France, The UK, Spain, Italy, Rest of Europe; Asia Pacific – China, Japan, South Korea, India, Australia, Singapore, Rest of APAC; Latin America – Brazil, Mexico, Rest of Latin America; Middle East & Africa – GCC, South Africa, Rest of MEA |
| Competitive Landscape | Laserfiche, TIBCO Software Inc., OptimumHQ, Kissflow Inc., Microsoft Corporation, Zoho Corporation Pvt, Oracle, Accenture, Appian Corporation, BP Logix, Inc., Genpact, IBM Corporation |
| Customization Scope | We will provide customization for segments and region/country levels. Additional customization can be done based on requirements. |
| Purchase Options | We have three licenses to opt for: Single User License, Multi-User License (Up to 5 Users), Corporate Use License (Unlimited Users and Printable PDF) |





























