


Report Overview
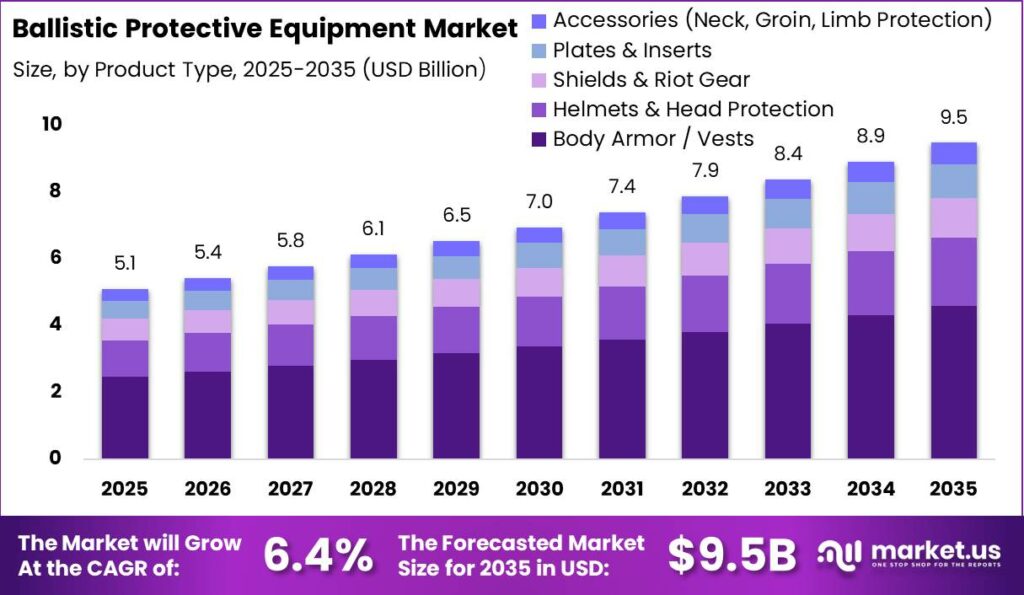
Global Ballistic Protective Equipment Market size is expected to be worth around USD 9.5 Billion by 2035 from USD 5.1 Billion in 2025, growing at a CAGR of 6.4% during the forecast period 2026 to 2035. This growth reflects sustained defense procurement across major military powers. Vendors positioned in high-protection segments will capture the largest share of new spending.
The market covers wearable and deployable armor that stops projectiles and fragmentation threats. This includes body armor, helmets, shields, protective plates, and accessories. Buyers span armed forces, police agencies, private security firms, and civilians. Manufacturers compete on weight, protection class, and certification status. Companies that master material science and meet strict test standards control the highest-value contracts.
Key Takeaways
- Global market reaches USD 9.5 Billion by 2035 from USD 5.1 Billion in 2025 at a CAGR of 6.4%.
- Body Armor / Vests lead product type with a 48.5% share.
- Kevlar / Aramid Fibers dominate material type at 41.2%.
- Military and Defense leads application with a 57.6% share.
- Armed Forces top end users at 53.1%.
- Soft Armor leads form factor with 44.8%.
- Direct Sales channels hold 61.2% of distribution.
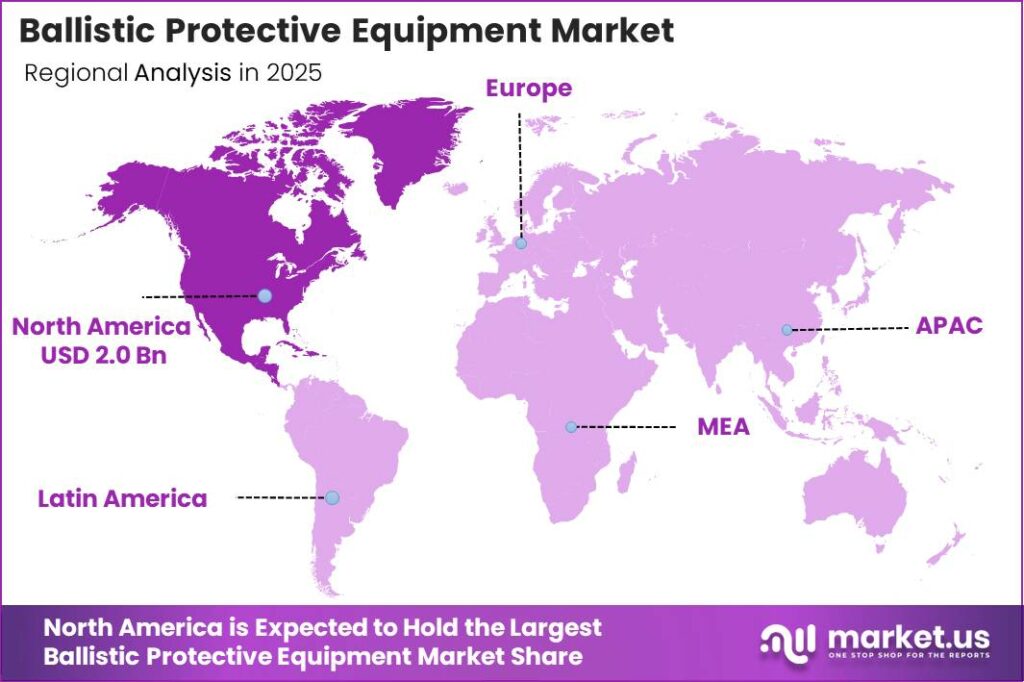
- North America dominates regionally with a 38.7% share, valued at USD 2.0 Billion.
Government programs now anchor demand across major armies. The U.S. Army’s Integrated Visual Augmentation System and Soldier Protection System continue replacing legacy helmets and body armor with lighter modular systems. This means procurement budgets favor suppliers with proven modular platforms. As a result, manufacturers tied to these programs gain repeatable, multi-year revenue rather than one-time sales.
Regulation shapes which products enter service. NIJ-standard ballistic testing includes an additional top-edge soft armor shot at 45° obliquity to simulate high-risk deflection scenarios. This raises the technical bar for certification and rewards firms with mature testing capacity. Therefore, smaller entrants face longer approval timelines that delay their revenue.
Performance gains drive replacement cycles. As reported by U.S. Army PEO Soldier, next-generation combat helmets achieved a 40% weight reduction while increasing ballistic protection. This lighter profile improves soldier mobility and endurance during missions. Consequently, armies retire older heavy gear faster, creating a steady replacement demand pulse for advanced suppliers. In Protective Equipment Market segments, this pattern repeats across allied forces. In June 2025, Premier Graphene formed a joint venture with HGI Industrial Technologies and Nevada Ballistic Armor Corp to develop graphene-coated ballistic plates undergoing NIJ certification testing.
Product Type Analysis
Body Armor / Vests dominates with 48.5% due to universal frontline soldier coverage requirements.
In 2025, Body Armor / Vests held a dominant market position in the By Product Type segment of Ballistic Protective Equipment Market, with a 48.5% share. World Bank WITS trade data records body armor and bulletproof vests flowing under HS code 6217 and related textile categories across major importers. This concentration reflects that every deployed soldier needs torso protection. Suppliers who scale vest production first will secure the widest installed base and repeat orders.
Helmets and Head Protection serve as the second core coverage layer for combat and police units. Modern NG-IHPS designs support mounting of night vision devices, communications, and mission accessories while reducing weight. UN Comtrade classifies ballistic and safety helmets under HS code 6506.10, a category showing steady multi-year global shipment volumes. This means helmet makers who integrate electronics command higher unit prices. Firms that ignore accessory rails risk losing modern procurement bids.
Shields and Riot Gear support law enforcement crowd-control and tactical entry roles. World Bank trade records show riot control and protective shield equipment moving across EU and North American customs channels each year. This equipment sees demand spikes tied to civil unrest and urban security events. Vendors serving police agencies gain predictable municipal budget cycles that offset defense contract volatility. In September 2025, Foreman Capital acquired Protection Group Denmark, a ballistic armor and helmet manufacturer operating across 30+ countries.
Plates and Inserts deliver hard-armor stopping power for rifle-class threats inside carriers. These components carry the highest per-unit material cost among wearable segments. Accessories covering neck, groin, and limb protection round out the category. Together these remaining sub-segments hold the balance of product share behind vests and helmets. Suppliers offering complete kits win larger contract values than single-item sellers.
Material Type Analysis
Kevlar / Aramid Fibers dominates with 41.2% due to proven flexible soft-armor performance.
In 2025, Kevlar / Aramid Fibers held a dominant market position in the By Material Type segment of Ballistic Protective Equipment Market, with a 41.2% share. Global para-aramid production capacity sits near 90,000 to 100,000 metric tons per year across all end uses, per industry supply assessments. This limited base ties armor makers to a few qualified fiber producers. Firms locking in long-term fiber supply gain a durable cost and reliability edge.
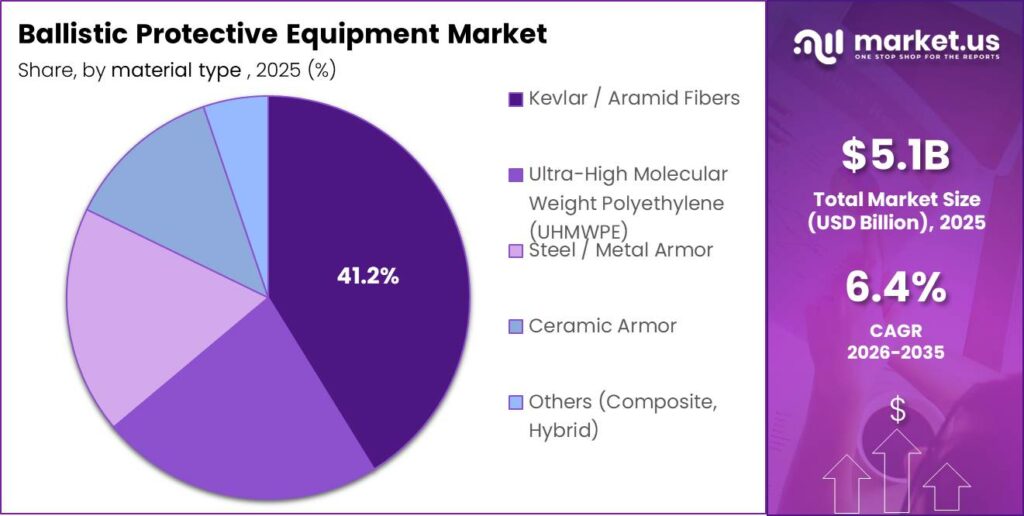
Ultra-High Molecular Weight Polyethylene serves as the lightweight backbone for hard plates and helmet shells. It holds a 22.7% material share. Only 3 to 4 global producers meet defense-grade UHMWPE specifications, and most run near full capacity. This scarcity pushes lead times and prices upward during demand spikes. Buyers who pre-book allocation avoid the delivery delays that stall competitor programs.
Steel and Metal Armor holds 18.3% of the material segment through low cost and multi-hit durability. Ceramic Armor follows at 12.6%, prized for defeating rifle rounds at lighter weight than steel. Composite and hybrid materials make up the remaining 5.2%. This spread means price-sensitive buyers choose steel while elite units pay for ceramic. Vendors offering both tiers capture demand across the full budget range.
Application Analysis
Military and Defense dominates with 57.6% due to large-scale national force equipment mandates.
In 2025, Military and Defense held a dominant market position in the By Application segment of Ballistic Protective Equipment Market, with a 57.6% share. SIPRI reports world military expenditure reached USD 2,887 Billion in 2025, the eleventh straight year of real-term growth. This spending directly funds personal protection procurement. Suppliers aligned with defense ministries capture the largest and most stable revenue streams.
Law Enforcement and Police form the second application layer through domestic security duties. Agencies buy vests, helmets, and shields on recurring municipal and federal budgets. SIPRI figures show European military spending alone rose 14% to USD 864 Billion in 2025, lifting adjacent security budgets. This means police demand tracks broader security funding waves. Vendors serving both military and police smooth their order flow across cycles.
Private Security and Civilian Protection cover the remaining application demand. Private contractors protect infrastructure, executives, and high-risk sites worldwide. Civilian buyers seek covert and lightweight protection for personal safety. Together these non-government uses hold the balance of application share. Firms building commercial channels tap a growing revenue pillar outside defense contracts.
End User Analysis
Armed Forces dominates with 53.1% due to mandatory combat personnel protection standards.
In 2025, Armed Forces held a dominant market position in the By End User segment of Ballistic Protective Equipment Market, with a 53.1% share. SIPRI data shows Asia and Oceania military spending rose 8.1% to USD 681 Billion in 2025, expanding force equipment budgets. This growth converts directly into armor orders per deployed soldier. Suppliers with national defense accreditation win these high-volume contracts.
Police and Law Enforcement Agencies represent the second-largest buyer group through officer safety programs. They procure body armor and helmets on standardized replacement schedules. World Bank governance and public spending data confirm steady law enforcement budget allocation across major economies. This predictability rewards vendors offering multi-year service agreements. Firms bundling maintenance win recurring revenue beyond initial equipment sales.
Security Agencies and Private Contractors buy protection for commercial and high-risk assignments. Civilian Users purchase covert vests and personal protection gear through retail channels. These two groups hold the remaining end-user share. Their demand grows with rising private security spending worldwide. Vendors who serve commercial buyers diversify away from government budget dependence.
Level of Protection Analysis
NIJ Level II and IIa dominates with 22.4% due to lightweight everyday concealable wear demand.
In 2025, NIJ Level II and IIa held a dominant market position in the By Level of Protection segment of Ballistic Protective Equipment Market, with a 22.4% share. NIJ confirms that body armor certified under the older 0101.06 standard remains listed through at least the end of 2027. This keeps a dual-standard certification market active through the transition. Suppliers holding both certifications avoid product delisting risk and retain buyer trust.
NIJ Level III and IIIa provide rifle and higher-velocity threat protection for tactical roles. These levels serve frontline military and specialized police units. Certification under the newer 0101.07 standard raises testing rigor for these classes. This means firms with mature test labs move products to market faster. Slow-to-certify rivals cede tactical contracts during the compliance window.
NIJ Level IV defeats armor-piercing rifle rounds through hard ceramic and composite plates. Other national and coalition standards cover the remaining protection share. These top-tier classes carry the highest material and testing costs. Demand rises as defense modernization programs specify higher threat coverage. Vendors mastering Level IV plate production capture premium defense procurement value.
Form Factor Analysis
Soft Armor dominates with 44.8% due to flexible concealable daily-wear protection design.
In 2025, Soft Armor held a dominant market position in the By Form Factor segment of Ballistic Protective Equipment Market, with a 44.8% share. World Bank WITS trade records show soft armor textile products moving under aramid fabric HS categories across major importing nations each year. This flexibility suits police and covert use where mobility matters most. Suppliers optimizing soft-armor comfort win the largest end-user base.
Hard Armor delivers rifle-class stopping power through rigid plates and inserts. Military and tactical units rely on hard armor for high-threat missions. Production requires ceramic and UHMWPE materials from a concentrated supplier base. This raises unit cost and rewards vertically integrated makers. Firms controlling plate supply defend margin against material price swings.
Hybrid Armor combines soft and hard layers to balance weight and protection. Optimized hybrid systems achieved a 7.6% weight reduction using a 4 mm steel plus 5 mm UHMWPE configuration under identical ballistic impact conditions. This lighter design improves wearer endurance without sacrificing coverage. Vendors advancing hybrid architectures target the fast-growing multi-threat segment.
Distribution Channel Analysis
Direct Sales dominates with 61.2% due to large government defense contract procurement.
In 2025, Direct Sales through government and defense contracts held a dominant market position in the By Distribution Channel segment of Ballistic Protective Equipment Market, with a 61.2% share. SIPRI records confirm total global military spending of USD 2,887 Billion flows largely through direct government procurement channels. This concentrates revenue in a few large tenders. Suppliers with strong contracting teams and compliance records win these bulk awards.
Distributors and Dealers serve mid-size police and private security buyers who lack direct contracts. They extend market reach into fragmented regional accounts. This channel handles smaller order volumes at higher unit margins. Vendors using distributors expand coverage without building large sales teams. Firms balancing direct and dealer channels reach both large and small buyers efficiently.
Online and E-Commerce channels serve civilian and small commercial buyers seeking fast delivery. This channel grows as personal protection awareness rises among private users. Together with distributors, these routes hold the remaining channel share behind direct sales. Online sales carry lower acquisition cost per order. Vendors building digital storefronts capture emerging civilian demand at scale.
Key Market Segments
By Product Type
- Body Armor / Vests
- Helmets and Head Protection
- Shields and Riot Gear
- Plates and Inserts
- Accessories (Neck, Groin, Limb Protection)
By Material Type
- Kevlar / Aramid Fibers
- Ultra-High Molecular Weight Polyethylene (UHMWPE)
- Steel / Metal Armor
- Ceramic Armor
- Others (Composite, Hybrid)
By Application
- Military and Defense
- Law Enforcement and Police
- Private Security
- Civilian Protection
By End User
- Armed Forces
- Police and Law Enforcement Agencies
- Security Agencies / Private Contractors
- Civilian Users
By Level of Protection
- NIJ Level II and IIa
- NIJ Level III and IIIa
- NIJ Level IV
- Other Standards
By Form Factor
- Soft Armor
- Hard Armor
- Hybrid Armor
By Distribution Channel
- Direct Sales (Government / Defense Contracts)
- Distributors and Dealers
- Online / E-Commerce
Regional Analysis
North America Dominates the Ballistic Protective Equipment Market with a Market Share of 38.7%, Valued at USD 2.0 Billion
North America leads the market with a 38.7% share, valued at USD 2.0 Billion in 2025. The region benefits from large U.S. defense budgets and active modernization programs. As per our research, sustained federal procurement anchors this dominance. This means suppliers based in the region enjoy proximity to the largest single buyer. Firms with U.S. contracting credentials hold a structural advantage over foreign rivals.
Asia-Pacific ranks as the fastest-growing region as national forces expand and modernize. Rising cross-border tensions drive stockpile replenishment across the area. As per our research, indigenous defense manufacturing programs accelerate regional demand. This creates entry points for suppliers who localize production. In July 2025, Galvion received a Canadian Department of National Defence follow-on order for 5,000 additional Batlskin Caiman ballistic helmets under the DICE program.
Europe, Latin America, and the Middle East and Africa hold the remaining regional share. European NATO spending surges lift equipment orders across member states. Latin American and African demand rises with law enforcement modernization. Together these regions balance the global footprint beyond the two leaders. Vendors with multi-region distribution capture demand wherever budgets expand.
Key Regions and Countries
North America
- US
- Canada
Europe
- Germany
- France
- The UK
- Spain
- Italy
- Rest of Europe
Asia Pacific
- China
- Japan
- South Korea
- India
- Australia
- Rest of APAC
Latin America
- Brazil
- Mexico
- Rest of Latin America
Middle East and Africa
- GCC
- South Africa
- Rest of MEA
Market Dynamics
Market Opportunity Analysis - Underserved regions and non-government verticals offer entry points for new players
Asia-Pacific remains underexploited despite its fast growth trajectory. Indigenous defense programs in India, Japan, and South Korea are building new national supply chains from scratch. This creates open lanes for suppliers who localize production before incumbents establish footholds. Therefore, early entrants who partner with regional manufacturers can lock in multi-year national contracts ahead of slower global competitors.
Private Security and Civilian Protection stay underserved within the application mix behind the 57.6% military share. Non-government buyers protect infrastructure, executives, and personal safety needs that defense-focused vendors overlook. This gap lets agile suppliers build a commercial revenue pillar outside government budget cycles. As a result, firms that develop retail and B2B channels diversify away from tender volatility.
Online and E-Commerce channels remain underused against the 61.2% direct-sales concentration. Civilian and small commercial buyers seek fast, low-friction purchasing that large contract channels ignore. This creates room for digital-first vendors to capture emerging personal protection demand. Consequently, suppliers building strong e-commerce operations reach buyers that traditional direct-sales teams cannot serve profitably.
Hybrid Armor sits underexploited behind Soft Armor’s 44.8% form-factor lead. Multi-threat buyers increasingly want unified ballistic, blast, and stab protection in one lighter system. This creates a premium niche for suppliers advancing hybrid material architectures. Instead of competing on price in commodity soft armor, new entrants can target higher-margin hybrid platforms.
Technology and Innovation Landscape - Modular electronics and material science redefine competitive edges
Modular helmet ecosystems now define frontline head protection. As reported by U.S. Army PEO Soldier, NG-IHPS designs support mounting of night vision, communications, and mission accessories while cutting weight. This turns helmets into integration platforms rather than passive shells. Therefore, manufacturers who master accessory-rail architecture win modernization bids that reject fixed single-purpose designs.
Ultra-lightweight material engineering drives replacement demand. Data from U.S. Army PEO Soldier shows next-generation combat helmets achieved a 40% weight reduction while raising ballistic performance. This lighter profile improves soldier endurance and reduces fatigue injuries. As a result, armies retire heavier legacy gear faster, and material-science leaders capture the resulting upgrade wave.
Layered UHMWPE architecture sets the protection performance frontier. Configurations scale from 8 layers at NIJ Level II to 22 layers in military builds, per 2026 comparative testing. This flexibility lets makers tune protection precisely to mission threat levels. Consequently, firms with advanced layup engineering serve both lightweight patrol and heavy combat needs from one material platform.
Graphene and hybrid composites represent the next material leap. In June 2025, Premier Graphene formed a joint venture to develop graphene-coated ballistic plates undergoing NIJ certification testing for military use. This signals a shift toward multi-hit, extreme-threat plate performance. Therefore, investors backing next-generation composite developers position early in the highest-value protection segment.
Drivers
The largest binding commitment in alliance history now anchors demand. At the Hague Summit in June 2025, all 32 NATO members pledged to invest 5% of GDP annually in defense by 2035, split into 3.5% for core needs and 1.5% for related security. European allies and Canada raised spending by over USD 90 Billion in 2025, a near 20% jump, pushing combined outlays past USD 571 Billion. This means buyers now fund multi-year armor programs with visible budgets.
NATO Capability Targets set specific protection standards per soldier, forming a procurement floor. Global military expenditure exceeded USD 2.87 Trillion in 2025 according to Market.us, the eleventh straight year of real growth. Nations like Germany and Canada, where equipment spend sat below 25% of budgets, now face remediation pressure through 2028. This creates a front-loaded demand pulse that rewards suppliers ready to scale capacity quickly.
| Driver | (~) % Impact on CAGR Forecast | Geographic Relevance | Impact Timeline |
|---|---|---|---|
| NATO 5% GDP Defense Spending Commitment Unleashing Multi-Year Procurement Surge | +2.8% | All 32 NATO member states; highest acceleration in Poland, Germany, Finland, UK, Canada | Short term (≤ 2 years) |
| Escalating Global Geopolitical Conflicts Driving Accelerated Personal Protection Equipment Procurement | +1.5% | Ukraine, Middle East, Indo-Pacific, East Africa | Short term (≤ 2 years) |
| Law Enforcement & Homeland Security Modernization Programs Expanding Non-Military Demand | +0.9% | United States, EU Member States, India, Brazil, Saudi Arabia | Medium term (2–4 years) |
| Advanced Material Innovation Driving NIJ Level IV & ESAPI Plate Replacement Cycles | +0.7% | United States, Israel, United Kingdom, Germany, France | Medium term (2–4 years) |
| Female Combat Personnel Inclusion Mandating New Body Armor Fit & Form Factor Procurement | +0.3% | United States, United Kingdom, Canada, Australia, Nordic NATO Members | Medium term (2–4 years) |
Restraints
Export control law blocks cross-border sales even to allied nations. ITAR and EAR treat ballistic materials as controlled defense articles requiring license approval before any shipment or technical transfer. License processing runs up to 60 days for routine requests and 90 days for complex transfers, clashing with urgent 2 to 4 week conflict-driven timelines. This means U.S. makers lose allied contracts to European and Israeli rivals outside U.S. jurisdiction.
Penalties raise the stakes and deter aggressive exporting. Civil fines reach USD 1 Million per violation, and criminal penalties extend to 20 years imprisonment. This risk forces U.S. firms to ring-fence controlled technology and design separate export products. That segmentation adds an estimated 12% to 18% in compliance overhead per line and delays international launch by 6 to 12 months. As a result, cross-border sales velocity lags the current spending surge.
| Restraint | (~) % Impact on CAGR Forecast | Geographic Relevance | Impact Timeline |
|---|---|---|---|
| ITAR & EAR Export Control Regimes Blocking Cross-Border Commercial Sales to Allied Nations | -1.8% | United States manufacturers exporting to non-ITAR-cleared allied & partner nations | Short term (≤ 2 years) |
| Sovereign Defense Industrial Base Preferences Shutting Out Foreign Suppliers from National Tenders | -1.2% | India (Defence Acquisition Procedure), France, Germany, Poland, South Korea | Short term (≤ 2 years) |
| Prolonged Government Budget Approval Cycles Delaying Contracted Procurement Disbursements | -0.6% | United States (Congressional appropriations), EU member states | Medium term (2–4 years) |
| Strict NIJ & STANAG Certification Requirements Extending New Product Time-to-Market | -0.4% | United States (NIJ 0101.07), NATO member procurement agencies | Medium term (2–4 years) |
| Counterfeit & Substandard Ballistic Equipment Undercutting Certified Supplier Pricing | -0.2% | Middle East, Sub-Saharan Africa, Southeast Asia | Long term (≥ 4 years) |
Challenges
A near-oligopoly controls the two critical armor materials. Fewer than 4 credible producers make defense-grade para-aramid, with global capacity near 90,000 to 100,000 metric tons per year across all uses. Only 3 to 4 qualified UHMWPE producers run near full capacity. This concentration exposes armor makers to allocation shortages and price shocks.
Supply friction is escalating and reshaping strategy. Over 18% of armor makers reported aramid and polyethylene shortages in 2023, and defense-grade para-aramid now runs USD 40 to 80 per kilogram. Lead times stretched from 8 to 12 weeks up to 20 to 28 weeks during demand spikes. This means firms must lock 3 to 5 year supply deals and fund alternative material R&D to stay competitive.
| Challenge | (~) % CAGR Friction Drag | Geographic Relevance | Mitigation Horizon |
|---|---|---|---|
| Aramid & UHMWPE Fiber Supply Concentration | -0.9% | Global; supply concentrated among fewer than 5 qualified global producers | Long term (≥ 4 years) |
| NIJ & STANAG Test Standard Divergence | -0.6% | United States vs. NATO-European procurement agencies | Medium term (2–4 years) |
| Skilled Workforce Shortage in Ballistic Textile Manufacturing | -0.5% | United States, United Kingdom, Germany, Israel | Long term (≥ 4 years) |
| Weight-Mobility Trade-Off Limiting Adoption of Higher Protection Levels | -0.4% | Global, most acute in infantry-intensive procurement programs | Medium term (2–4 years) |
| Used Equipment Lifecycle Management & Disposal Complexity | -0.2% | United States, European NATO members | Long term (≥ 4 years) |
Opportunities
Smart armor turns passive gear into a data platform. Makers can embed impact sensors, physiological monitors, TBI blast detection, and network nodes into vests and helmets. A standard NIJ Level III plate carrier procures at USD 800 to 2,500 per system today. A sensor-integrated platform would command USD 4,500 to 9,000, a 2 to 4× revenue multiplier per soldier.
Recurring services deepen the margin upside. A data and analytics layer would generate USD 150 to 400 per soldier per year across a 5 to 7 year lifecycle. This shifts gross margins from hardware-only levels of 18% to 28% up to a blended 35% to 50%. This means early movers who solve network interface standards capture premium, subscription-style revenue ahead of rivals.
| Opportunity | (~) % Potential CAGR Upside | Geographic Relevance | Execution Window |
|---|---|---|---|
| Smart & Sensor-Integrated Ballistic Armor as a Platform for Battlefield Data Collection | +1.6% | United States, United Kingdom, Israel, France, Germany, Australia | Long term (≥ 4 years) |
| India & Indo-Pacific Defense Indigenization Programs Creating New National Supply Chains | +1.1% | India, Japan, South Korea, Australia, Singapore | Medium term (2–4 years) |
| Private Security & Critical Infrastructure Protection Vertical as Non-Government Revenue Pillar | +0.7% | United States, Europe, Middle East, Sub-Saharan Africa | Medium term (2–4 years) |
| Additive Manufacturing for On-Demand Modular Armor Component Production | +0.5% | United States, United Kingdom, Israel, Germany | Long term (≥ 4 years) |
| Protective Equipment-as-a-Service (PEaaS) Lifecycle Management Model for Government Clients | +0.3% | United States, United Kingdom, Canada, Australia | Long term (≥ 4 years) |
Key Company Insights
BAE Systems plc holds a structural advantage through its deep integration into NATO defense supply chains and multi-year framework contracts. This positioning lets it absorb large procurement surges that smaller rivals cannot service. UHMWPE ballistic armor configurations range from 8 layers at NIJ Level II to 22 layers in military configurations, per 2026 testing. This means the firm’s material engineering depth protects its high-protection contract share against new entrants.
Lockheed Martin Corporation leverages its systems-integration scale to bundle protective equipment within larger soldier modernization platforms. Optimized hybrid armor achieved a 7.6% weight reduction using a 4 mm steel plus 5 mm UHMWPE configuration under identical impact conditions. This lighter design strengthens its position in mobility-focused programs. However, its focus on large platforms leaves gaps in agile niche segments that specialized challengers can exploit. In June 2025, Avon Technologies secured an USD 18 Million DLA order under the NG-IHPS program.
Key Players
- BAE Systems plc
- Lockheed Martin Corporation
- Northrop Grumman Corporation
- Raytheon Technologies Corporation
- Safariland Group
- 3M Company
- Honeywell International
- DuPont
- Point Blank Enterprises
- Ceradyne, Inc.
- Crye Precision
- Team Wendy
- Armor Express
- Revision Military
- DSA Inc.
Recent Developments
- June 2026: ArmorSource secured a USD 17.6 Million U.S. Army contract to produce 25,000 ACH Gen II ballistic helmets under Defense Logistics Agency procurement.
- August 2025: Galvion won a five-year U.S. Marine Corps Integrated Helmet System contract valued at up to USD 131,396,296 for next-generation modular combat helmets.
- July 2025: Galvion received a five-year USD 10 Million FBI indefinite-delivery contract for its Hellbender Federal Edition ballistic helmet covering FBI, DEA, and U.S. Marshals procurement.
- November 2025: Galvion secured NATO Support and Procurement Agency orders pushing total Caiman ballistic helmet procurement beyond 250,000 units under framework contracts.
- January 2026: Team Wendy, Ceradyne, and Theon International launched a U.S. Army-funded program to develop an Integrated Multi-Threat Headborne System combining helmet protection with electro-optical systems.
Geopolitical Impact Analysis
Trade wars and tariff shifts now reshape armor material sourcing. According to the World Bank, global merchandise trade faces rising friction as tariff measures expand across major economies. Defense-grade para-aramid already trades at USD 40 to 80 per kilogram, and new duties on advanced fibers raise landed costs further. This means armor makers dependent on cross-border fiber imports face margin pressure. As a result, firms accelerate reshoring of critical material production to protect supply continuity.
Regional conflicts and rerouted logistics strain delivery timelines. Figures from SIPRI show world military expenditure reached USD 2,887 Billion in 2025, with European spending up 14% to USD 864 Billion. This surge collides with shipping delays as carriers reroute around conflict zones, extending transit windows. Therefore, buyers demanding 2 to 4 week conflict-driven delivery cannot rely on distant suppliers. Consequently, manufacturers with regional production capacity win contracts that global-only rivals lose to logistics risk.
Report Scope
| Report Features | Description |
|---|---|
| Market Value (2025) | USD 5.1 Billion |
| Forecast Revenue (2035) | USD 9.5 Billion |
| CAGR (2026-2035) | 6.4% |
| Base Year for Estimation | 2025 |
| Historic Period | 2020-2024 |
| Forecast Period | 2026-2035 |
| Report Coverage | Revenue Forecast, Market Dynamics, Market Opportunity Analysis, Technology and Innovation Landscape, Competitive Landscape, Recent Developments |
| Segments Covered | By Product Type (Body Armor / Vests, Helmets and Head Protection, Shields and Riot Gear, Plates and Inserts, Accessories), By Material Type (Kevlar / Aramid Fibers, UHMWPE, Steel / Metal Armor, Ceramic Armor, Others), By Application (Military and Defense, Law Enforcement and Police, Private Security, Civilian Protection), By End User (Armed Forces, Police and Law Enforcement Agencies, Security Agencies / Private Contractors, Civilian Users), By Level of Protection (NIJ Level II and IIa, NIJ Level III and IIIa, NIJ Level IV, Other Standards), By Form Factor (Soft Armor, Hard Armor, Hybrid Armor), By Distribution Channel (Direct Sales, Distributors and Dealers, Online / E-Commerce) |
| Regional Analysis | North America (US and Canada), Europe (Germany, France, The UK, Spain, Italy, and Rest of Europe), Asia Pacific (China, Japan, South Korea, India, Australia, and Rest of APAC), Latin America (Brazil, Mexico, and Rest of Latin America), Middle East and Africa (GCC, South Africa, and Rest of MEA) |
| Competitive Landscape | BAE Systems plc, Lockheed Martin Corporation, Northrop Grumman Corporation, Raytheon Technologies Corporation, Safariland Group, 3M Company, Honeywell International, DuPont, Point Blank Enterprises, Ceradyne Inc., Crye Precision, Team Wendy, Armor Express, Revision Military, DSA Inc. |
| Customization Scope | Customization for segments, region / country-level will be provided. Additional customization can be done based on requirements. |
| Purchase Options | We have three licenses to opt for: Single User License | Multi-User License (Up to 5 Users) | Corporate Use License (Unlimited User and Printable PDF) |





































