
Quick Navigation
- Report Overview
- Key Takeaways
- Component Analysis
- Technology Analysis
- Transportation Mode Analysis
- Solution Type Analysis
- Deployment Mode Analysis
- Key Market Segments
- Regional Analysis
- Key Regions and Countries
- Market Dynamics
- Drivers
- Restraints
- Challenges
- Opportunities
- Key Company Insights
- Recent Developments
- Report Scope
Report Overview
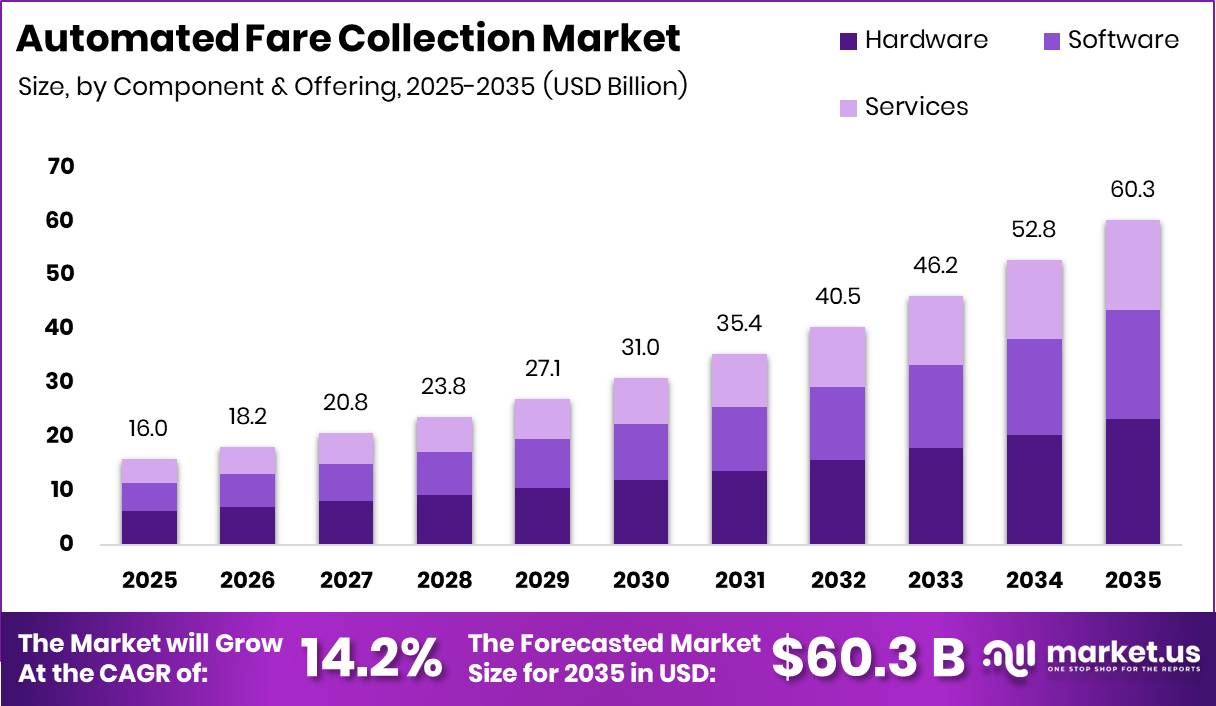
Global Automated Fare Collection Market size is expected to be worth around USD 60.3 Billion by 2035 from USD 16.0 Billion in 2025, growing at a CAGR of 14.2% during the forecast period 2026 to 2035. Transit authorities worldwide are replacing manual ticketing with electronic platforms. This shift signals a structural move toward account based fare management across rail, bus, and ferry networks.
This reflects a broader push toward interoperable payment infrastructure across global transit systems. The automated fare collection market covers hardware, software, and services that let riders pay fares through cards, mobile devices, or contactless terminals. These components work together to replace cash based ticketing with structured digital revenue systems.
Government transit authorities drive much of this transition through direct policy action. As reported by omny.info, the MTA’s weekly fare capping model grants free rides after 12 paid trips within a seven day period. This policy lowers costs for frequent commuters. Agencies adopting similar capping rules push vendors toward smarter, usage based payment platforms.
This signals growing confidence among transit operators in large scale contactless rollouts. According to AP News, more than 90% of New York City subway and bus trips were paid through the OMNY system by December 2025. This scale shows rapid retirement of legacy fare media. Vendors supporting metro scale contactless deployment gain a durable foothold in major urban networks.
Key Takeaways
- Global Automated Fare Collection Market size is valued at USD 16.0 Billion in 2025 and is projected to reach USD 60.3 Billion by 2035.
- The market is expected to grow at a CAGR of 14.2% between 2026 and 2035.
- Hardware leads the Component segment with a 38.75% share in 2025.
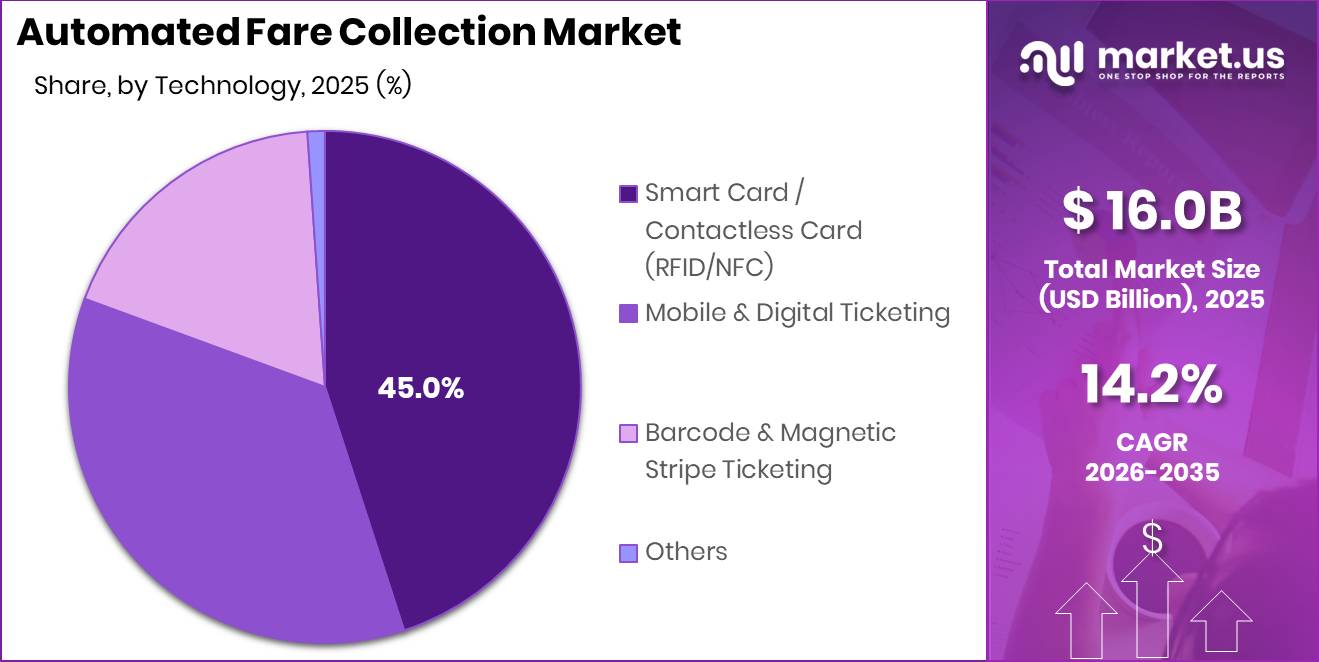
- Smart Card and Contactless Card technology leads the Technology segment with a 45.00% share.
- Railways and Metro lead the Transportation Mode segment with a 40.10% share.
- Closed-Loop AFC Systems lead the Solution Type segment with a 60.00% share.
- On-Premise deployment leads the Deployment Mode segment with a 62.00% share.
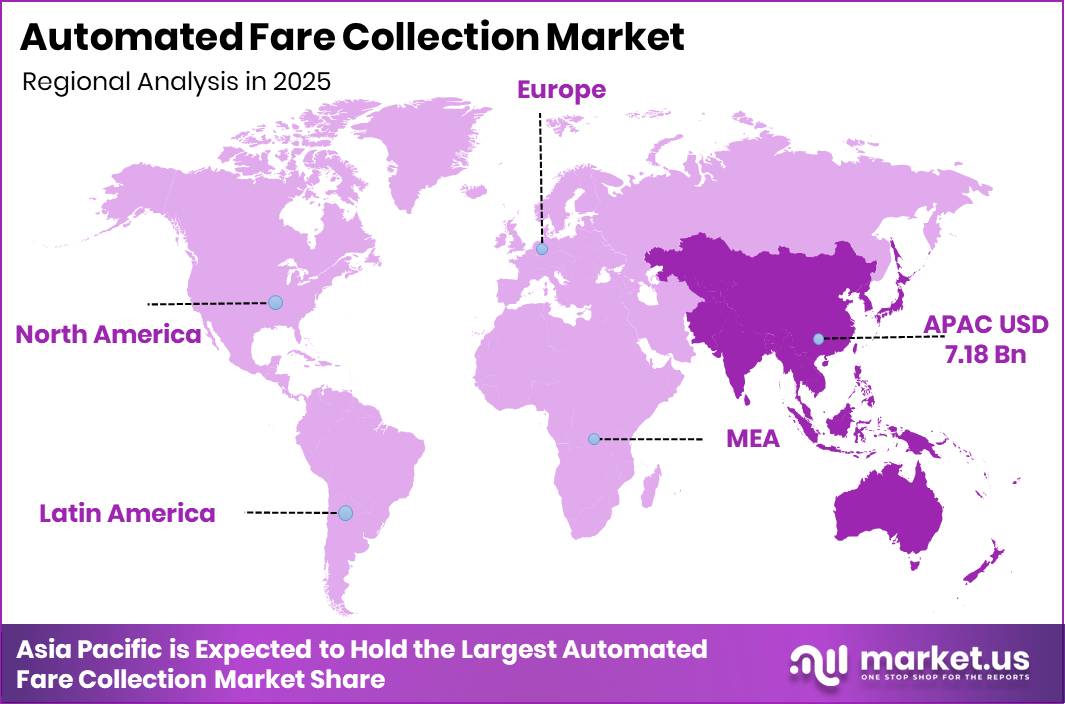
- Asia-Pacific dominates the regional market with a 45.00% share, valued at USD 7.18 Billion.
Component Analysis
Hardware dominates with 38.75% due to continuous terminal and validator deployment needs.
In 2025, Hardware held a dominant market position in the By Component segment of Automated Fare Collection Market, with a 38.75% share. Hardware includes ticket vending machines, point of sale terminals, fare boxes, and electronic validators. As reported by Metro Magazine, HID’s 2025 State of Mass Transit Ticketing Hardware Report surveyed 102 transit providers worldwide. This sample size confirms hardware investment remains a top priority for agencies upgrading legacy fare equipment.
Software ranked second with a 33.56% share, supporting fare management platforms and back office computer systems. Agencies depend on software to process transactions and reconcile revenue across multiple operators. This dependence creates recurring licensing revenue for vendors who control the core fare engine.
Services held a 27.69% share, covering system integration, managed operations, and maintenance support. Transit agencies increasingly outsource implementation to reduce internal technical burden. This trend favors vendors who bundle hardware sales with long term service contracts.
Technology Analysis
Smart Card / Contactless Card (RFID/NFC) dominates with 45.00% due to widespread tap based fare adoption.
In 2025, Smart Card / Contactless Card technology held a dominant market position in the By Technology segment of Automated Fare Collection Market, with a 45.00% share. According to corporate.visa.com, 91% of surveyed public transit users expected contactless payment options on public transit. This expectation pressures agencies still running magnetic or barcode systems to accelerate contactless rollouts.
Mobile & Digital Ticketing is gaining structural relevance as riders shift away from physical media. Data from corporate.visa.com shows 45% of surveyed riders preferred paying transit fares using contactless payments. This preference signals rising comfort with app based and tap to pay fare options among regular commuters.
Barcode & Magnetic Stripe Ticketing and other legacy formats hold the remaining technology share collectively. Agencies retain these formats mainly for unbanked riders and tourists without contactless cards. This creates a transitional window where vendors must support multiple payment formats simultaneously.
Transportation Mode Analysis
Railways & Metro / Subway dominates with 40.10% due to high daily ridership volume.
In 2025, Railways & Metro / Subway held a dominant market position in the By Transportation Mode segment of Automated Fare Collection Market, with a 40.10% share. As reported by corporate.visa.com, 62% of employed riders reported using public transit at least three times per week. This frequency drives consistent transaction volume through rail and metro fare gates daily.
Bus & Coach, Airways, Waterways, Road Toll, and other modes hold the remaining transportation mode share collectively. These modes generally adopt fare technology after rail networks establish proven platforms. This sequencing creates a secondary deployment wave for vendors already established in metro systems.
Solution Type Analysis
Closed-Loop AFC Systems dominate with 60.00% due to established stored value card infrastructure.
In 2025, Closed-Loop AFC Systems held a dominant market position in the By Solution Type segment of Automated Fare Collection Market, with a 60.00% share. Closed loop systems rely on agency issued cards and dedicated infrastructure. This control gives transit authorities direct ownership over fare media and revenue data.
Open-Loop AFC Systems are expanding through targeted regional rollouts. As reported by Metro Magazine, Denver RTD’s Tap-n-Ride platform recorded 13,305 users in January 2026, compared with 9,153 users in December 2025. This growth shows open loop platforms gaining traction once agencies launch contactless bank card acceptance. Metro Magazine also indicates RTD has set a target of 15% of all individual fare payments through Tap-n-Ride by the end of 2026, signaling a measurable shift toward open loop adoption. In February 2026, Masabi acquired Passenger Technology Group to combine its Justride fare collection system with Passenger’s mobile ticketing tools, strengthening open loop capable platforms available to transit agencies.
Deployment Mode Analysis
On-Premise deployment dominates with 62.00% due to agency control over sensitive fare data.
In 2025, On-Premise held a dominant market position in the By Deployment Mode segment of Automated Fare Collection Market, with a 62.00% share. Transit agencies favor on premise systems for direct oversight of servers and transaction records. This preference reflects regulatory caution around payment data hosted off agency property.
Cloud-Based deployment, spanning public, private, and hybrid cloud models, holds the remaining deployment share. Agencies adopting cloud platforms gain faster software updates and lower upfront infrastructure costs. This creates an opening for vendors offering hybrid models that satisfy both data control and scalability needs.
Key Market Segments
By Component / Offering
- Hardware
- Ticket Vending Machines (TVMs)
- Point-of-Sale (POS) Terminals
- Fare Boxes (Bus)
- Electronic Validators
- Software
- Fare Management Software
- Computer Systems
- Others
- Services
- System Integration & Implementation Services
- Managed Services & Operations
- Maintenance & Support Services
- Others
By Technology
- Smart Card / Contactless Card (RFID/NFC)
- Mobile & Digital Ticketing
- Barcode & Magnetic Stripe Ticketing
- Others
By Transportation Mode
- Railways & Metro / Subway
- Bus & Coach
- Airways / Airports
- Waterways / Ferry
- Road / Highway Toll
- Others
By Solution Type
- Closed-Loop AFC Systems
- Open-Loop AFC Systems
By Deployment Mode
- On-Premise
- Cloud-Based
- Public cloud
- Private cloud
- Hybrid cloud
Regional Analysis
Asia-Pacific Dominates the Automated Fare Collection Market with a Market Share of 45.00%, Valued at USD 7.18 Billion
Asia-Pacific leads the global market through dense metro networks and large scale national ticketing programs across China, Japan, South Korea, and India. Government backed unification efforts push agencies toward interoperable account based platforms. This regulatory direction supports steady hardware and software investment across the region’s rail and bus systems.
North America shows strong contactless conversion as transit authorities replace legacy card systems with open standard payment infrastructure. Regulatory pressure for cashless public services accelerates vendor selection cycles. This environment favors suppliers with proven interoperability across multiple transit agencies.
Europe maintains structured demand through cross border rail corridors and unified fare policy initiatives. Regional rail convergence efforts require account based clearing systems that support multiple operators. This structural need sustains long term software and integration contracts for established vendors.
Key Regions and Countries
North America
- US
- Canada
Europe
- Germany
- France
- The UK
- Spain
- Italy
- Rest of Europe
Asia Pacific
- China
- Japan
- South Korea
- India
- Australia
- Rest of APAC
Latin America
- Brazil
- Mexico
- Rest of Latin America
Middle East and Africa
- GCC
- South Africa
- Rest of MEA
Market Dynamics
Market Opportunity Analysis - Underserved transit modes and emerging regions offer clear entry points for new vendors
Open-Loop AFC Systems hold a small share of the Solution Type segment despite strong rider demand for contactless bank card payment. This means agencies still running closed loop infrastructure represent untapped upgrade accounts. New entrants offering rapid open loop integration can capture share before larger vendors expand coverage.
Bus, ferry, and toll road modes outside Railways & Metro remain underexploited relative to their combined ridership volume. This signals room for vendors to package validators and mobile ticketing tools specifically for these secondary transportation modes. Early movers can establish reference accounts before rail-focused vendors diversify.
Latin America and Middle East and Africa hold no individually reported share within the regional data, pointing to early stage market development. Therefore, vendors entering these regions face less entrenched competition than in Asia-Pacific or North America. This creates a window for agency partnerships ahead of broader regional formalization.
Cloud-Based deployment trails On-Premise by a wide margin despite offering faster update cycles. This means agencies have not fully tested cloud reliability for fare critical systems. Vendors who can prove security and uptime stand to convert cautious agencies still relying on on-premise infrastructure.
Technology and Innovation Landscape - Contactless adoption and open loop expansion are reshaping fare collection infrastructure
Smart Card and Contactless Card technology using RFID and NFC leads the Technology segment with a 45.00% share. This dominance reflects rider expectation for fast, tap based fare payment. Manufacturers investing in contactless validator durability can defend this lead as transaction volumes climb.
Mobile and Digital Ticketing is expanding as riders adopt smartphone based fare payment over physical cards. Data from corporate.visa.com shows 45% of surveyed riders preferred contactless payment methods for transit fares. This preference pushes agencies to integrate digital wallets directly into their fare gates.
Open-Loop AFC platforms, demonstrated by Denver RTD’s Tap-n-Ride system, show measurable monthly user growth alongside contactless bank card acceptance. As a result, agencies piloting open loop technology gain direct evidence of rider uptake before committing to full scale rollout. This evidence reduces procurement risk for hesitant transit boards.
Masabi’s acquisition of Passenger Technology Group combines Justride fare collection with mobile ticketing and real time passenger information tools. This combination signals consolidation toward unified mobility platforms. Buyers seeking single vendor solutions for fare and passenger information now have fewer integration steps to manage.
Drivers
National and state level unified transit card programs are a strong driver for automated fare collection modernization. These programs replace fragmented ticketing with interoperable payment platforms. Mumbai’s planned unified ticketing initiative aims to enable a single payment medium across metro, bus, and suburban rail services in the city.
Such programs require account based ticketing architectures that manage multiple operators, fare structures, and service zones through one framework. This raises demand for clearing, settlement, and customer account management systems. Transit authorities increasingly seek standardized platforms over isolated local deployments, supporting investment in capable, multi-agency AFC infrastructure.
| Driver | (~) % Impact on CAGR Forecast | Geographic Relevance | Impact Timeline |
|---|---|---|---|
| UN Decade of Sustainable Transport push | +2.4% | Global, especially large metros | Long term (≥ 4 years) |
| EMV and mobile wallet penetration | +2.2% | North America core, EU, GCC, East Asia | Short term (≤ 2 years) |
| National unified card programs | +2.0% | India, China, EU corridors | Medium term (2-4 years) |
| Government-backed urban mobility projects | +2.1% | Emerging Asia, Africa, LATAM | Medium term (2-4 years) |
| Ridership recovery and crowding management | +1.7% | Global tier-1 and tier-2 cities | Short term (≤ 2 years) |
| Policy pressure on cashless public services | +1.6% | EU regulatory hubs, UK, advanced APAC | Medium term (2-4 years) |
Restraints
Proprietary legacy lock-ins are a significant restraint in the AFC market because many transit agencies operate closed, vendor specific fare ecosystems. Validators, card media, security modules, and customer interfaces are tightly integrated, making partial upgrades difficult. Replacing a single component often forces broader system replacement, raising migration cost and risk.
Agencies frequently choose incremental upgrades because existing assets retain usable life. This can delay platform replacement by 3 to 7 years, slowing adoption of open standard technology. Contractual commitments and operational continuity concerns often outweigh potential efficiency gains, limiting opportunities for new vendors entering established accounts.
| Restraint | (~) % Impact on CAGR Forecast | Geographic Relevance | Impact Timeline |
|---|---|---|---|
| Limited formal transit footprint | -2.1% | Africa, LATAM, South Asia, secondary cities | Long term (≥ 4 years) |
| Public budget release delays | -1.8% | Emerging markets, EU municipalities, U.S. transit agencies | Medium term (2-4 years) |
| Proprietary legacy lock-ins | -1.6% | North America core, Europe, Japan | Medium term (2-4 years) |
| Banked-user dependency in open loop | -1.4% | Emerging Asia, Africa, LATAM | Long term (≥ 4 years) |
| Weak operator data maturity | -1.2% | Secondary metros, regional transit systems | Medium term (2-4 years) |
| Fare policy fragmentation | -1.5% | Multi-agency metros globally | Long term (≥ 4 years) |
Challenges
Legacy system interoperability remains one of the biggest challenges in the AFC market because agencies rarely replace fare infrastructure at once. Many networks run legacy smartcards, magnetic tickets, and standalone validators alongside newer account based platforms. Interface customization can consume 12% to 18% of total project engineering effort during modernization.
Message translation and integration issues can raise failed transaction handling by 1% to 3% during migration periods. Agencies often maintain old and new fare systems together for 18 to 36 months, extending testing requirements. This dual system environment increases vendor dependence and delays the realization of efficiency benefits.
| Challenge | (~) % CAGR Friction Drag | Geographic Relevance | Mitigation Horizon |
|---|---|---|---|
| Legacy system interoperability | -1.3% | Europe, North America, mature APAC metros | Medium term (2-4 years) |
| Multi-operator revenue clearing | -1.1% | India metros, EU corridors, LATAM capitals | Medium term (2-4 years) |
| Open-loop fraud management | -1.0% | North America, UK, EU, GCC | Short term (≤ 2 years) |
| Field hardware maintenance burden | -0.9% | Emerging Asia, Africa, LATAM, legacy-heavy systems | Medium term (2-4 years) |
| Data governance complexity | -0.8% | EU regulatory hubs, North America, advanced APAC | Long term (≥ 4 years) |
| Procurement and migration overruns | -1.2% | Global public transit agencies | Long term (≥ 4 years) |
Opportunities
Open loop transit payments represent a major opportunity for operators seeking to modernize fare collection. Riders pay directly with contactless bank cards and digital wallets, reducing dependence on closed loop stored value cards. In large transit networks, shifting 20% to 35% of occasional riders and tourists to open loop systems can significantly cut onboarding friction.
Such transitions can lower physical fare media management costs by 15% to 25% through reduced card issuance and replacement. Open loop systems ease access for visitors who already hold EMV enabled payment cards. Many agencies currently run only partial deployments, leaving substantial room for vendors to expand commercial partnerships.
| Opportunity | (~) % Potential CAGR Upside | Geographic Relevance | Execution Window |
|---|---|---|---|
| Open-loop transit payments | +2.6% | North America, EU, GCC, mature APAC | Short term (≤ 2 years) |
| Account-based fare orchestration | +2.3% | EU, UK, India metros, ASEAN capitals | Medium term (2-4 years) |
| MaaS bundle monetization | +2.1% | Dense megacities, multimodal urban corridors | Medium term (2-4 years) |
| Informal transit digitization | +2.7% | Africa, South Asia, LATAM | Long term (≥ 4 years) |
| Regional rail fare convergence | +1.9% | Europe, India, Japan, GCC corridors | Medium term (2-4 years) |
| Data-led pricing optimization | +1.8% | Global large transit agencies | Short term (≤ 2 years) |
Key Company Insights
Cubic Corporation holds a structural advantage through its established Umo Mobility platform deployed across multiple transit agencies. In September 2025, Cubic Transportation Systems launched Open Payments on Umo Mobility, letting riders pay with contactless bank cards, mobile wallets, and smartwatches. This move gives agencies enterprise grade open loop capability without building separate infrastructure, strengthening Cubic’s position in the open loop transition.
Thales Group brings deep expertise in secure payment and identity systems to transit fare platforms. Its security background supports agencies managing sensitive account based ticketing data across multiple operators. However, Thales competes against mobility specialists with narrower focus, requiring continued investment in transit specific product depth to defend its market position.
Key Players
- Cubic Corporation
- Thales Group
- Conduent Inc.
- Siemens AG
- Scheidt & Bachmann GmbH
- Indra Sistemas S.A.
- Omron Corporation
- GMV Innovating Solutions
- ST Engineering
- Samsung SDS Co. Ltd.
- LG CNS
- Masabi Ltd.
- Nippon Signal Co. Ltd.
- LECIP Holdings Corporation
- Advanced Card Systems Holdings Ltd. (ACS)
Recent Developments
- 2025 – Modeshift launched validating fareboxes in partnership with ITSMAX Solutions, integrating fareboxes, validators, mobile ticketing, and account based ticketing into one cloud based fare collection platform for transit agencies.
- 2025 – Modeshift introduced new AFC features including Fare Capping, Top-Up Card functionality, and Paid Transfers, alongside expanded digital ticket distribution to improve rider payment experiences and agency fare management.
Report Scope
| Report Features | Description |
|---|---|
| Market Value (2025) | USD 16.0 Billion |
| Forecast Revenue (2035) | USD 60.3 Billion |
| CAGR (2026-2035) | 14.2% |
| Base Year for Estimation | 2025 |
| Historic Period | 2020-2024 |
| Forecast Period | 2026-2035 |
| Report Coverage | Revenue Forecast, Market Dynamics, Market Opportunity Analysis, Technology and Innovation Landscape, Competitive Landscape, Recent Developments |
| Segments Covered | By Component / Offering (Hardware, Software, Services), By Technology (Smart Card / Contactless Card, Mobile & Digital Ticketing, Barcode & Magnetic Stripe Ticketing, Others), By Transportation Mode (Railways & Metro / Subway, Bus & Coach, Airways / Airports, Waterways / Ferry, Road / Highway Toll, Others), By Solution Type (Closed-Loop AFC Systems, Open-Loop AFC Systems), By Deployment Mode (On-Premise, Cloud-Based) |
| Regional Analysis | North America (US and Canada), Europe (Germany, France, The UK, Spain, Italy, and Rest of Europe), Asia Pacific (China, Japan, South Korea, India, Australia, and Rest of APAC), Latin America (Brazil, Mexico, and Rest of Latin America), Middle East and Africa (GCC, South Africa, and Rest of MEA) |
| Competitive Landscape | Cubic Corporation, Thales Group, Conduent Inc., Siemens AG, Scheidt & Bachmann GmbH, Indra Sistemas S.A., Omron Corporation, GMV Innovating Solutions, ST Engineering, Samsung SDS Co. Ltd., LG CNS, Masabi Ltd., Nippon Signal Co. Ltd., LECIP Holdings Corporation, Advanced Card Systems Holdings Ltd. (ACS) |
| Customization Scope | Customization for segments, region/country-level will be provided. Additional customization can be done based on requirements. |
| Purchase Options | We have three licenses to opt for: Single User License, Multi-User License (Up to 5 Users), Corporate Use License (Unlimited User and Printable PDF) |


