


Report Overview
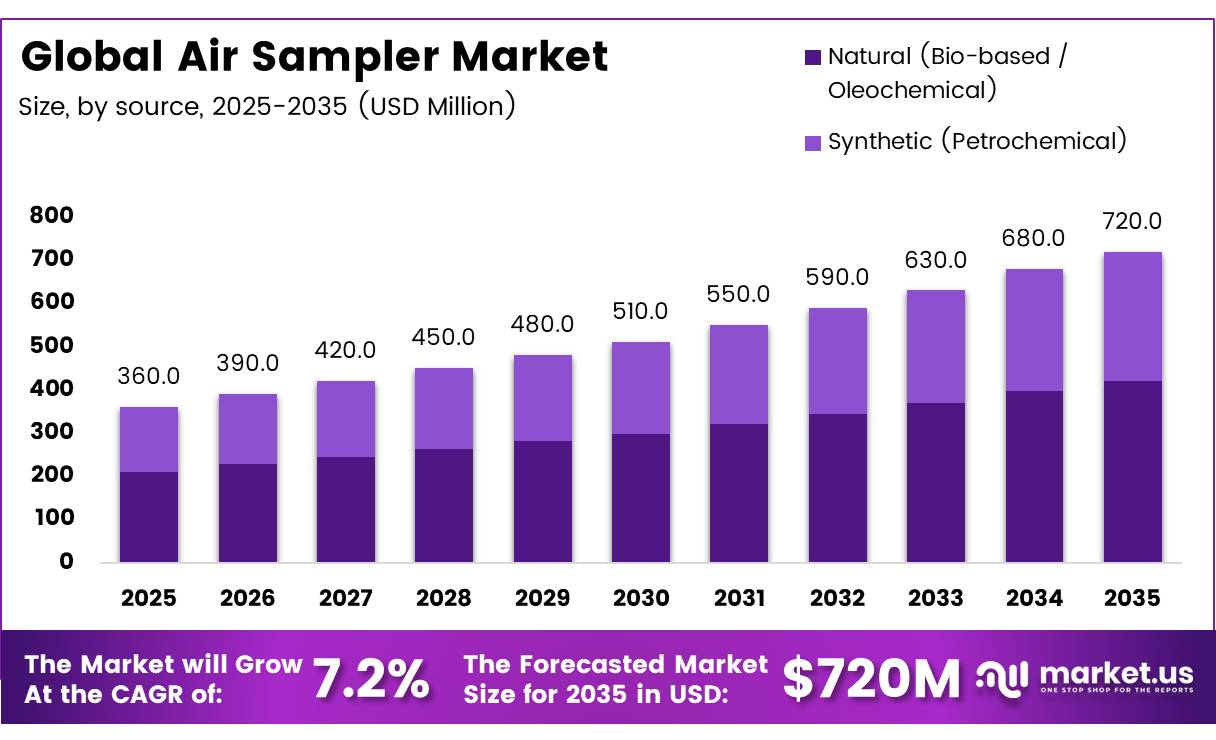
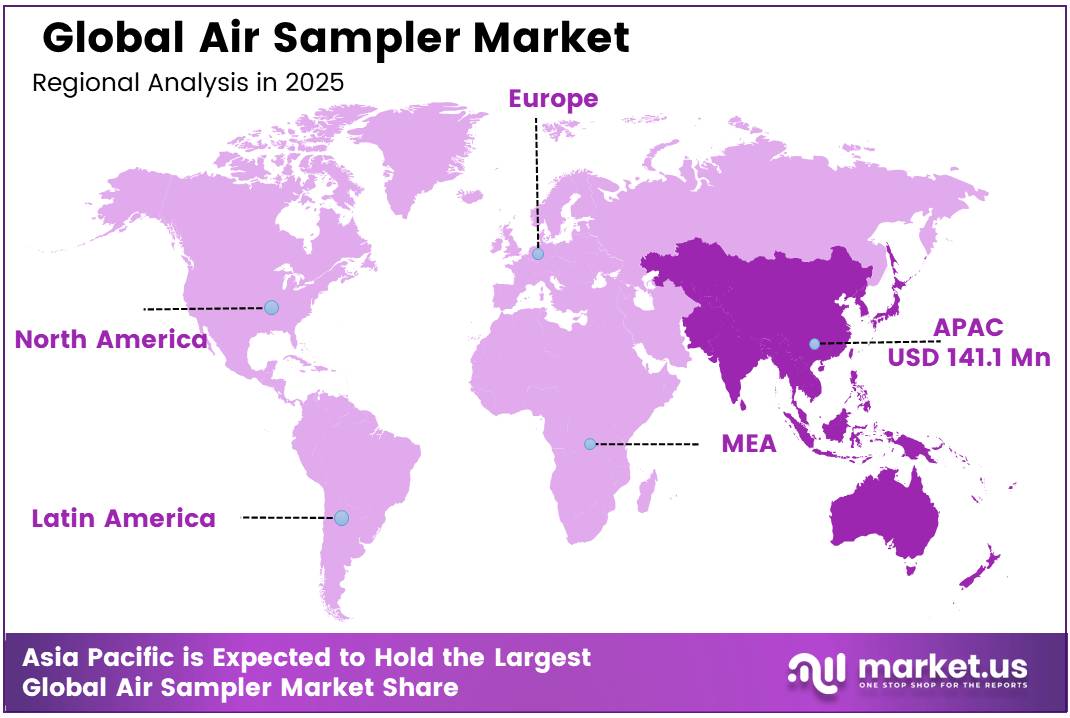
In 2025, the Global Air Sampler Market was valued at USD 360 Million, and between 2026 and 2035, this market is estimated to register a CAGR of 7.2% reaching about USD 720 Million by 2035. In 2025, Asia Pacific led the market, achieving over 39.20% share with a revenue of USD 141.1 Million.
Air samplers are essential instruments for collecting airborne particles, gases and microorganisms across environmental monitoring, occupational safety, pharmaceutical cleanrooms, hospitals, food plants and advanced manufacturing facilities.
- Demand is supported by the scale of air-quality risk: the World Health Organization reports that 99% of the global population lives where pollution exceeds its guideline limits, while ambient and household air pollution caused 6.6 million deaths in 2021.
Key Takeaways
- The Global Air Sampler Market was valued at US$360 Million in 2025.
- The Global Air Sampler Market is projected to grow at a CAGR of 7.2% and is estimated to reach US$720 Million by 2035.
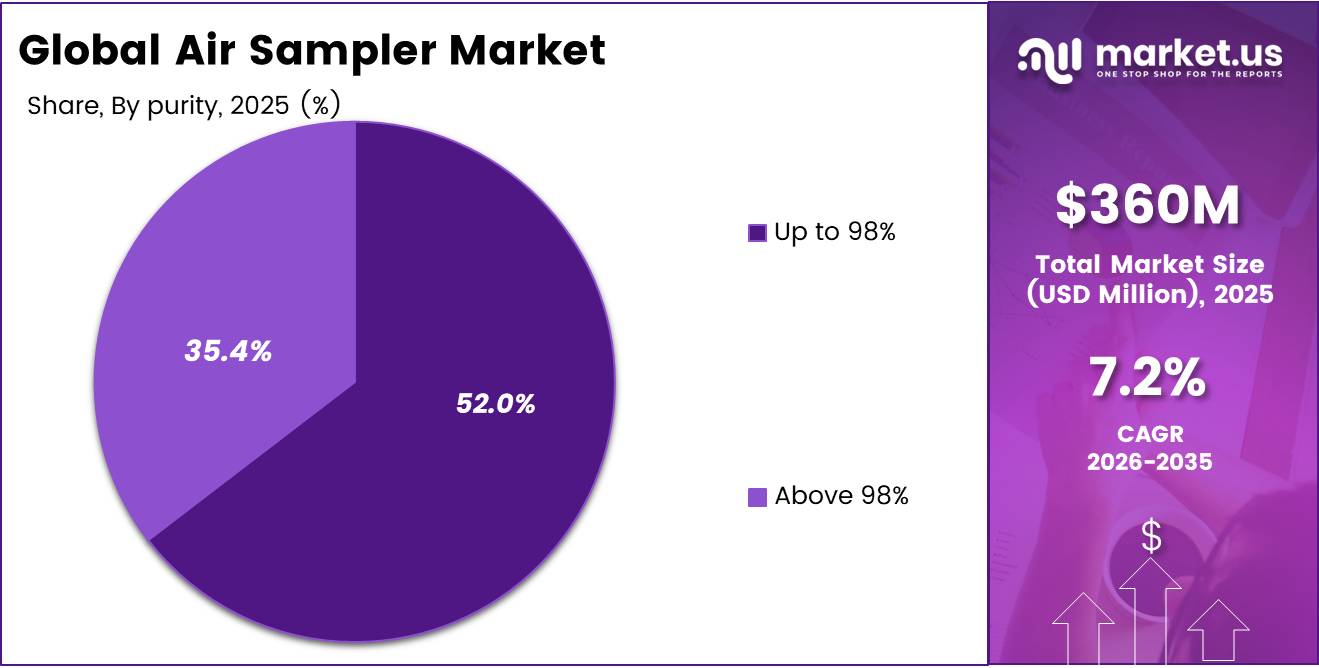
- On the basis of purity, the up to 98% purity segment dominated the Global Air Sampler market, constituting 64.60% of the total market share.
- Based on the Grade, the food grade dominated the air sampler market, with a substantial market share of around 52.00%.
- Based on the source, natural (bio-based / oleo chemical) led the market, comprising 58.50% of the total market.
- Among the end-use industries, the food & beverage industry held a major share in the air sampler market, accounting for 28.00% of the market share.
- Among the distribution channels, direct sales / B2B is the most considerable within the market, accounting for around 60.50% of the revenue.
- By region, Asia Pacific was the most dominant region in the air sampler market, accounting for 39.20% of the total consumption.
The industrial scenario is shifting toward portable, automated and digitally connected systems that provide size-selective particulate sampling, microbial detection and traceable data. Regulation remains a major purchasing driver. In February 2024, the U.S. EPA tightened the annual PM2.5 standard from 12.0 to 9.0 micrograms per cubic metre, while retaining the 24-hour limit at 35 micrograms. OSHA also requires silica exposure assessment from an action level of 25 micrograms per cubic metre and limits eight-hour exposure to 50 micrograms.
Future opportunities will expand through smart factories, cleanroom compliance, wildfire surveillance and urban monitoring networks. The European Union’s revised rules set a 2030 PM2.5 limit of 10 micrograms per cubic metre and target a 55% reduction in pollution-related premature deaths, encouraging higher deployment of accurate, low-maintenance samplers.
Purity Analysis
Up to 98% purity represents dominant Segment in the Market.
Up to 98% purity dominates the market with a 64.60% share because it provides an optimal balance between performance, affordability, and suitability for routine air monitoring applications. Products within this category meet the operational needs of environmental testing laboratories, industrial facilities, research institutions, and workplace monitoring programs without incurring the higher costs associated with premium-grade materials. Their broad availability, ease of procurement, and compatibility with standard analytical workflows make them the preferred choice for large-scale monitoring activities across diverse end-use industries.
Above 98% purity is the fastest-growing segment due to increasing demand for highly accurate and reliable air quality analysis in pharmaceutical manufacturing, semiconductor production, biotechnology laboratories, and advanced research facilities. As quality standards become more stringent, organizations are investing in premium-grade materials that support precise analytical performance and minimize the risk of contamination. Growing emphasis on regulatory compliance, validated testing procedures, and high-sensitivity environmental monitoring continues to drive adoption of higher-purity products across specialized industrial and scientific applications.
Grade Analysis
Food grade a significant Grade.
Food Grade held the leading market position, capturing more than a 52.00% share. Its dominance is supported by growing air-quality checks across ready-to-eat food, dairy, meat and beverage facilities, where airborne microorganisms can contaminate exposed products. The U.S. FDA’s January 2025 guidance recommends routine environmental monitoring programs for low-moisture ready-to-eat food plants. During inspections conducted between May and September 2025, the FDA examined 4 seafood-processing facilities, while separate environmental samples collected during 2025 detected Listeria monocytogenes within inspected food operations. These actions strengthen demand for hygienic, corrosion-resistant and easy-to-clean food-grade air samplers.
Pharmaceutical Grade is positioned as the fastest-growing segment due to stricter sterile-production and cleanroom monitoring requirements. EU GMP rules require continuous viable-air monitoring throughout critical Grade A processing. Particle samplers must operate at a minimum flow rate of 28 litres per minute, while Grade A limits are 3,520 particles per m³ for particles of at least 0.5 micrometres and 29 particles per m³ for particles of at least 5 micrometres.
Source Analysis
Natural (Bio-based / Oleochemical) Are the Most Widely Used Source.
Natural bio-based and oleochemical materials held a dominant market position, capturing more than a 58.50% share. Their leadership is supported by renewable sourcing, lower fossil dependence and increasing use in food, personal care, pharmaceutical and industrial formulations. In January 2025, the U.S. Department of Energy announced up to USD 23 million for developing chemicals and fuels from biomass and waste. The USDA also provides loan guarantees of up to USD 250 million for facilities producing renewable chemicals and bio-based products, supporting larger manufacturing capacity and commercial adoption.
Synthetic petrochemical materials are expected to remain the growing segment because they offer stable quality, high-volume availability and predictable processing performance. In March 2026, the U.S. Energy Information Administration reported that American ethane exports increased by 92,000 barrels per day, or 19%, during 2025. Ethane is mainly converted into ethylene, a core feedstock used across petrochemical manufacturing, supporting continued synthetic material production.
Distribution Channel Analysis
Direct sales and B2B Held a Major Share of the Air Sampler Market.
Direct sales and B2B channels dominate at 60.50% because regulated-use air sampling procurement is structurally unsuited to simple transactional purchasing. For instance, a national environmental monitoring agency procuring instruments for a PM2.5 ambient network under the EPA’s 40 CFR Part 58 regulations is legally required to document supplier qualification, verify Federal Reference or Equivalent Method (FRM/FEM) designations, and ensure calibration traceability to NIST reference materials.
Because anonymous digital marketplaces cannot fulfill these strict regulatory compliance steps, and WTO Government Procurement Agreement rules further mandate documented qualification processes, this highly regulated procurement remains firmly anchored in direct B2B tender relationships.
Online platforms are the fastest growing channel. Distributor-operated platforms integrating instrument specification databases, method cross-references, and automated compliance documentation generation are compressing procurement cycles for routine replacement purchases. Industrial hygiene cassettes, standard particulate samplers, and consumable filter media are increasingly transacted digitally in small and mid-size industrial facilities where dedicated procurement personnel are unavailable to manage each acquisition through a full direct-channel process.
End Use Analysis
Air Sampler Are Mostly Utilized in the Food and beverage.
Food and beverage leads at 28.00% because contamination-control economics in this sector are asymmetric in ways that make air sampling infrastructure a risk management imperative. A bakery product manufacturer operating under FDA’s mandatory recall reporting framework established under 21 CFR Part 7, for instance, faces not only the direct costs of a Class I recall triggered by airborne mold contamination but potential suspension of facility registration under FSMA Section 415, which halts all production and shipment operations until FDA determines the facility is safe to resume. This existential financial exposure is precisely why procurement officers in this sector treat air monitoring infrastructure as contamination risk insurance rather than a compliance cost center.
Pharmaceutical and healthcare is the fastest growing end-use. The WHO’s 2025 revision of Good Manufacturing Practices for sterile pharmaceutical products under WHO Technical Report Series Annex 6 introduced updated environmental monitoring frequency requirements, raising the minimum monitoring infrastructure standard globally. For multinational pharmaceutical companies, compliance with revised WHO GMP guidance is a precondition for WHO Prequalification, which determines eligibility for UN-procured essential medicine supply programs, making upgraded air sampling infrastructure a direct enabler of institutional procurement revenue rather than merely a regulatory cost.
Key Market Segments
By Purity
- Up to 98%
- Above 98%
By Grade
- Food Grade
- Industrial Grade
- Pharmaceutical Grade
- Others
By Source
- Natural (Bio-based / Oleochemical)
- Synthetic (Petrochemical)
By End-Use Industry
- Food & Beverage
- Cosmetics & Personal Care
- Pharmaceutical & Healthcare
- Paints, Coatings & Adhesives
- Agriculture
- Chemical Manufacturing
- Others
By Distribution Channel
- Direct Sales / B2B
- Distributors & Traders
- Online Platforms
Driver Analysis
Environmental standard tightening for particulate control
Ambient and indoor particulate awareness is increasing the long-tail addressable market for air sampling equipment by making airborne particulate levels more visible to regulators, employers, and facility owners. The US EPA’s tighter annual PM2.5 standard reduced the limit from 12 micrograms per cubic meter to 9 micrograms per cubic meter, took effect on May 6, 2024, and was projected by the agency to yield up to 4,500 avoided premature deaths, 290,000 fewer lost workdays, and up to $46 billion in net health benefits by 2032.
Although regulatory monitoring at the ambient level does not map one-for-one into microbial or occupational air samplers, it raises procurement willingness for complementary workplace and building-level sampling programs, especially in urban campuses, logistics sites, public buildings, and mixed-use facilities where proof-of-air-quality is becoming part of ESG, worker wellness, and tenant-retention economics.
Drivers Impact Analysis
| Driver | (~) % Impact on CAGR Forecast | Geographic Relevance | Impact Timeline |
|---|---|---|---|
| Sterile manufacturing compliance tightening | +1.8% | North America core, EU core, APAC pharma hubs | Short term (≤ 2 years) |
| Occupational exposure sampling enforcement | +1.3% | North America core, EU industrial base, GCC projects, APAC manufacturing belts | Short term (≤ 2 years) |
| Indoor air quality and fungal risk surveillance | +1.1% | North America, EU, Japan, South Korea, urban APAC spill-over | Medium term (2-4 years) |
| Cleanroom capacity expansion in advanced industries | +1.5% | US, EU, Taiwan, South Korea, Singapore, India corridors | Medium term (2-4 years) |
| Shift toward continuous and data-linked monitoring | +1.4% | North America, EU, developed APAC | Medium term (2-4 years) |
| Environmental standard tightening for particulate control | +0.9% | US core, EU spill-over, high-density Asian metros | Long term (≥ 4 years) |
Restraint Analysis
CapEx sensitivity in cleanroom and lab build-outs
CapEx sensitivity in cleanroom and laboratory projects acts as a significant drag on air sampler deployment because air sampling hardware is typically procured as part of broader facility or line upgrades whose budgets are exposed to interest-rate volatility, currency depreciation, and construction cost inflation, and while published estimates place global air sampling equipment spend in the low single-digit billions of dollars, many projects face 10–15% cost overruns on HVAC, filtration, and civil works that force scope reductions before instrumentation is fully specified.
For semiconductor and pharma investments, typical fab or sterile manufacturing projects can involve CapEx envelopes well above several hundred million dollars, with 3–5% contingency buffers that are quickly consumed when steel, copper, and labor costs rise, pushing non-core items such as additional sampler heads, redundancy in personal sampling, or higher-end digital units into later phases and extending replacement cycles beyond recommended 5–7 year windows.
Strategically, this delays volume growth, compresses margins because vendors must offer discounts and extended credit terms to stay on specification lists, and increases exposure to project deferrals, leaving air sampler suppliers more dependent on retrofit and maintenance budgets than on greenfield expansion in the 2026–2029 window.
Restraint Impact Analysis
| Restraint | (~) % Impact on CAGR Forecast | Geographic Relevance | Impact Timeline |
|---|---|---|---|
| CapEx sensitivity in cleanroom and lab build-outs | -1.7% | North America core, EU, APAC industrial corridors | Medium term (2-4 years) |
| Skilled technical staff and validation capacity gaps | -1.2% | Emerging APAC, Latin America, Middle East, Africa | Long term (≥ 4 years) |
| Fragmented regulatory and method standardization | -1.4% | North America, EU, multi-jurisdictional APAC | Medium term (2-4 years) |
| Component and electronics supply chain volatility | -1.3% | Global, with higher impact in APAC manufacturing belts | Short term (≤ 2 years) |
| Procurement conservatism and budget competition | -1.1% | Public-sector and hospital systems worldwide | Medium term (2-4 years) |
| Limited awareness and ROI clarity outside core regulated segments | -0.9% | SME industrial sites, commercial buildings, developing regions | Long term (≥ 4 years) |
Opportunity Analysis
Subscription-based sampler-as-a-service models
Sampler-as-a-service business models, where customers pay monthly or annual fees for bundled instruments, consumables, calibration, and analytics, remain nascent in 2026 and therefore represent a significant opportunity to unlock demand among capex-constrained segments that currently postpone purchases. Today’s baseline market is dominated by upfront hardware sales, with payback periods often stretching 3–5 years; shifting to subscription offerings at, for example, 3–5% of instrument list price per month spreads costs and allows vendors to reach hospitals, SMEs, and public agencies that cannot fund large capital projects but can commit to operating budgets.
Assuming 20–30% of new customers globally adopt sampler-as-a-service by 2030, and each contract includes bundled lab-support or data-management services, vendors could see a 10–20% uplift in average revenue per installed unit and smoother cash-flow profiles, while lowering customer acquisition barriers and tapping portions of TAM previously blocked by capex approvals.
This is not a current driver because most producers still operate under traditional sale-and-service modes, and financing is ad hoc; the opportunity is to standardize leasing and SaaS-like models, integrate instruments into IoT platforms, and scale multi-tenant offerings that handle compliance documentation, which could add around 1.5–2 percentage points of CAGR upside by converting latent, price-sensitive interest into practical uptake.
Opportunity Impact Analysis
| Opportunity | (~) % Potential CAGR Upside | Geographic Relevance | Execution Window |
|---|---|---|---|
| Integrated IAQ platforms for commercial real estate | +2.0% | North America core, EU, APAC tier-1 cities | Medium term |
| Subscription-based sampler-as-a-service models | +1.8% | North America, EU regulatory hubs, APAC emerging markets | Short term |
| AI-driven predictive exposure and outbreak analytics | +2.3% | Global public health hubs, industrial belts, large campuses | Medium term |
| Wearable and PPE-embedded micro-samplers | +1.7% | Industrial APAC corridors, EU high-risk workplaces, North America | Long term |
| Cross-vertical M&A roll-ups in environmental monitoring | +2.1% | Global (multi-region portfolios), especially EU and North America | Medium term |
| Digital compliance marketplaces and carbon/health credits | +1.9% | EU, UK, North America, advanced APAC | Long term |
Challenges Analysis
Advanced system lifecycle cost complexity
Advanced system lifecycle cost complexity is an ongoing challenge because air sampling is shifting from simple, standalone instruments to integrated environmental monitoring ecosystems that combine microbial samplers, particle counters, software, and service contracts, and while installed equipment markets in 2026 are estimated in the low single-digit billions of dollars, total cost of ownership over typical 7–10 year lifecycles can be 1.5–2.0 times initial hardware spend once calibration, media, repairs, and software updates are factored in.
Pharmaceutical and high-tech manufacturers deploying Grade A/B cleanroom EM programs often operate 50–200 sampling points per site, with each sampler requiring regular flow verification, media changes, and annual service that can add several tens of thousands of dollars per facility per year, and when budgets tighten, the friction is not a hard stop but a continuous negotiation that pushes upgrades into later phases or narrows feature configuration to core compliance needs.
Strategically, enterprises respond by strengthening internal asset-management discipline, negotiating multi-year service bundles to flatten cost curves, and demanding clearer per-batch or per-shift cost attribution from suppliers, which in turn requires vendors to invest in lifecycle analytics, standardized service pricing, and remote diagnostic capabilities to defend margins and keep sophisticated systems in rotation despite the ongoing friction of higher lifecycle cost visibility.
Challenges Impact Analysis
| Challenge | (~) % CAGR Friction Drag | Geographic Relevance | Mitigation Horizon |
|---|---|---|---|
| Advanced system lifecycle cost complexity | -1.3% | North America core, EU regulatory hubs, developed APAC | Medium term (2-4 years) |
| Cleanroom EM program design and data integration | -1.1% | Global pharma hubs, biotech clusters, CDMO networks | Medium term (2-4 years) |
| Mid-tier talent depth and bench strength | -1.0% | Emerging APAC, Latin America, Middle East, Africa | Long term (≥ 4 years) |
| Multi-use, multi-standard method harmonization | -0.9% | North America, EU, APAC cross-border supply chains | Long term (≥ 4 years) |
| Sensor, consumable, and calibration logistics variability | -0.8% | APAC manufacturing belts, global distribution corridors | Short term (≤ 2 years) |
| ESG and IAQ priority alignment in non-pharma sectors | -0.7% | Commercial buildings, SMEs, public infrastructure globally | Long term (≥ 4 years) |
Geopolitical Impact Analysis
Active conflicts are fracturing instrumentation supply chains and procurement pipelines globally.
The Russia-Ukraine war eliminated Ukraine’s dominant position in global neon and krypton supply, gases essential to excimer laser fabrication of precision optical sensors used in advanced air sampling instrumentation. Alternative production capacity in China, Germany, and the United States has not restored pre-war price stability, leaving air sampler manufacturers with unhedgeable input cost exposure that compresses instrument pricing predictability across multi-year supply contracts.
Houthi maritime attacks on Red Sea shipping corridors through 2024 and 2025 forced container rerouting around the Cape of Good Hope, extending Asia-to-Europe instrument delivery lead times by three to five weeks per shipment cycle. Drewry Shipping data confirmed freight premiums averaging 150 to 200% above pre-disruption baseline rates on affected lanes. Gulf region procurement officers responded by expanding inventory buffer requirements and prioritizing regional distribution partners over direct intercontinental manufacturer supply relationships, permanently altering procurement architecture in a strategically important growth market.
Regional Analysis
Asia Pacific Held the Largest Share of the Global Air Sampler Market.
Asia-Pacific leads at 39.20% because the combined scale of industrial manufacturing across China, India, Japan, and South Korea, supported by formally enforced national air quality legislative programs, generates a procurement base sustained by replacement and upgrade cycles rather than first-installation demand alone. A large agrochemical manufacturing cluster in Gujarat, India operating under National Clean Air Programme enforcement timetables, for instance, cannot defer air monitoring infrastructure deployment without triggering penalty proceedings under India’s Environment Protection Act 1986 as amended, converting a regulatory deadline into an immediate multi-unit procurement event across dozens of co-located facilities simultaneously.
Middle East and Africa is the fastest growing region. Saudi Arabia’s Vision 2030 industrial diversification agenda and the UAE’s National Industrial Strategy are commissioning large-scale petrochemical, pharmaceutical, and food processing facilities with mandatory air monitoring obligations embedded in operating licenses from inception. The Saudi Standards, Metrology and Quality Organization enforced updated industrial workplace air quality requirements across newly commissioned manufacturing facilities in 2025, creating first-generation procurement cycles in facilities with no prior monitoring infrastructure.
Key Regions and Countries Covered
- North America
- The US
- Canada
- Europe
- Germany
- France
- The UK
- Spain
- Italy
- Russia & CIS
- Rest of Europe
- APAC
- China
- Japan
- South Korea
- India
- ASEAN
- Rest of APAC
- Latin America
- Brazil
- Mexico
- Rest of Latin America
- Middle East & Africa
- GCC
- South Africa
- Rest of MEA
Key Players Analysis
Air sampler manufacturers focus on strengthening compliance service architecture, software integration capability, and calibration infrastructure breadth to maintain competitiveness. A key priority is continuous instrumentation innovation, including the development of real-time continuous monitoring platforms, IoT-enabled networked sampling nodes, and high-sensitivity optical particle detection systems that improve data defensibility, regulatory auditability, and contamination detection performance for advanced pharmaceutical and industrial hygiene applications.
Vertical integration with calibration service infrastructure and compliance software partners helps secure customer retention stability and improve contract economics amid intensifying regional competition from lower-cost Asian instrument producers. Strategic service network expansion across Asia-Pacific and Middle East markets enables alignment with concentrated first-generation procurement demand from industrial diversification and environmental enforcement ecosystems.
The Major Players In The Industry
- Thermo Fisher Scientific Inc.
- Sartorius AG
- bioMérieux SA
- Merck KGaA (MilliporeSigma)
- Particle Measuring Systems
- Lighthouse Worldwide Solutions
- MBV AG
- IUL Instruments
- Bio-Rad Laboratories, Inc.
- PerkinElmer Inc.
- SKC Inc.
- Restek Corporation
- TSI Incorporated
- Cherwell Laboratories
- Casella (Ideal Vacuum Products)
- Other Key Players
Key Development
- In January 2026, ORUM International announced commercial deployment scaling of its GENIUS continuous microbial air sampling system to serve up to 24 independent sampling points per installation, targeting GMP pharmaceutical cleanrooms with contracted initial capacity for more than 150 systems (≈3,600 sampling points) across Europe, backed by a reported €12 million production and validation investment for 2026
- In January 2026, Orum International announced the patenting of a high-precision calibration system for microbial air samplers integrated within an ISO/IEC 17025-accredited metrology laboratory.
Report Scope
| Report Features | Description |
|---|---|
| Market Value (2025) | USD 340 Mn |
| Forecast Revenue (2035) | USD 720 Mn |
| CAGR (2026-2035) | 7.2% |
| Base Year for Estimation | 2025 |
| Historic Period | 2020-2024 |
| Forecast Period | 2026-2035 |
| Report Coverage | Revenue Forecast, Market Dynamics, Competitive Landscape, Recent Developments |
| Segments Covered | By Purity (Up to 98% and Above 98%), By Grade (Food Grade, Industrial Grade, Pharmaceutical Grade, and Others), By Source (Natural (Bio-based / Organic) and Synthetic (Petrochemical)), By End-Use Industry (Food & Beverage, Cosmetics & Personal Care, Pharmaceutical & Healthcare, Paints, Coatings & Adhesives, Agriculture, Chemical Manufacturing, and Others), By Distribution Channel (Direct Sales / B2B, Distributors & Traders, and Online Platforms) |
| Regional Analysis | North America – The US & Canada; Europe – Germany, France, The UK, Spain, Italy, Russia & CIS, Rest of Europe; APAC– China, Japan, South Korea, India, ASEAN & Rest of APAC; Latin America– Brazil, Mexico & Rest of Latin America; Middle East & Africa– GCC, South Africa, & Rest of MEA |
| Competitive Landscape | Thermo Fisher Scientific Inc., Sartorius AG, bioMérieux SA, Merck KGaA (MilliporeSigma), Particle Measuring Systems, Lighthouse Worldwide Solutions, MBV AG, IUL Instruments, Bio-Rad Laboratories, Inc., PerkinElmer Inc., SKC Inc., Restek Corporation, TSI Incorporated, Cherwell Laboratories, Casella (Ideal Vacuum Products), Other Key Players |
| Customization Scope | Customization for segments, region/country-level will be provided. Moreover, additional customization can be done based on the requirements. |
| Purchase Options | We have three licenses to opt for: Single User License, Multi-User License (Up to 5 Users), Corporate Use License (Unlimited Users and Printable PDF) |





































