


Report Overview
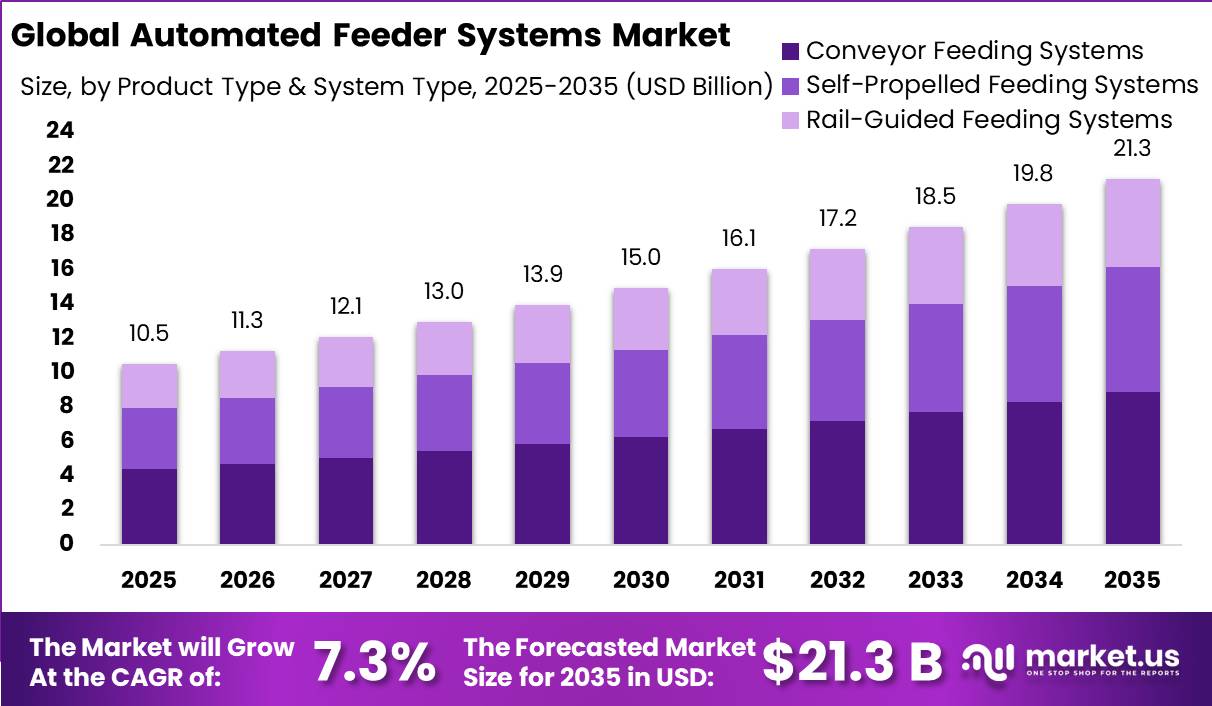
Global Automated Feeder Systems Market size is expected to be worth around USD 21.3 Billion by 2035 from USD 10.5 Billion in 2025, growing at a CAGR of 7.3% during the forecast period 2026 to 2035. This growth reflects steady replacement of manual feeding labor across livestock and aquaculture operations.
Automated feeder systems mix, control, fill, and deliver feed through conveyor, self-propelled, or rail-guided mechanisms. This means the market spans equipment built for ruminants, poultry, swine, and aquatic species. Therefore, system architecture varies widely by farm scale, integration level, and feed consistency requirements across regions.
Government bodies are tightening machinery safety and cybersecurity rules as feeder systems gain telemetry and remote diagnostics. As a result, manufacturers face added design verification and documentation work before networked platforms reach commercial launch. This regulatory shift raises compliance cost but also pushes vendors toward more defensible, certified product lines.
Trade policy adds a second layer of pressure on system cost. According to the Federal Register, tariffs on China origin semiconductors rose to 50% in 2025, while permanent magnet tariffs rise to 25% in 2026. This raises input costs for control units and motors used in smart feeding platforms, pushing OEMs toward sourcing diversification and regional component qualification.
Key Takeaways
- Global Automated Feeder Systems Market size is valued at USD 10.5 Billion in 2025 and is projected to reach USD 21.3 Billion by 2035.
- The market is set to expand at a CAGR of 7.3% between 2026 and 2035.
- Conveyor Feeding Systems dominate the Product and System Type segment with a 41.85% share.
- Ruminants lead the Livestock Type segment with a 45.90% share.
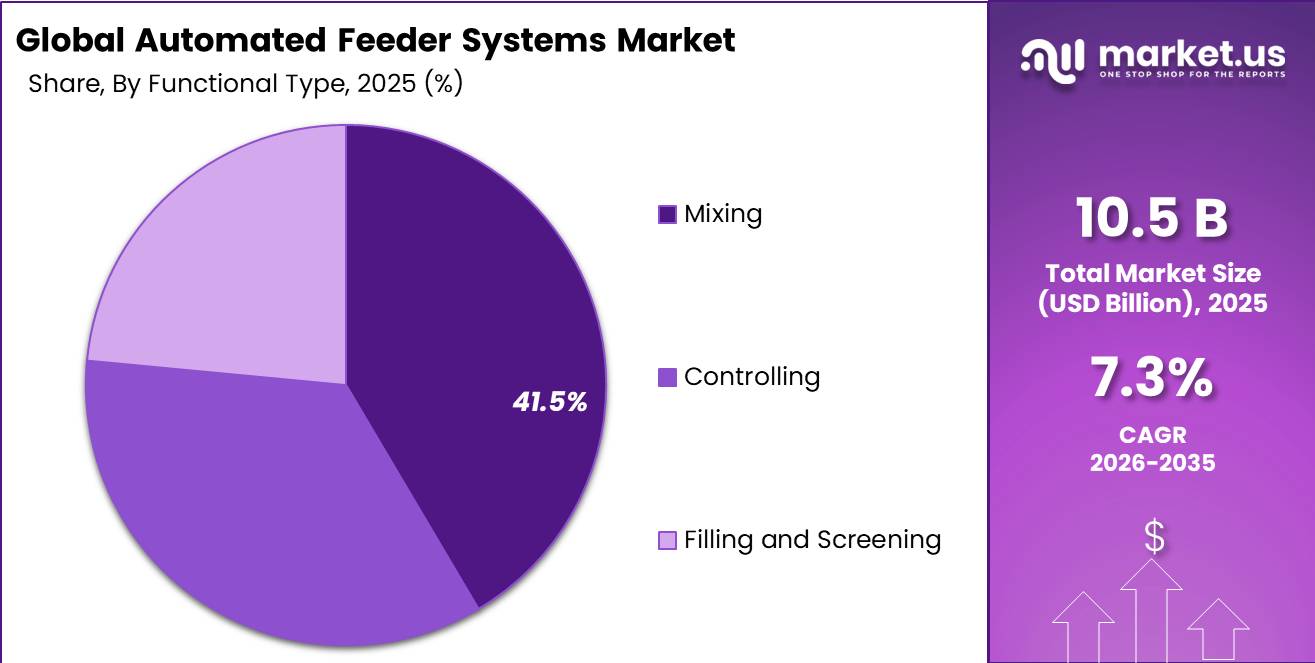
- Mixing leads the Functional Type segment with a 41.50% share.
- Fully Integration systems dominate the Integration segment with a 55.50% share.
- Dry Feeding Systems dominate the Feed Type segment with a 62.56% share.
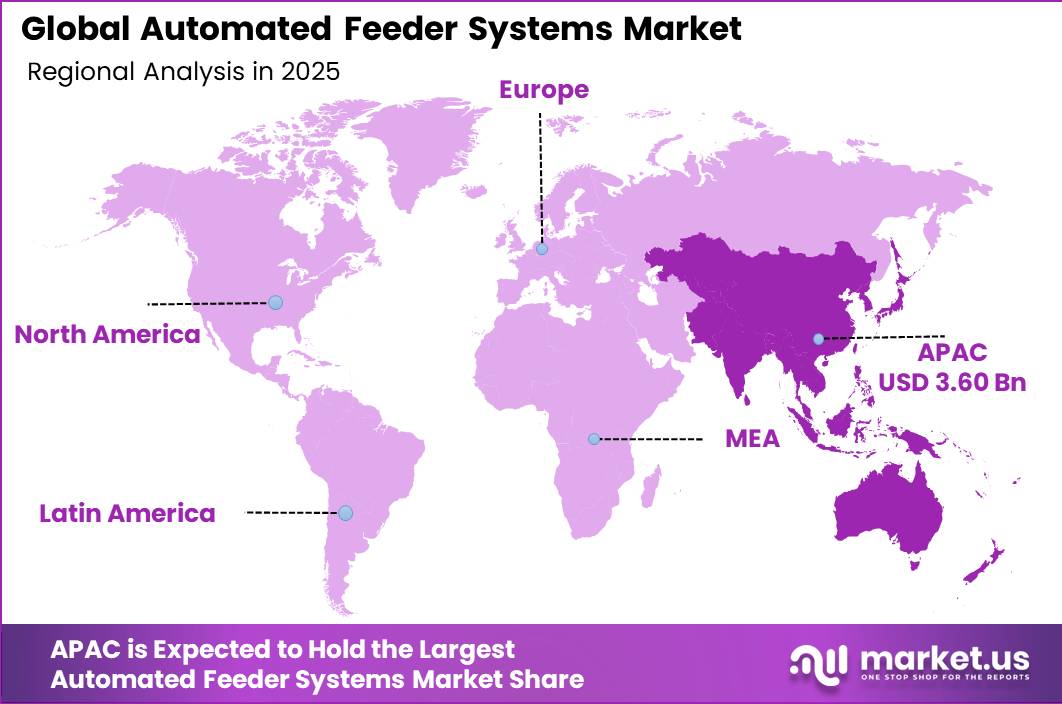
- Asia Pacific leads the regional market with a 34.2% share, valued at USD 3.60 Billion.
Product & System Type Analysis
In 2025, Conveyor Feeding Systems held a dominant market position in the By Product & System Type segment of Automated Feeder Systems Market, with a 41.85% share due to consistent delivery across large-scale operations.
In 2025, Conveyor Feeding Systems held a dominant market position in the By Product & System Type segment of Automated Feeder Systems Market, with a 41.85% share. These systems move large feed volumes across barn lengths with minimal manual intervention. Farms with high animal density rely on conveyors for consistent, low labor delivery.
Self-Propelled Feeding Systems serve operations needing route flexibility across multiple barns or pens without fixed installation. This mobility suits mixed farm layouts where conveyor infrastructure is impractical. As a result, adoption is rising fastest among mid-size operators upgrading from manual carts.
Rail-Guided Feeding Systems hold the remaining share of this segment, supporting facilities with fixed feeding paths and high repeatability needs. These systems suit barns prioritizing precise dosing over route flexibility, collectively rounding out the segment alongside conveyor and self-propelled formats.
Livestock Type Analysis
In 2025, Ruminants held a dominant market position in the By Livestock Type segment of Automated Feeder Systems Market, with a 45.90% share due to high dairy and beef herd automation.
In 2025, Ruminants held a dominant market position in the By Livestock Type segment of Automated Feeder Systems Market, with a 45.90% share. Dairy cattle and beef cattle operations drive this lead through scale economics. As per our research, robotic milking systems produced 6% of US milk in 2021, up from 4% in 2016. This signals growing operator comfort with automated livestock equipment, supporting further feeder adoption in dairy belts.
Poultry operations including broiler and layer farms are expanding feeder automation to manage high turnover cycles. This means feed timing precision directly affects flock growth uniformity. Consequently, poultry integrators are scaling automated systems faster than other livestock categories outside ruminants.
Swine and other livestock categories hold the remaining share of this segment, reflecting smaller individual herd sizes and slower automation uptake. These categories still contribute meaningful unit volume across mixed farming regions.
Functional Type Analysis
In 2025, Mixing held a dominant market position in the By Functional Type segment of Automated Feeder Systems Market, with a 41.50% share due to demand for ration consistency.
In 2025, Mixing held a dominant market position in the By Functional Type segment of Automated Feeder Systems Market, with a 41.50% share. Mixing units blend forage and concentrate feed to exact ratios before delivery. This reduces ration variance across daily feeding cycles, supporting steadier animal growth outcomes.
Controlling and Filling and Screening functions hold the remaining share of this segment, covering dosing precision and feed sorting tasks. These functions support mixing operations rather than replace them, working together within integrated feeding lines.
Integration Analysis
In 2025, Fully Integration held a dominant market position in the By Integration segment of Automated Feeder Systems Market, with a 55.50% share due to end to end automation demand.
In 2025, Fully Integration held a dominant market position in the By Integration segment of Automated Feeder Systems Market, with a 55.50% share. Fully integrated systems link mixing, controlling, and delivery into one managed platform. This reduces manual handoffs between feeding stages, appealing to large operators seeking centralized control.
Non Integration systems hold the remaining share, serving farms that prefer modular equipment purchased and upgraded in stages. This approach suits operators managing tighter capital budgets across multi-year automation rollouts.
Feed Type Analysis
In 2025, Dry Feeding Systems held a dominant market position in the By Feed Type segment of Automated Feeder Systems Market, with a 62.56% share due to storage and handling simplicity.
In 2025, Dry Feeding Systems held a dominant market position in the By Feed Type segment of Automated Feeder Systems Market, with a 62.56% share. Dry feed handles easily across storage, transport, and dosing equipment. This lowers spoilage risk compared with liquid alternatives, supporting wider equipment compatibility across farm types.
Wet and Liquid Feeding Systems hold the remaining share, serving operations using by product or liquid ration components. These systems require dedicated handling equipment, limiting uptake to farms with established liquid feed supply chains.
Key Market Segments
By Product & System Type
- Conveyor Feeding Systems
- Self-Propelled Feeding Systems
- Rail-Guided Feeding Systems
By Livestock Type
- Ruminants
- Dairy Cattle
- Beef Cattle
- Poultry
- Broiler
- Layer
- Swine
- Other
By Functional Type
- Mixing
- Controlling
- Filling and Screening
By Integration
- Fully Integration
- Non-Integration
By Feed Type
- Dry Feeding Systems
- Wet & Liquid Feeding Systems
Regional Analysis
Asia Pacific Dominates the Automated Feeder Systems Market with a Market Share of 34.2%, Valued at USD 3.60 Billion
Asia Pacific leads the market through large livestock populations and expanding aquaculture operations across China, Vietnam, and Indonesia. Farm consolidation across the region pushes operators toward mechanized feeding to manage labor shortages. In 2025, AKVA Group continued deploying automated feeding and digital farm management technologies across marine aquaculture operations in the region, expanding intelligent feeding capacity for large scale fish farms.
North America holds a strong position through established dairy and swine automation infrastructure. Wage pressure across farm labor markets pushes operators toward conveyor and fully integrated systems. This sustains steady equipment replacement cycles across established feeding operations.
Europe maintains significant share through regulatory pressure on welfare, traceability, and emissions reporting across livestock operations. Machinery safety and cybersecurity rules push manufacturers toward certified, networked feeding platforms. This regulatory structure favors vendors building compliant, data capable systems.
Middle East and Africa show measured uptake tied to commercial livestock and aquaculture expansion in select markets. Limited farm financing access slows broader equipment penetration across smallholder operations. This keeps adoption concentrated among larger commercial producers.
Key Regions and Countries
North America
- US
- Canada
Europe
- Germany
- France
- The UK
- Spain
- Italy
- Rest of Europe
Asia Pacific
- China
- Japan
- South Korea
- India
- Australia
- Rest of APAC
Latin America
- Brazil
- Mexico
- Rest of Latin America
Middle East and Africa
- GCC
- South Africa
- Rest of MEA
Market Dynamics
Market Opportunity Analysis - Underserved livestock categories and emerging regions offer entry points for new feeder system vendors
Swine operations remain underexploited within the livestock segment despite established ruminant and poultry automation. This signals room for vendors building feeders sized for swine housing density. Investors targeting this gap can enter before larger competitors shift focus from dairy and poultry lines.
Rail-Guided Feeding Systems hold a smaller position within the product segment compared with conveyor and self-propelled formats. This creates room for vendors specializing in fixed-path precision delivery. Therefore, manufacturers focusing on repeatable dosing accuracy can capture niche barn retrofit demand.
Middle East and Africa show measured regional uptake compared with Asia Pacific and North America. This reflects limited farm financing access rather than weak underlying demand. Consequently, vendors offering flexible payment structures can capture share ahead of broader regional financing reform.
Latin America shows growing but still developing adoption tied to export livestock and aquaculture production. This means equipment vendors entering early can build distribution relationships before competition intensifies. By contrast, mature regions like North America already carry established competitive density.
Technology and Innovation Landscape - Computer vision and AI-driven measurement models sharpen feeding precision across aquaculture operations
Artificial intelligence powered fish growth measurement is advancing feeding precision in aquaculture. As per our research, a 2024 automated fish feeding study reported its growth measurement model identified fish body length with less than 0.1% deviation. This level of accuracy lets operators fine-tune feed quantity to actual fish size rather than estimates.
Computer vision and artificial intelligence adoption is rising across advanced fish farming programs. According to a 2024 peer-reviewed study, fish farming programs using advanced technologies applied computer vision in 51% of cases and artificial intelligence in 70% of cases. This signals a shift toward data-driven feeding decisions over manual observation.
IoT enabled feeding platforms now combine feed sensors with water quality and level monitoring in aquaculture settings. This creates centralized visibility across multiple remote sites from one control interface. Operators managing offshore cages benefit most, since manual monitoring across dispersed locations is difficult.
Drivers
Aquaculture operations increasingly adopt automated feeding because feed precision directly affects fish growth, water quality, and labor efficiency. IoT enabled systems combining feed sensors with water monitoring deliver efficiency gains near 10% to 15% and cut feed waste by up to 15%.
These platforms suit remote sites such as offshore cages and recirculating systems where manual feeding is difficult. System costs range from roughly £2,000 for basic timer units to over £50,000 for advanced AI driven solutions. The 18 to 36 month return window supports adoption across export oriented aquaculture markets including Norway, Chile, China, Vietnam, Indonesia, and Scotland.
| Driver | (~) % Impact on CAGR Forecast | Geographic Relevance | Impact Timeline |
|---|---|---|---|
| Labor scarcity and wage inflation accelerating feeder automation | +2.2% | North America core, Western Europe core, Australia/NZ, Japan/Korea | Short term (≤ 2 years) |
| Feed-cost volatility and feed-efficiency optimization lifting ROI | +1.9% | EU, US/Canada, China, Brazil, Southeast Asia | Short term (≤ 2 years) |
| Precision livestock farming and sensor-led feeding intelligence | +1.7% | North America, EU, China, Japan, advanced APAC corridors | Medium term (2-4 years) |
| Dairy, swine and poultry farm consolidation increasing system-scale demand | +1.5% | US, Canada, Germany, Netherlands, China, India, Brazil | Medium term (2-4 years) |
| Sustainability, methane, welfare and traceability compliance pressure | +1.3% | EU core, UK, North America, Oceania spill-over | Medium term (2-4 years) |
| Aquaculture intensification and remote feeding deployment | +1.1% | Norway, Chile, China, Vietnam, Indonesia, Scotland/UK | Medium term (2-4 years) |
Restraints
Connected feeder systems face rising compliance burden as telemetry, remote diagnostics, and software updates pull machinery safety toward cybersecurity rules. Europe’s Machinery Regulation now requires cybersecurity integration as part of CE marking evidence for networked equipment.
This adds roughly 2% to 5% to product development cost and extends time to market by 3 to 9 months for networked platforms. Smaller manufacturers face disproportionate certification burden, while buyers face longer validation cycles, slowing conversion in the premium smart feeding segment.
| Restraint | (~) % Impact on CAGR Forecast | Geographic Relevance | Impact Timeline |
|---|---|---|---|
| High upfront CapEx | -2.1% | APAC, LATAM, MEA; SME farms globally | Medium term (2-4 years) |
| Feed-cost volatility | -1.4% | EU, North America, APAC dairy belts | Short term (≤ 2 years) |
| Tariffed components & metals | -1.2% | North America core; export-linked EU/APAC suppliers | Short term (≤ 2 years) |
| Compliance burden for smart machinery | -0.9% | EU core; regulated OECD markets | Medium term (2-4 years) |
| Tight farm financing | -1.6% | Emerging markets; rate-sensitive OECD buyers | Short term (≤ 2 years) |
| Smallholder digital readiness gap | -1.1% | India, Southeast Asia, Africa, LATAM | Long term (≥ 4 years) |
Challenges
Industrial machinery supply chains face renewed cost unpredictability where feeder systems rely on imported motors, pumps, and electromechanical assemblies with China linked content. New US tariff structures include 25% rates on selected industrial machinery and up to 145% on certain electronics linked items.
This tariff pressure does not eliminate demand since labor saving economics still support adoption. However, it can add 4% to 9% to bill of materials cost and require 60 to 90 day supplier requalification cycles, tying up 8 to 12 weeks of extra inventory during sourcing transitions.
| Challenge | (~) % CAGR Friction Drag | Geographic Relevance | Mitigation Horizon |
|---|---|---|---|
| Controls Component Volatility | -1.4% | North America core, EU automation hubs, APAC export corridors | Medium term (2-4 years) |
| Integrator Capacity Bottlenecks | -1.2% | North America core, Western Europe, developed APAC | Medium term (2-4 years) |
| Field Service Talent Gaps | -1.0% | North America dairy belts, EU livestock clusters, ANZ | Long term (≥ 4 years) |
| Feedstock Variability Calibration | -0.9% | APAC mixed-farm zones, Latin America, MEA | Medium term (2-4 years) |
| Data Traceability Fragmentation | -0.8% | EU regulatory hubs, North America enterprise farms | Medium term (2-4 years) |
| Tariff-Driven BOM Instability | -1.1% | US import channels, China-linked supply chains, India relocation lanes | Short term (≤ 2 years) |
Opportunities
Current market demand centers on productivity and labor economics, while the next growth phase comes from positioning feeder systems as compliance infrastructure for welfare and traceability. European livestock policy increasingly stresses welfare, prudent antimicrobial use, and integrated data driven feeding systems.
Vendors can build premium SKUs documenting feeding frequency, bunk access, and exception events for processors and auditors. This opens higher margin sales into export dairy, poultry, and pork chains, where compliance premiums can justify 10% to 15% higher prices and software attach rates above 50%, offering roughly 1.4% incremental CAGR upside.
| Opportunity | (~) % Potential CAGR Upside | Geographic Relevance | Execution Window |
|---|---|---|---|
| Aquaculture precision feeders | +2.6% | APAC emerging markets, Nordics, Chile | Medium term |
| Feeder-as-a-service | +1.9% | North America core, EU, ANZ | Short term |
| Retrofit software layer | +1.6% | EU, North America, Japan | Short term |
| Poultry mega-farm roll-ups | +2.1% | APAC emerging markets, LatAm, MENA | Medium term |
| Welfare-compliance feeding | +1.4% | EU, UK, premium export markets | Medium term |
| Dealer-led SME financing | +1.7% | India, Southeast Asia, Africa, LatAm | Short term |
Key Company Insights
Yanmar Holdings strengthens its aquaculture position through remote feeding technology that pairs feed delivery with seawater mixing to cut energy use in offshore operations. As per our research, global aquaculture production reached 103 Million tonnes in 2024, representing 53% of total aquatic animal output, supporting demand for remote feeding platforms like Yanmar’s offshore system.
Jetfeeder targets hatchery and juvenile fish production through centralized control platforms that integrate culture parameters into one management interface. As per our research, FAO reported aquaculture output including algae reached 141 Million tonnes in 2024, valued at USD 391 Billion, creating a large base for feeding and monitoring system providers like Jetfeeder.
Key Players
- Yanmar Holdings
- Jetfeeder
- FishFarmFeeder
- AKVA Group
- Tetra Laval International / DeLaval
- AGCO Corporation
- Trioliet B.V.
- VDL Agrotech
- BouMatic LLC
- Pellon Group Oy
- Rovibec Agrisolutions
- ScaleAQ & AKVA Group
- Dairymaster
Recent Developments
- January 2026 – Jetfeeder launched its new Nursery Edition Automatic Feeder designed for hatcheries and juvenile fish production, featuring real time feeder management and centralized control platform integration.
- February 2026 – FishFarmFeeder expanded its automated aquaculture feeding portfolio with enhanced solutions for hatchery, pre fattening, and offshore farming applications, strengthening its precision aquaculture presence.
Report Scope
| Report Features | Description |
|---|---|
| Market Value (2025) | USD 10.5 Billion |
| Forecast Revenue (2035) | USD 21.3 Billion |
| CAGR (2026-2035) | 7.3% |
| Base Year for Estimation | 2025 |
| Historic Period | 2020-2024 |
| Forecast Period | 2026-2035 |
| Report Coverage | Revenue Forecast, Market Dynamics, Market Opportunity Analysis, Technology and Innovation Landscape, Competitive Landscape, Recent Developments |
| Segments Covered | By Product & System Type (Conveyor Feeding Systems, Self-Propelled Feeding Systems, Rail-Guided Feeding Systems), By Livestock Type (Ruminants, Poultry, Swine, Other), By Functional Type (Mixing, Controlling, Filling and Screening), By Integration (Fully Integration, Non-Integration), By Feed Type (Dry Feeding Systems, Wet & Liquid Feeding Systems) |
| Regional Analysis | North America (US and Canada), Europe (Germany, France, The UK, Spain, Italy, and Rest of Europe), Asia Pacific (China, Japan, South Korea, India, Australia, and Rest of APAC), Latin America (Brazil, Mexico, and Rest of Latin America), Middle East and Africa (GCC, South Africa, and Rest of MEA) |
| Competitive Landscape | Yanmar Holdings, Jetfeeder, FishFarmFeeder, AKVA Group |
| Customization Scope | Customization for segments, region/country-level will be provided. Additional customization can be done based on requirements. |
| Purchase Options | We have three licenses to opt for: Single User License, Multi-User License (Up to 5 Users), Corporate Use License (Unlimited User and Printable PDF) |





































