
Global 3D E-Commerce Market Size, Share, Industry Analysis Report By Type (3D Scanning, Photogrammetry, 3D Design, 3D Rendering, Others), By Application (Clothes, Automobile, Furniture, Others), By Regional Analysis, Global Trends and Opportunity, Future Outlook By 2025-2034
- Published date: Oct. 2025
- Report ID: 161959
- Number of Pages: 343
- Format:
-
keyboard_arrow_up
Quick Navigation
- Report Overview
- Top Market Takeaways
- Conversion and Sales
- Customer Engagement
- Returns and Satisfaction
- US Market Size
- By Type
- By Application
- Emerging Trends
- Growth Factors
- Key Market Segments
- Driver Analysis
- Restraint Analysis
- Opportunity Analysis
- Challenge Analysis
- Competitive Analysis
- Recent Developments
- Report Scope
Report Overview
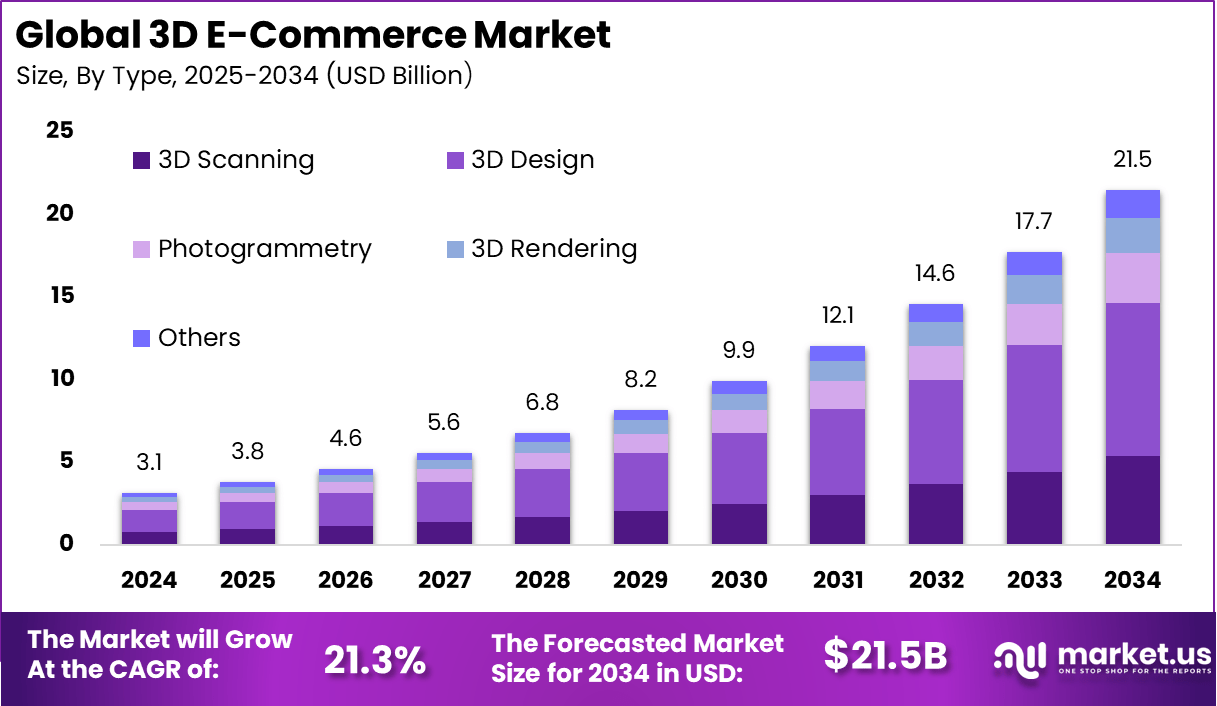
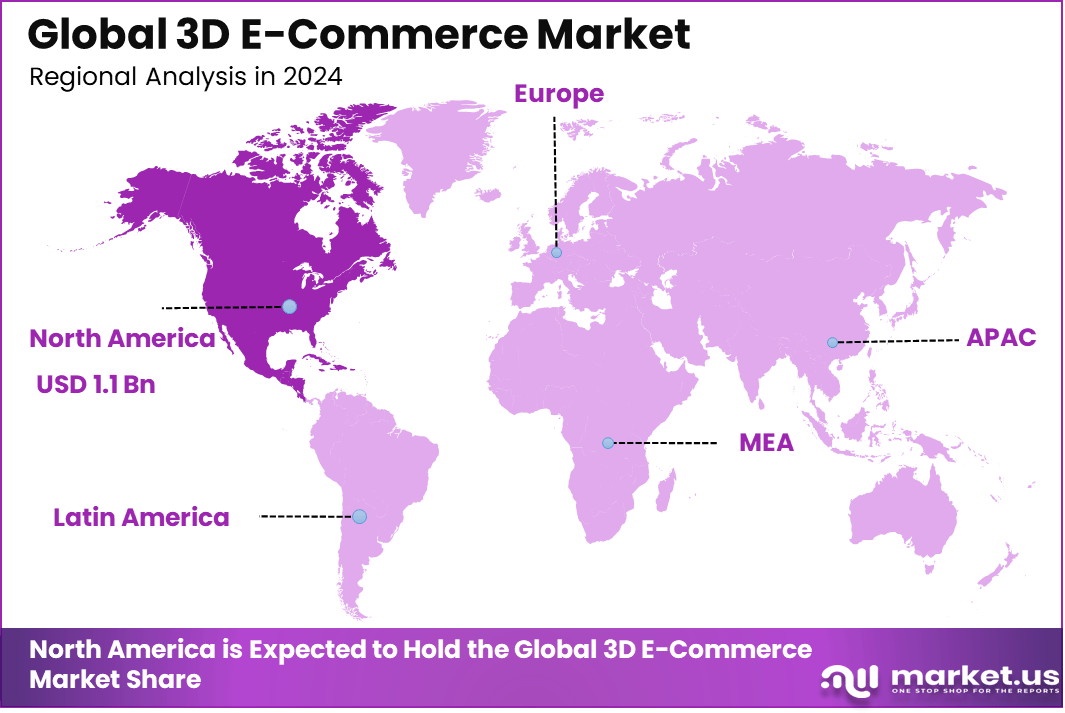
The Global 3D E-Commerce Market generated USD 3.1 billion in 2024 and is predicted to register growth from USD 3.8 billion in 2025 to about USD 21.5 billion by 2034, recording a CAGR of 21.3% throughout the forecast span. In 2024, North America held a dominan market position, capturing more than a 38.0% share, holding USD 1.1 Billion revenue.
The 3D E-commerce market refers to the integration of three-dimensional (3D) product models, interactive visualisation, augmented reality (AR), and sometimes virtual reality (VR) into online commerce platforms so that consumers can view, rotate, zoom, configure and virtually place products in real-world contexts before purchase. This enhancement of the digital shopping experience aims to replicate or improve upon the in-store tactile and spatial inspection of products.
A major driver is the need to reduce product return rates caused by uncertainty about size, fit, color, or design. Retailers use 3D visualization to give buyers a more accurate understanding of products. Growth in augmented reality-enabled smartphones and web-based rendering tools has made these features easier to adopt. Demand for personalized and immersive shopping experiences also supports expansion.
3D e-commerce has shown a strong impact on customer behavior and sales performance. Businesses adopting 3D product visualization report up to a 94% rise in conversion rates, supported by higher engagement levels. Around 82% of shoppers activate the 3D view, and many spend more than 30 seconds interacting with the product, indicating deeper purchase intent.
The technology also improves buyer confidence by offering a clearer understanding of product features. Approximately 66% of shoppers feel more assured about their purchase after using a 3D configurator, which helps address doubts that usually lead to hesitation. This higher confidence directly contributes to stronger purchase decisions. In addition to boosting sales, 3D experiences lead to a 40% decline in product returns, as customers get a more accurate view before checkout
Top Market Takeaways
- By type, 3D design leads with 43.2%, reflecting its role in creating immersive and interactive shopping experiences.
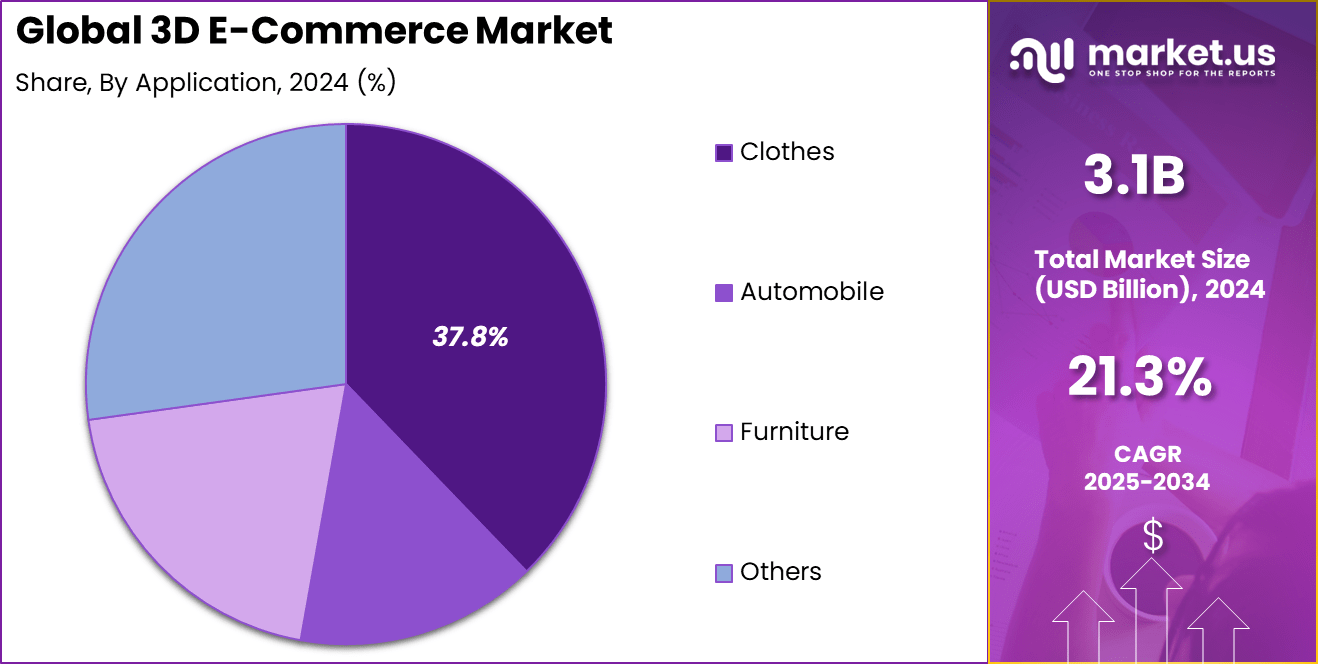
- By application, clothing dominates with 37.8%, driven by demand for virtual try-on and personalized fashion retail.
- North America accounts for 38%, supported by advanced e-commerce ecosystems and early adoption of 3D retail technologies.
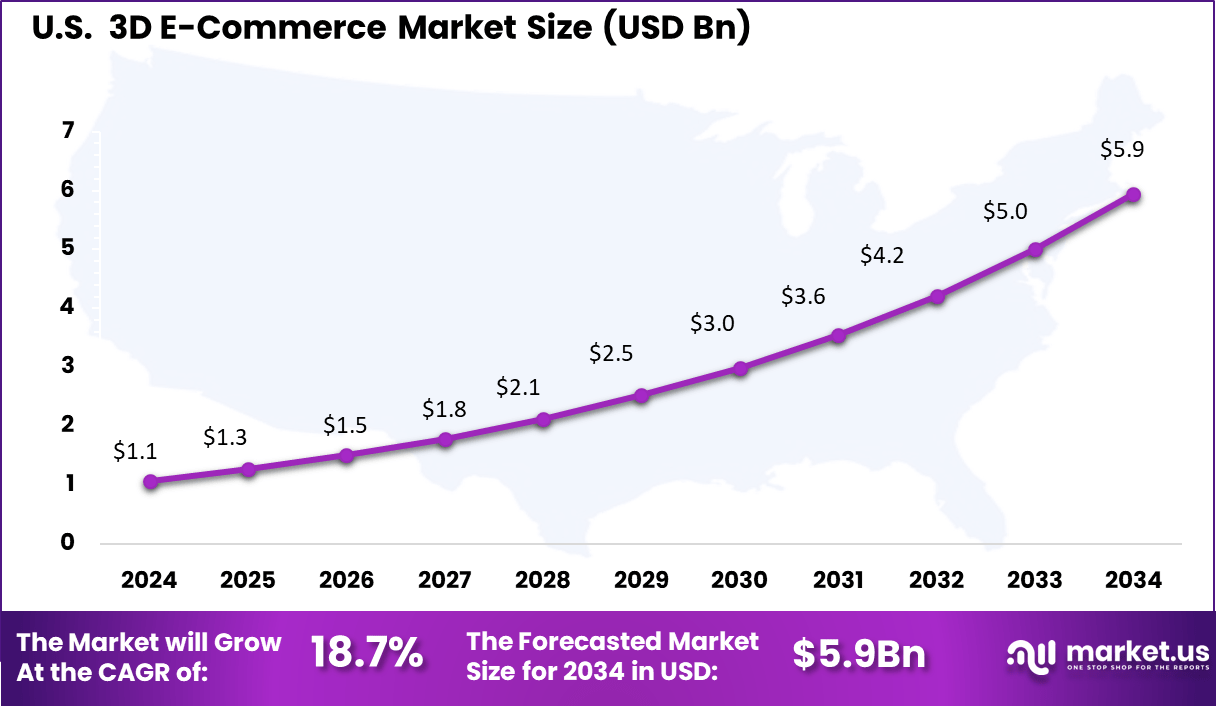
- The US market reached USD 1.07 billion and is growing at a strong CAGR of 18.7%, underscoring its leadership in immersive digital commerce.
Conversion and Sales
Insight Data / Statistics 3D content lifts conversion rates +94% increase; up to +250% with 3D images; +40% with interactive 3D 3D configurators boost buyer confidence 66% of shoppers report higher buying confidence Higher likelihood to buy with 3D 11x more likely to purchase Increased engagement and basket size +66% engagement vs 2D; +9% extra features in automotive Customer Engagement
Insight Data / Statistics High viewership of 3D features 82% of visitors activate 3D view Longer interaction times with 3D 34% interact >30s; average ~20s Preference for interactive 3D over video 95% prefer 3D vs video playback Returns and Satisfaction
Insight Data / Statistics 3D and AR reduce return rates Returns reduced by up to 40% 3D addresses “not as described” issue 27% of returns caused by inaccurate product descriptions US Market Size
The U.S. 3D E-Commerce Market was valued at USD 1.1 Billion in 2024 and is anticipated to reach approximately USD 5.9 Billion by 2034, expanding at a compound annual growth rate (CAGR) of 18.7% during the forecast period from 2025 to 2034.
In 2024, North America held a dominant market position, capturing more than a 38.0% share and generating around USD 1.1 billion in revenue. The region’s leadership is strongly linked to its mature e-commerce infrastructure, high digital purchasing power, and quick adaptation to immersive retail technologies.
Retailers in the United States and Canada have been early adopters of 3D product visualization to reduce return rates and improve online conversion. Strong investments from large fashion, electronics, automotive, and furniture brands have accelerated integration of AR and virtual storefront tools. Wider smartphone use, faster internet, and growing comfort with digital tools have made 3D online shopping easier to adopt.
By Type
In 2024, the 3D Design segment held a dominant position, accounting for 43.2% of the overall market. Its lead is closely linked to retailers adopting realistic product visualization to reduce return rates and improve customer confidence. As shoppers seek clarity before purchasing, lifelike rendering and customization features have become central to online decision-making.
The segment’s growth is also supported by wider compatibility with web and mobile platforms. Retailers and developers increasingly integrate interactive models into virtual storefronts, allowing zoom, rotation, and personalization features that mirror in-store experiences. This usability advantage continues to anchor 3D Design as the preferred format within the market.
By Application
In 2024, the Clothes segment emerged as the top application area, capturing 37.8% of the market. Apparel brands are prioritizing 3D visualization to address long-standing sizing and fit concerns in online shopping. Virtual try-ons and interactive garment previews give buyers a better sense of texture, drape, and fit, which helps reduce dissatisfaction and return volumes.
Consumer adoption of digital fashion tools is also influencing this lead. Younger audiences in particular are more comfortable experimenting with styling features and custom looks through online platforms. This behavior has encouraged clothing retailers to invest in richer visual experiences, keeping the segment ahead of others.
Emerging Trends
One of the strongest trends is the shift from static product images to fully interactive 3D models on retail websites and mobile apps. Customers now expect the ability to rotate products, zoom in on details, and view multiple variants in real time. Retailers are also adding augmented reality try-on tools so buyers can virtually place furniture at home, preview décor, or test footwear and eyewear through smartphones.
Another key trend is the use of product configurators that let shoppers change colors, materials, components, or sizes while viewing accurate 3D visualizations. Brands in furniture, apparel, jewelry, and automotive accessories are adopting this approach to boost personalization. Web-based 3D tools that load without separate apps are becoming more common, making integration smoother for e-commerce platforms.
The integration of 3D content into social commerce is also gaining momentum. Retailers are embedding interactive visuals in ads, product feeds, and influencer campaigns. Advances in scanning technology and photorealistic rendering have made it easier to digitize product catalogs at scale. As competition rises, retailers use high-quality 3D assets to improve engagement and reduce return rates linked to misaligned expectations.
Growth Factors
A core growth factor is the need to lower product returns, especially in categories where appearance, fit, and proportion matter. 3D visualization helps customers gain confidence before purchase, which reduces logistical and financial strain on retailers. The growth of online furniture, fashion, décor, and electronics sales has made visual accuracy more important than before.
Another driver is the rise in smartphone and tablet use with built-in AR capabilities. As device compatibility improves, buyers can access 3D views without special hardware. Retailers also benefit from higher conversion rates when customers spend more time interacting with products in an immersive format.
Customization and personalization are additional growth accelerators. Shoppers increasingly expect the ability to tailor products to their preferences and see realistic previews instantly. Brands using configurators and 3D previews gain higher upselling opportunities and improved customer satisfaction.
Finally, digital-first retail strategies adopted by direct-to-consumer brands and marketplaces support 3D adoption. Competitive pressure, declining in-store traffic, and consumer demand for interactive shopping experiences continue to push retailers toward richer online presentation formats.
Key Market Segments
By Type
- 3D Scanning
- Photogrammetry
- 3D Design
- 3D Rendering
- Others
By Application
- Clothes
- Automobile
- Furniture
- Others
Regional Analysis and Coverage
- North America
- US
- Canada
- Europe
- Germany
- France
- The UK
- Spain
- Italy
- Russia
- Netherlands
- Rest of Europe
- Asia Pacific
- China
- Japan
- South Korea
- India
- Australia
- Singapore
- Thailand
- Vietnam
- Rest of Latin America
- Latin America
- Brazil
- Mexico
- Rest of Latin America
- Middle East & Africa
- South Africa
- Saudi Arabia
- UAE
- Rest of MEA
Driver Analysis
Conversion and return economics are improving when 3D and AR are used at the point of decision. Shopify documented cases with an order conversion uplift of 40% and a returns reduction of 5% after adding AR product views.
Retailers have also reported substantial content-cost efficiencies by replacing some traditional photography with photorealistic 3D, including up to 70% lower asset costs and faster go-to-market. These quantified outcomes are reinforcing budget allocation toward 3D visualization in categories where fit, scale, and finish matter.
Restraint Analysis
The main barrier is the effort needed to prepare high-quality 3D models. Products must be scanned, textured, and optimized with proper file standards and polygon limits. Many retailers do not have in-house teams skilled in 3D production.
Technical readiness is also uneven. Browser support for advanced graphics is improving, but smooth performance still depends on compatible APIs and compressed assets. Companies without experience in rendering or asset workflows often face longer rollout timelines.
Opportunity Analysis
Virtual try-on and product fit visualization offer strong commercial upside. These tools help customers confirm size, proportion, or placement, reducing guesswork and improving buying confidence. This directly helps reduce avoidable returns.
New solutions are also becoming more inclusive. Google’s AI try-on uses different body types and skin tones to show real clothing fit. Digital avatar pilots in fashion and furniture are already reducing return rates, showing room for wider adoption.
Challenge Analysis
Accuracy and trust remain sensitive issues. If 3D models do not reflect correct color, texture, or dimensions, customers lose confidence quickly. Low-quality visualization can damage credibility instead of improving it.
Privacy concerns also arise when scanners capture rooms or body details. Apple’s RoomPlan enables 3D room capture, but users still expect clarity on how their spatial data is processed. Retailers must set standards for consent and transparency to avoid pushback.
Competitive Analysis
The 3D E-Commerce Market is driven by immersive technology leaders such as Magic Leap, Inc., Niantic, and Wikitude (a Qualcomm company). These companies enable augmented reality (AR) and 3D product visualization across retail platforms, enhancing customer engagement and purchase confidence. Their spatial computing and AR SDK solutions support virtual try-ons, product placement previews, and interactive shopping experiences.
Specialized 3D content and visualization providers including Cappasity Inc., VNTANA, 3D Cloud, and Blippar Group Limited focus on creating high-resolution 3D models, product configurators, and AI-based rendering tools. Their technologies help retailers integrate 3D assets into websites, apps, and digital showrooms, improving conversion rates and reducing product returns.
Emerging players such as Zappar Ltd., Myntra Designs Private Limited, FF Poplar Limited, and other market participants offer customized AR/VR shopping solutions, virtual store environments, and mobile-based 3D commerce platforms. Their innovations expand accessibility for fashion, furniture, electronics, and beauty brands, driving the shift from static product pages to immersive digital retail experiences.
Top Key Players in the Market
- Magic Leap, Inc.
- Cappasity Inc.
- Wikitude, a Qualcomm company
- Niantic
- VNTANA
- Myntra Designs Private Limited
- Blippar Group Limited
- Zappar Ltd.
- 3D Cloud
- FF Poplar Limited
- Others
Recent Developments
- Magic Leap, Inc. reported a major funding round in October 2025, securing over $1 billion from Saudi Arabia’s Public Investment Fund. This investment is being directed toward the advancement of its next-generation XR hardware, which supports immersive 3D commerce applications.
- Cappasity Inc. continued strengthening its 3D content platform through customer onboarding and platform promotion in September 2025. No mergers, acquisitions, or notable product launches were publicly disclosed during this period.
Report Scope
Report Features Description Market Value (2024) USD 3.1 Bn Forecast Revenue (2034) USD 21.5 Bn CAGR(2025-2034) 21.3% Base Year for Estimation 2024 Historic Period 2020-2023 Forecast Period 2025-2034 Report Coverage Revenue forecast, AI impact on Market trends, Share Insights, Company ranking, competitive landscape, Recent Developments, Market Dynamics and Emerging Trends Segments Covered By Type (3D Scanning, Photogrammetry, 3D Design, 3D Rendering, Others), By Application (Clothes, Automobile, Furniture, Others) Regional Analysis North America – US, Canada; Europe – Germany, France, The UK, Spain, Italy, Russia, Netherlands, Rest of Europe; Asia Pacific – China, Japan, South Korea, India, New Zealand, Singapore, Thailand, Vietnam, Rest of Latin America; Latin America – Brazil, Mexico, Rest of Latin America; Middle East & Africa – South Africa, Saudi Arabia, UAE, Rest of MEA Competitive Landscape Magic Leap, Inc., Cappasity Inc., Wikitude (a Qualcomm company), Niantic, VNTANA, Myntra Designs Private Limited, Blippar Group Limited, Zappar Ltd., 3D Cloud, FF Poplar Limited, Others Customization Scope Customization for segments, region/country-level will be provided. Moreover, additional customization can be done based on the requirements. Purchase Options We have three license to opt for: Single User License, Multi-User License (Up to 5 Users), Corporate Use License (Unlimited User and Printable PDF) 
-
-
- Magic Leap, Inc.
- Cappasity Inc.
- Wikitude, a Qualcomm company
- Niantic
- VNTANA
- Myntra Designs Private Limited
- Blippar Group Limited
- Zappar Ltd.
- 3D Cloud
- FF Poplar Limited
- Others
Our Clients
- 161959
- Oct. 2025


