
Quick Navigation
Report Overview
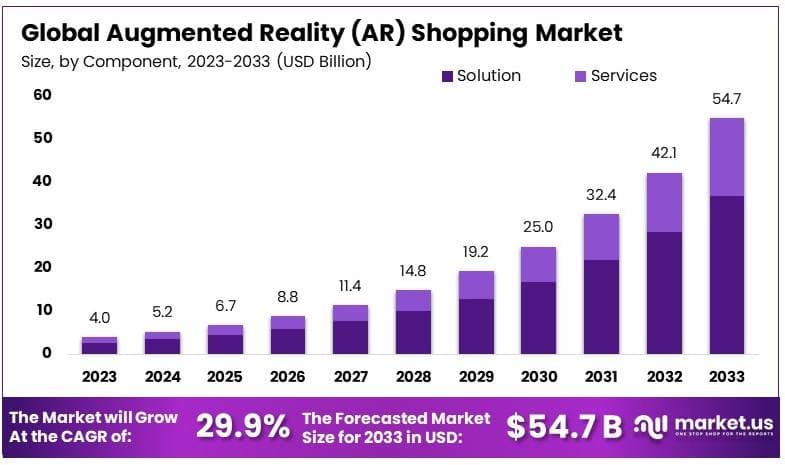
The Global Augmented Reality (AR) Shopping Market size is expected to be worth around USD 54.7 Billion by 2033, from USD 4.0 Billion in 2023, growing at a CAGR of 29.9% during the forecast period from 2024 to 2033.
Augmented Reality (AR) shopping is a way to shop that blends real life and digital content together. This technology lets customers see digital images of products overlaid in the real world through their smartphones or AR glasses. For example, when buying furniture, you can use AR to see how a new sofa might look in your living room before you buy it. AR shopping makes shopping more interactive and helps people make better choices by providing a realistic view of the products in their own space.
The AR shopping market is growing fast as more businesses start to use AR technology to improve the shopping experience. Retailers from fashion to furniture are investing in AR to let customers try products at home before buying. This market is expanding because AR can help online shoppers reduce their doubts, leading to fewer returns and happier customers. As smartphones and AR devices become more common and advanced, the AR shopping market is expected to grow even more, providing new ways for stores to connect with customers.
The demand for Augmented Reality (AR) shopping is increasing rapidly. Customers are seeking more immersive and interactive shopping experiences, especially in the context of online shopping where the ability to visualize products in a real-life setting before purchasing can significantly enhance decision-making. This demand is fueled by the growing availability of AR technology on smartphones and other devices, making it accessible to a wide audience.
Several factors are contributing to the growth of the AR shopping market. Firstly, technological advancements in AR software and hardware are making these experiences smoother and more realistic. Secondly, the rise in e-commerce and online shopping has pushed retailers to find innovative ways to engage consumers and simulate in-store experiences at home.
There is a significant opportunity for AR technology to transform the retail sector by bridging the gap between online and physical shopping. Retailers can use AR to offer personalized shopping experiences and targeted promotions. For example, an AR app can suggest home decor items that match the style of a room, which enhances customer satisfaction and loyalty.
According to Think with Google, 90% of Americans are open to using AR for shopping, and those who have already used it report a 98% satisfaction rate. Furthermore, AR-enabled products are seeing a 94% higher conversion rate than products without AR features, illustrating the potential for businesses to adopt this technology to boost sales.
Based on Intelivita’s findings, over 32% of consumers currently use AR while shopping. By the end of 2023, the number of AR device users is expected to reach around 1.3 billion. Implementing AR in e-commerce can lead to a 30% higher likelihood of purchase, as customers feel more confident in their buying decisions when they can visualize products in their environment.
The effectiveness of AR in driving sales is further supported by Artlabs blog, which reports that retailers using AR experience a 94% higher conversion rate. Additionally, AR technology has a significant impact on reducing product return rates, with studies suggesting a potential decrease of 25% due to improved customer understanding of products before purchase.
Furthermore, 56% of shoppers express that AR enhances their confidence regarding product quality, supporting more risk-free buying decisions through virtual try-ons and product visualizations. By 2025, it is projected that 75% of the global population will frequently use AR, highlighting the rapid and broad adoption of this technology across various demographics.
Key Takeaways
- The Augmented Reality (AR) Shopping Market was valued at USD 4.0 Billion in 2023, and is expected to reach USD 54.7 Billion by 2033, with a CAGR of 29.9%.
- In 2023, Solution dominated the component segment with 67.1% due to its critical role in enhancing user experiences.
- In 2023, Furniture and Home Decor led the application segment with 25.5% driven by rising demand for AR-enabled shopping experiences.
- In 2023, North America dominated the region with 39.4% owing to early adoption of AR technologies and market maturity.
- The global Augmented Reality (AR) Market is projected to reach USD 591.7 billion by 2033, registering a strong CAGR of 39.5% between 2024 and 2033. The market is expected to total USD 29.6 billion in 2024, demonstrating significant growth potential over the forecast period.
- In parallel, the global Mobile Augmented Reality (Mobile AR) Market is anticipated to be worth USD 357.9 billion by 2033, up from USD 22.8 billion in 2023, growing at a CAGR of 31.7% during the same forecast period.
- Augmented reality is reshaping the retail landscape, as evidenced by a new shopping feature that has boosted order conversion rates by 40% while reducing the return rate by 5%. Consumers are becoming more engaged, with 27% more likely to place an order after viewing a product in 3D, and 65% more likely to purchase after interacting with a product through AR.
- Globally, Amazon remains one of the top online shopping marketplaces, following Taobao and Tmall, with a gross merchandise volume (GMV) of USD 390 billion. The active AR user base is substantial, with approximately 1.4 billion devices in use by the end of 2023.
- Awareness of AR is high, especially among younger adults, with 3 in 4 adults under 44 familiar with AR. Moreover, 66% of people express interest in using AR for shopping assistance, and nearly 50% of consumers spend more when using AR-based shopping experiences.
- Looking at the future, 70% of technology leaders expect AR to surpass the Virtual Reality (VR) market in terms of revenue generation. AR product experiences have also proven to be 200% more engaging, delivering double the engagement compared to non-AR equivalents. However, 52% of retailers acknowledge they are not yet prepared to implement AR technologies.
Component Analysis
Solution dominates with 67.1% due to its integral role in enhancing user engagement and streamlining AR experiences.
The “By Component” segment of the Augmented Reality (AR) Shopping Market is pivotal, primarily divided into Solutions and Services. Solutions, as a sub-segment, command a significant majority of the market, holding 67.1% share.
This dominance can be attributed to the critical function solutions play in the AR shopping ecosystem. They include software applications, digital content creation tools, and platforms that enable the creation and deployment of AR experiences. These solutions are fundamental for businesses aiming to integrate AR into their consumer offerings, as they facilitate a more immersive and interactive shopping experience.
The solutions are designed to enhance user engagement by allowing shoppers to visualize products in a real-world context, which is particularly effective in sectors like furniture and home decor, fashion, and beauty. This capability to improve the shopping experience directly impacts consumer satisfaction and sales conversions, making it a valuable asset for retailers and brands.
On the other hand, Services, the other sub-segment, includes support, maintenance, and consultation services related to AR applications. Although smaller in market share, this segment is crucial for the successful implementation and ongoing operation of AR solutions.
Services ensure that AR applications are up-to-date, effectively integrated into existing retail systems, and are running smoothly, thereby enhancing the overall effectiveness of AR shopping solutions.
Application Analysis
Furniture and Home Decor dominates with 25.5% due to its effectiveness in visualizing products in real environments.
The “By Application” segment categorizes the AR Shopping Market into various fields such as Furniture and Home Decor, Fashion and Apparel, Beauty and Cosmetics, Automotive, Grocery, and Other Applications. Among these, Furniture and Home Decor leads with a 25.5% share.
This dominance is primarily due to the high value shoppers place on visualizing furniture and decor in their own spaces before making purchase decisions. AR enables customers to see how a piece of furniture fits in terms of style, size, and color within their existing living spaces, which significantly reduces the uncertainty associated with online purchases and minimizes return rates.
Fashion and Apparel, another significant sub-segment, utilizes AR for virtual try-ons, allowing customers to see how clothes will look on them without physically trying anything on. This not only enhances the customer experience but also aligns with the increasing demand for convenience in shopping. Beauty and Cosmetics have also adopted AR to great effect, with virtual makeup trials accelerating product discovery and purchase cycles.
Automotive and Grocery are emerging segments within AR applications. In automotive, AR can showcase vehicle features and modifications in high detail, enhancing customer interaction during the pre-purchase phase. Meanwhile, in the grocery segment, AR applications are being explored for enhancing in-store navigation and promoting specific products through engaging content.
Other Applications include diverse areas such as books and media, where AR can bring stories and information to life, enhancing educational and engagement outcomes. Each of these applications contributes to the overall market growth by broadening the scope and adoption of AR shopping, providing businesses with innovative ways to meet consumer demands and expectations.

Key Market Segments
By Component
- Solution
- Services
By Application
- Furniture and Home Decor
- Fashion and Apparel
- Beauty and Cosmetics
- Automotive
- Grocery
- Other Applications
Driver
Expanding Retail Innovation and Consumer Trust Drive Market Growth
Retail innovation is a major driver of the Augmented Reality (AR) shopping market. Retailers are constantly seeking new ways to differentiate themselves and attract customers. AR offers a unique opportunity for businesses to create immersive shopping experiences that stand out in a crowded marketplace.
Another driving factor is the growing consumer trust in digital shopping solutions. As more consumers become comfortable with technology, they are increasingly willing to try AR-enabled shopping tools. This trust in digital transformation is helping fuel the rapid adoption of AR in the retail sector.
Increased investment from tech companies is also a key factor. As AR technology evolves, major players in the tech industry are investing in developing more advanced AR applications for retail, making the technology more accessible and scalable. This influx of investment is accelerating innovation in AR solutions and driving market growth.
Environmental sustainability trends are driving AR adoption. AR enables consumers to try on products virtually, reducing the need for physical samples and returns, which can lower the environmental impact of online shopping.
Restraint
Limited Device Compatibility and Bandwidth Constraints Restrain Market Growth
Limited device compatibility is a significant restraint on the Augmented Reality (AR) shopping market. Not all smartphones and devices are equipped with AR capabilities, limiting the potential user base. Many consumers with older devices may not be able to access AR shopping features, which hinders the technology’s widespread adoption.
Bandwidth constraints, particularly in regions with slower internet connections, also restrain the market. AR applications require high-speed internet to function smoothly, and in areas where internet infrastructure is underdeveloped, users may experience lag or poor performance. This limits the reach of AR shopping platforms in certain markets.
A lack of standardization across AR platforms creates another barrier. Different AR technologies and applications may not work seamlessly with one another, creating fragmented experiences for users. This lack of consistency can lead to consumer frustration and reduce the likelihood of repeat engagement with AR shopping tools.
Opportunity
Shifting Retail Models and 5G Connectivity Provide Opportunities for Growth
As traditional brick-and-mortar stores evolve into virtual showrooms, AR technology can provide a more engaging and interactive shopping experience. Retailers can leverage AR to offer virtual product try-ons or 3D product visualizations, providing a virtual in-store experience from home.
The increasing rollout of 5G connectivity also offers opportunities for AR shopping growth. With faster data speeds and lower latency, 5G services enhances the performance of AR applications, enabling smoother, more responsive user experiences. This improved connectivity will make AR tools more appealing and accessible to a wider range of consumers.
Another opportunity arises from the global expansion of digital payments. As more consumers worldwide embrace digital wallets and contactless payments, the integration of AR with these platforms offers a seamless shopping journey.
Additionally, the growth of virtual influencers presents another opportunity. Brands are increasingly collaborating with virtual influencers, who can showcase products through AR-powered virtual try-ons.
Challenge
User Experience and Limited Content Challenges Market Growth
A major challenge to the growth of the Augmented Reality (AR) shopping market is the need for a seamless user experience. Many AR shopping applications still suffer from glitches or a lack of intuitive design, which can frustrate users and reduce engagement.
Another challenge is the limited availability of AR content. While AR shopping tools are expanding, there are still relatively few retailers offering comprehensive AR experiences. This lack of content limits the appeal of AR shopping and slows its adoption, as consumers have fewer opportunities to engage with the technology across their favorite brands.
Retailers also face challenges in creating high-quality AR content. Producing detailed 3D models or virtual try-on experiences can be time-consuming and expensive. Smaller businesses may struggle to allocate the necessary resources to develop compelling AR content, creating an imbalance in AR adoption between large and small retailers.
Growth Factors
AI-Powered Personalization and Sustainability Are Growth Factors Driving Market Expansion
AI-powered personalization is a key growth factor in the Augmented Reality (AR) shopping market. By integrating AI with AR, retailers can offer highly personalized shopping experiences, such as recommending products based on previous purchases or preferences. This level of customization enhances the shopping experience, making it more likely for consumers to engage with AR tools and complete purchases.
Another significant growth factor is the rising focus on sustainability in retail. AR allows customers to visualize products virtually, reducing the need for physical samples or in-store trials, which leads to fewer returns.
The adoption of AR in industries beyond fashion and beauty also contributes to market growth. Sectors such as furniture, automotive, and home improvement are beginning to use AR to offer virtual product demonstrations, expanding the market for AR shopping beyond traditional retail categories.
Emerging Trends
Virtual Events and Remote Shopping Are Latest Trending Factors Shaping Market Growth
Virtual events are one of the most recent trends shaping the Augmented Reality (AR) shopping market. Retailers and brands are increasingly hosting virtual product launches, fashion shows, and exclusive shopping events using AR.
Remote shopping trends, especially following the global shift toward online retail due to the pandemic, are also fueling AR adoption. Consumers are seeking ways to experience products from the comfort of their homes, and AR tools provide a solution.
Additionally, augmented virtual try-on technology for accessories like eyewear, jewelry, and cosmetics is becoming increasingly popular. This trend allows consumers to interact with smaller, highly personalized products in real time, improving decision-making and enhancing customer satisfaction.
AR-enabled pop-up stores are emerging as a trendy concept. Brands are creating temporary digital stores where consumers can explore products virtually, offering a unique blend of exclusivity and convenience. This trend is especially popular for limited-edition releases, driving excitement and engagement around new product launches.
Regional Analysis
North America Dominates with 39.4% Market Share
North America leads the Augmented Reality (AR) Shopping Market with a 39.4% market share, valued at USD 1.58 billion. This leadership is driven by widespread e-commerce adoption, a tech-savvy consumer base, and the presence of key AR technology providers. The U.S. and Canada are at the forefront, with major retailers utilizing AR to enhance the online shopping experience.
North America’s advanced digital infrastructure and high internet penetration contribute significantly to its dominance. The region also benefits from heavy investments in AR technology, particularly in retail sectors like fashion, beauty, and home decor, where AR-powered virtual try-ons and product visualization tools are becoming the norm.
North America’s dominance in the AR shopping market is expected to grow. The integration of AI and AR, along with the expansion of 5G networks, will create more immersive shopping experiences, further solidifying the region’s leadership. As consumers continue to embrace online shopping, North America’s market share is likely to increase.

Regional Mentions:
- Europe: Europe holds a strong position in the AR shopping market, driven by a focus on sustainable shopping and data privacy. Retailers are increasingly adopting AR to provide personalized shopping experiences.
- Asia Pacific: Asia Pacific is expanding rapidly due to growing smartphone usage and e-commerce growth. Countries like China and Japan are leading the AR shopping revolution with innovative solutions.
- Middle East & Africa: The region is emerging in AR adoption, driven by investments in smart city projects and improving digital infrastructure, particularly in retail sectors.
- Latin America: Latin America is gradually embracing AR shopping technologies, particularly in fashion and home decor sectors, as it continues to push for digital transformation in retail.
Key Regions and Countries covered іn thе rероrt
- North America
- US
- Canada
- Europe
- Germany
- France
- The UK
- Spain
- Italy
- Rest of Europe
- Asia Pacific
- China
- Japan
- South Korea
- India
- Australia
- Rest of APAC
- Latin America
- Brazil
- Mexico
- Rest of Latin America
- Middle East & Africa
- South Africa
- Saudi Arabia
- UAE
- Rest of MEA
Key Players Analysis
In the Augmented Reality (AR) Shopping Market, three key players – Google LLC, Apple Inc., and Amazon.com, Inc. – lead the industry with significant impact, strategic positioning, and market influence.
Google LLC stands out with its advanced AR technology, notably through its ARCore platform, which allows retailers to integrate AR experiences into their apps and websites. Its strong presence in the mobile ecosystem gives Google a competitive edge in scaling AR solutions, offering a broad reach across devices.
Apple Inc. is a major player, leveraging its ARKit framework, which powers AR experiences across its range of devices. With the seamless integration of hardware and software, Apple delivers high-quality AR capabilities, particularly in its iPhone and iPad product lines. This positions Apple at the forefront of AR adoption, especially in consumer-facing sectors like retail.
Amazon.com, Inc. is capitalizing on AR in e-commerce, with its “Amazon AR View” feature allowing customers to visualize products in their own environments before purchasing. As the world’s largest online retailer, Amazon has a unique advantage in pushing AR adoption for online shopping. Its focus on enhancing customer experience through AR has helped differentiate its services from competitors.
These companies are shaping the future of AR shopping by driving innovation, enhancing user experiences, and providing scalable solutions that are influencing other businesses and technology providers to follow suit. Their strong market influence is expected to continue as AR shopping technology evolves and becomes more mainstream.
Top Key Players in the Market
- Google LLC
- Apple Inc.
- Amazon.com, Inc.
- Blippar Group Limited
- PTC Inc.
- Zugara, Inc.
- ScienceSoft USA Corporation
- Metadome.ai
- Textronics
- Perfect Corp.
- Other Key Players
Recent Developments
- ResponsiveAds and DeepAR: On October 2023, ResponsiveAds and DeepAR launched augmented reality (AR) shopping ads in time for Halloween. The collaboration introduced new Face AR and Body AR Virtual Try-On (VTO) templates in ResponsiveAds’ Creative Marketplace, aimed at improving the virtual shopping experience for apparel, beauty, and luxury items.
- Walmart: On January 2024, Walmart announced the launch of its Optical Virtual Try-On feature, which allows customers to virtually try on eyewear. This feature utilizes advanced 3D data and algorithms to offer a highly realistic experience.
- Coach and Zero10: On December 2023, Coach partnered with augmented reality tech company Zero10 to introduce AR Storefront technology in five stores across North America. Shoppers can virtually try on items from Coach’s holiday collection using AR, providing an interactive and festive shopping experience enhanced by special effects such as animated snowmen and ribbons.
Report Scope
| Report Features | Description |
|---|---|
| Market Value (2023) | USD 4.0 Billion |
| Forecast Revenue (2033) | USD 54.7 Billion |
| CAGR (2024-2033) | 29.9% |
| Base Year for Estimation | 2023 |
| Historic Period | 2018-2023 |
| Forecast Period | 2024-2033 |
| Report Coverage | Revenue Forecast, Market Dynamics, Competitive Landscape, Recent Developments |
| Segments Covered | By Component (Solution, Services), By Application (Furniture and Home Decor, Fashion and Apparel, Beauty and Cosmetics, Automotive, Grocery, Other Applications) |
| Regional Analysis | North America – US, Canada; Europe – Germany, France, The UK, Spain, Italy, Rest of Europe; Asia Pacific – China, Japan, South Korea, India, Australia, Singapore, Rest of APAC; Latin America – Brazil, Mexico, Rest of Latin America; Middle East & Africa – South Africa, Saudi Arabia, UAE, Rest of MEA |
| Competitive Landscape | Google LLC, Apple Inc., Amazon.com, Inc., Blippar Group Limited, PTC Inc., Zugara, Inc., ScienceSoft USA Corporation, Metadome.ai, Textronics, Perfect Corp., Other Key Players |
| Customization Scope | Customization for segments, region/country-level will be provided. Moreover, additional customization can be done based on the requirements. |
| Purchase Options | We have three licenses to opt for: Single User License, Multi-User License (Up to 5 Users), Corporate Use License (Unlimited User and Printable PDF) |
 Shopping Market")


