Introduction
Google Statistics: Google is the dominant search engine, processing an estimated 8.5 billion searches daily and holding a global market share of over 92%. Key statistics include its high mobile search volume, significant influence on e-commerce, and the continuous introduction of new, unique queries each day. Google also generates billions in annual revenue, primarily from Google Ads, and has expanded its services beyond search, such as its widely used Chrome browser and Cloud services.
For over 20 years, Google stood as an unrivalled online titan, providing access to a wealth of knowledge with just a few keystrokes. The California-based multinational is the global leader in the online search market, offering services for online advertising and digital products, cloud computing, and software. However, the corporation is currently facing the most significant challenges in its operations as it attempts to adapt to the emerging trends in artificial intelligence (AI) in online search. This shift is transforming the online search industry and, for the first time, threatening its global dominance.
Editor’s Choice
- Google was officially established in 1998 by Larry Page and Sergey Brin to promote Google Search, which has evolved into the most widely used web-based search engine.
- Google commands 91.5% of the global search engine market share.
- Google processes approximately 99,000 search queries per second, resulting in around 8.5 billion searches daily.
- 44% of searches conducted on Google pertain to branded terms, indicating that generic, non-branded searches remain more prevalent.
- The typical duration of a Google search session is 76 seconds, with 25% of sessions concluding in less than 31 seconds.
- 63% of individuals have clicked on a Google Ad at some point during their lifetime while viewing the Google search results page.
- 52% of the sources cited in AI Overviews rank within the top 10 organic results, with the majority positioned at #5.
- 6% of consumers indicate they are likely to review ratings on Google before visiting a business location.
- Since 2022, Google Lens has processed 1 billion visual searches each month.
Historical Facts
- Google was officially established in 1998 by Larry Page and Sergey Brin to promote Google Search, which has evolved into the most widely used web-based search engine.
- The company introduced Google News in 2002, Gmail in 2004, Google Maps in 2005, Google Chrome in 2008, and the social networking platform known as Google+ in 2011, alongside numerous other products.
- In 2005, the company created a charitable branch, Google.org. By 2015, Google had become the primary subsidiary of the parent company Alphabet Inc.
- The term Google is a misspelling of Googol, which represents the number 1 followed by 100 zeros, chosen to indicate that the search engine aimed to deliver vast amounts of information.
- Google traces its roots back to “BackRub,” a research initiative initiated in 1996 by Larry Page and Sergey Brin while they were both pursuing their PhDs at Stanford University in Stanford, California.
- The domain google.com was registered on September 15, 1997. The founders formalized their company, Google, on September 4, 1998, in the garage of their friend Susan Wojcicki in Menlo Park, California.
- By the conclusion of 1998, Google had indexed approximately 60 million pages.
Further
- In early 1999, Brin and Page contemplated selling Google to Excite.
- In 2000, Google commenced selling advertisements linked to search keywords.
- In February 2003, Google acquired Pyra Labs, the owner of the Blogger platform.
- In February 2004, Yahoo! ended its partnership with Google, opting to provide its own independent search engine.
- On August 19, 2004, the total number of shares outstanding was 172.85 million, while the “free float” stood at 19.60 million.
- In June 2005, Google was valued at nearly $52 billion, positioning it among the largest media companies globally by stock market valuation.
- In 2008, Google launched Knol, its own version of Wikipedia, which ultimately failed four years later.
- As of November 2014, Google operated more than 70 offices across over 41 countries.
- On March 19, 2019, Google declared its intention to enter the video game industry, unveiling a cloud gaming platform named Google Stadia.
General Google Statistics and Facts
- Google commands 91.5% of the global search engine market share.
- Google experiences a search query volume of 10.3 million.
- Every minute, Google registers 5.9 million searches.
- In November 2023 alone, Google attracted 83.8 billion visitors.
- On average, visitors to Google spend 10 minutes on the site.
- Typically, Google visitors view 8.7 pages during their session.
- The average bounce rate for Google pages stands at 28.1%.
- The United States is the country that utilizes Google the most.
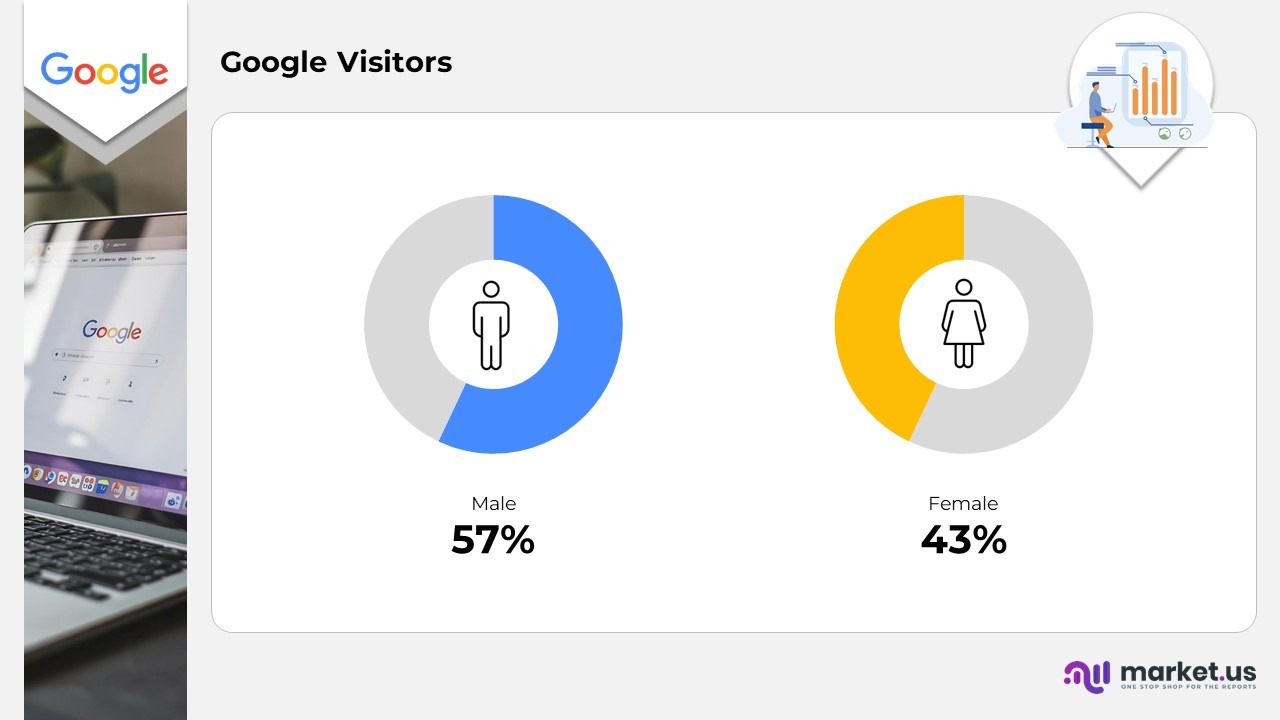
- 57% of Google visitors are male.
- A recent study indicated that 148 query terms accounted for nearly 15% of the total search volume on Google.
- The most prevalent age group using Google is individuals aged 25 to 34.
- As of 2024, Google continues to hold the largest market share among all search engines.
- 15% of daily searches on Google are unique and have never been searched before.
Moreover
- In 2022, Google platforms, including Google Search and YouTube, generated $191 billion in advertising revenue.
- 49% of individuals turn to Google first when seeking answers.
- 79% of people access Google daily, whether to visit a specific site, browse casually, or pose a question.
- 75% of users focus solely on the first page of Google search results.
- Organic search significantly aids users, as search engines assist 51% of users in discovering new companies and products.
- Google processes approximately 99,000 search queries per second, resulting in around 8.5 billion searches daily.
- Approximately 19% of Google search engine results pages (SERPs) display images.
- From May 2023 to May 2024, Google experienced a 1.4% increase in desktop visits.
- As of 2024, Americans using desktop computers conduct an average of 126 unique Google searches each month.
- It is estimated that Google delivers roughly 492 billion search results monthly, highlighting the platform’s dominance.
- Google claims to provide over 5 trillion search results to users annually.
- In 2024, nearly 87% of searches on Google utilized the default search option, with about 10% using Google Images, and the remaining percentages utilizing Video, Maps, News, and Shopping.
Google Search Statistics
- 44% of searches conducted on Google pertain to branded terms, indicating that generic, non-branded searches remain more prevalent.
- A study conducted in September 2024 revealed that more than half (52%) of searches on Google are aimed at acquiring information, as opposed to commercial, transactional, or navigational purposes.
- Interestingly, the most frequently searched topics on Google include movies, TV shows, actors, and music.
- As of July 2024, the Google search term “translate” garnered 32.5 million searches.
- Other highly sought-after searches on Google include “Wordle,” “Gmail,” and “Weather.”
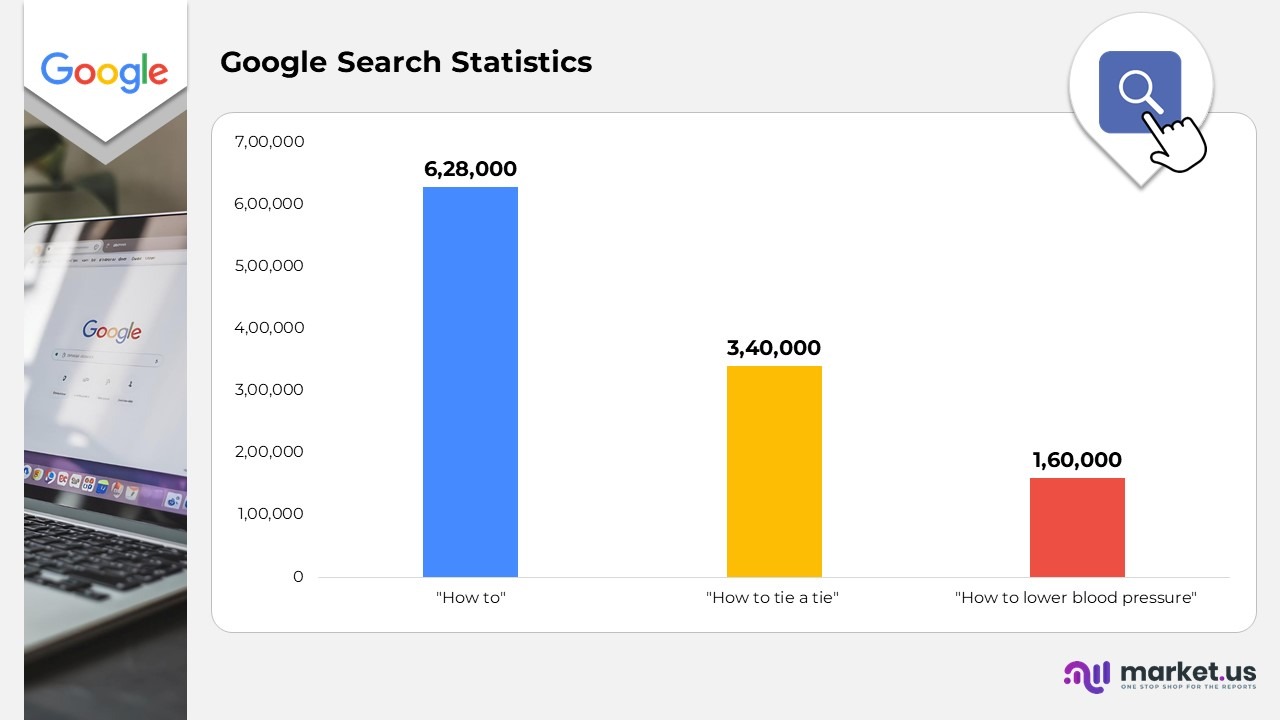
- The phrase “How to” was queried 628,000 times on Google.
- Specifically, the search “How to tie a tie” was entered 340,000 times.
- Health-related inquiries are also prevalent, with the search “How to lower blood pressure” receiving 160,000 searches.
Moreover
- 44% of searches on Google are for branded terms, indicating that generic, non-branded searches are still more common.
- The leading digital platforms searched in the U.S. include “Facebook,” “Amazon,” and “YouTube.”
- Over 14% of the top 100 searches on Google are related to sports.
- As of July 2024, Taylor Swift was the most searched individual on Google, with a monthly search volume of 9.14 million.
- Interestingly, the most searched topics on Google encompass movies, TV shows, actors, and music.
- In 2024, websites that ranked in the top four positions for information-based queries (focusing on terms such as when, what, where, how, and others) experienced a total decline of 7.31% in their CTR for desktop.
- Commercial searches did not exhibit significant changes in 2024 for websites in the first position, but there was a 1.06% decrease in CTR for websites in the second position on desktop.
Google User Behavior & CTR Statistics
- The typical duration of a Google search session is 76 seconds, with 25% of sessions concluding in less than 31 seconds.
- Among 1.05 million queries, 58% consisted of a single term.
- On average, users most commonly search using 3 to 4 words.
- Nevertheless, longer queries comprising 10 to 15 words receive 1.76 times more clicks compared to single-word searches.
- Following a search, 45.5% of users will determine their next steps within 0 to 5 seconds.
- 15% of users ultimately modify their original search query.
- Fewer than 1% of searches will navigate to the second page of Google results.
- In comparison to the leading paid search result, users are 19 times more likely to click on the top organic search results.
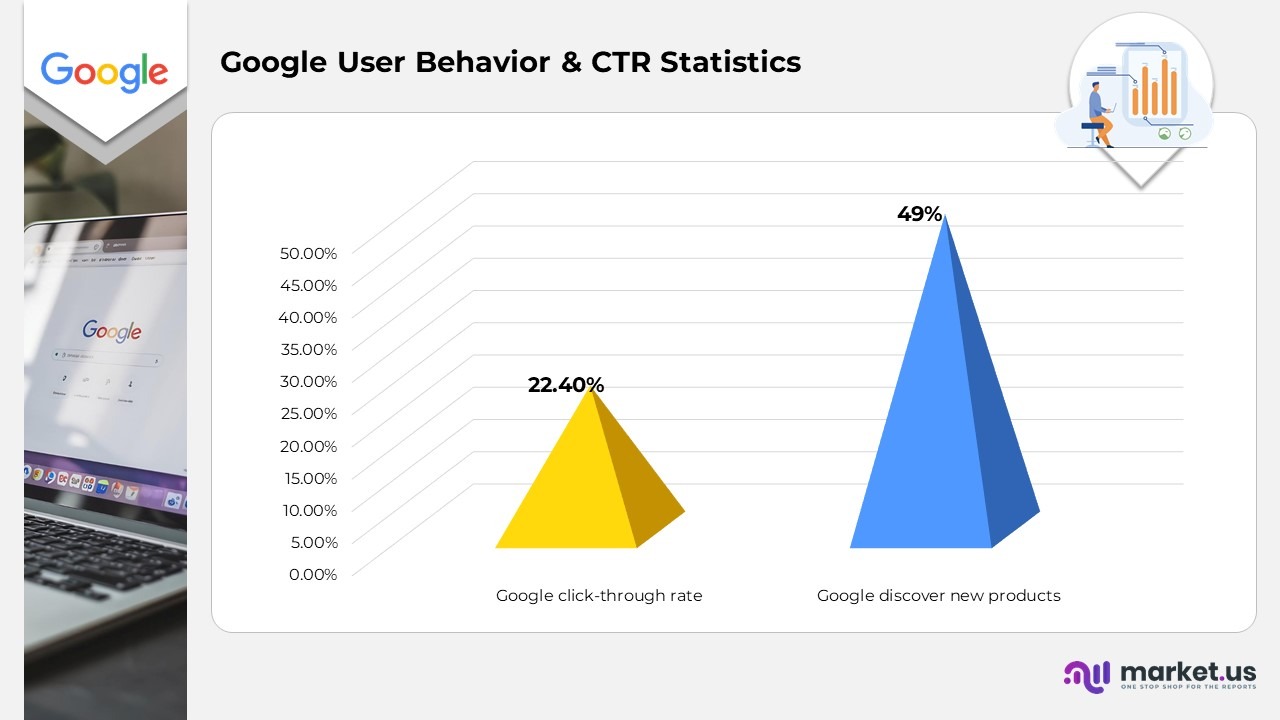
- 49% of searchers will use Google to discover new products.
- 46% of Google searches conducted by users are influenced by a local context.
- The highest-ranking organic search results on Google achieve a click-through rate of 22.4%.
- 65% of SEO marketers reported that Google’s 2023 algorithm update positively impacted their web traffic and SERP rankings.
Moreover
- Webpages with the highest number of backlinks are likely to achieve superior rankings on Google.
- Half of the websites that obtain at least one backlink do not reach the first page of Google’s search results.
- A click-through rate exceeding 3% is regarded as favorable for SEO performance.
- Content that is longer is ranked 3.5 times higher on Google than shorter content.
- On average, the keywords used by the top 10% of performing sites consist of 3.2 to 3.5 words.
- 41% of domains that secured a position in the top 10 remained there for a duration of 6 months.
- A study conducted in September 2024 revealed that more than half (52%) of searches on Google are performed with the intention of acquiring information, as opposed to commercial, transactional, or navigational purposes.
- 3% of queries in Google Search Console receive 10 impressions or fewer, underscoring the prevalence of low-volume, long-tail keywords.
- 23% of searchers utilize Google’s autocomplete suggestions to refine their search queries.
- 19% of searches related to products lead to a click on Google Shopping.
- Only 3% of users engage with a People Also Ask (PAA) box; however, this figure increases to 13.6% when the search intent is related to purchases.
- Half of Google users click within 9 seconds of starting a search; the average time taken to click is 14.6 seconds.
Google Mobile Search Statistics
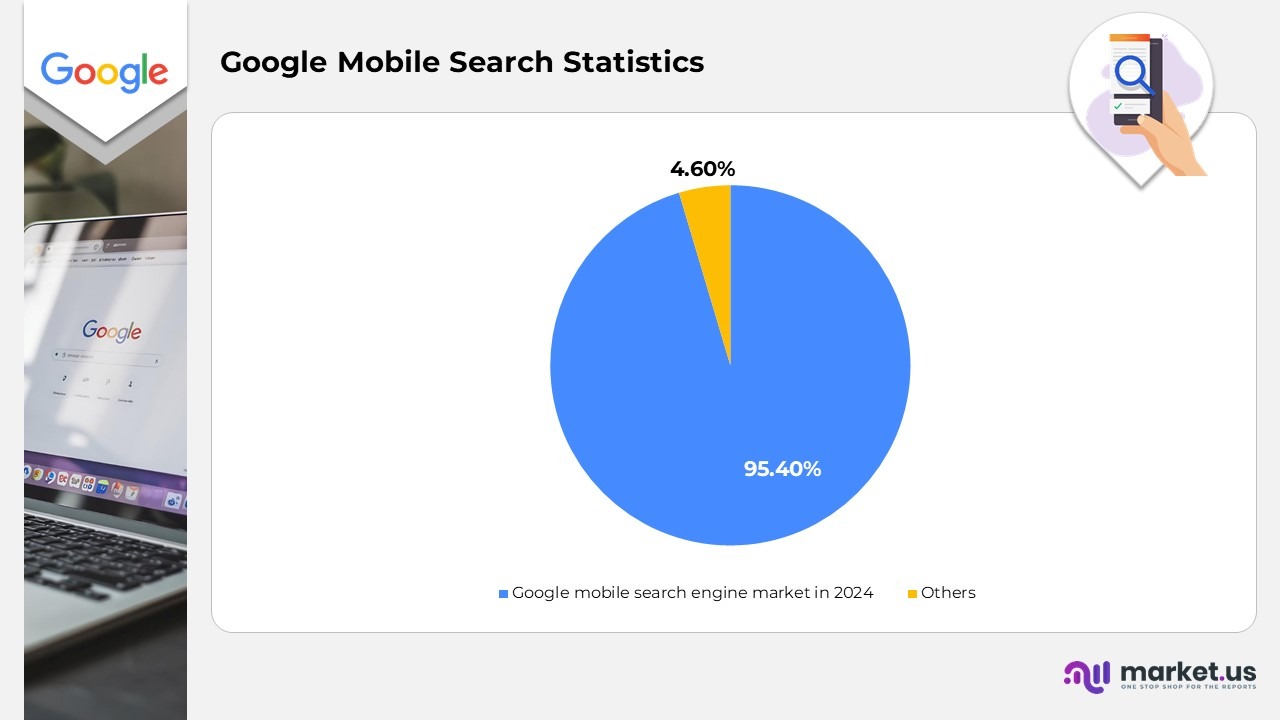
- In January 2024, Google held a 95.4% share of the mobile search engine market.
- The average click-through rate (CTR) for mobile searches in the United States exceeds 50%.
- Mobile users typically take longer than desktop users to decide on their next action following a search.
- Only 17% of websites manage to maintain their rankings across both web and mobile formats.
- In 2022, 59% of Google search traffic originated from mobile searchers.
- Images are shown to appear 12.5 times more frequently in mobile search results.
- Videos in organic search results are displayed three times more often on mobile devices.
- 17% of mobile users will conclude their search without clicking on any results.
- 60% of mobile users will reach out to a business directly from the search results page.
- Mobile advertisements are reported to be five times more effective for businesses compared to online ads.
- By the end of 2024, websites that ranked first on mobile for short queries (one word) experienced a 1.94% increase in their CTR.
Ads Statistics by Google
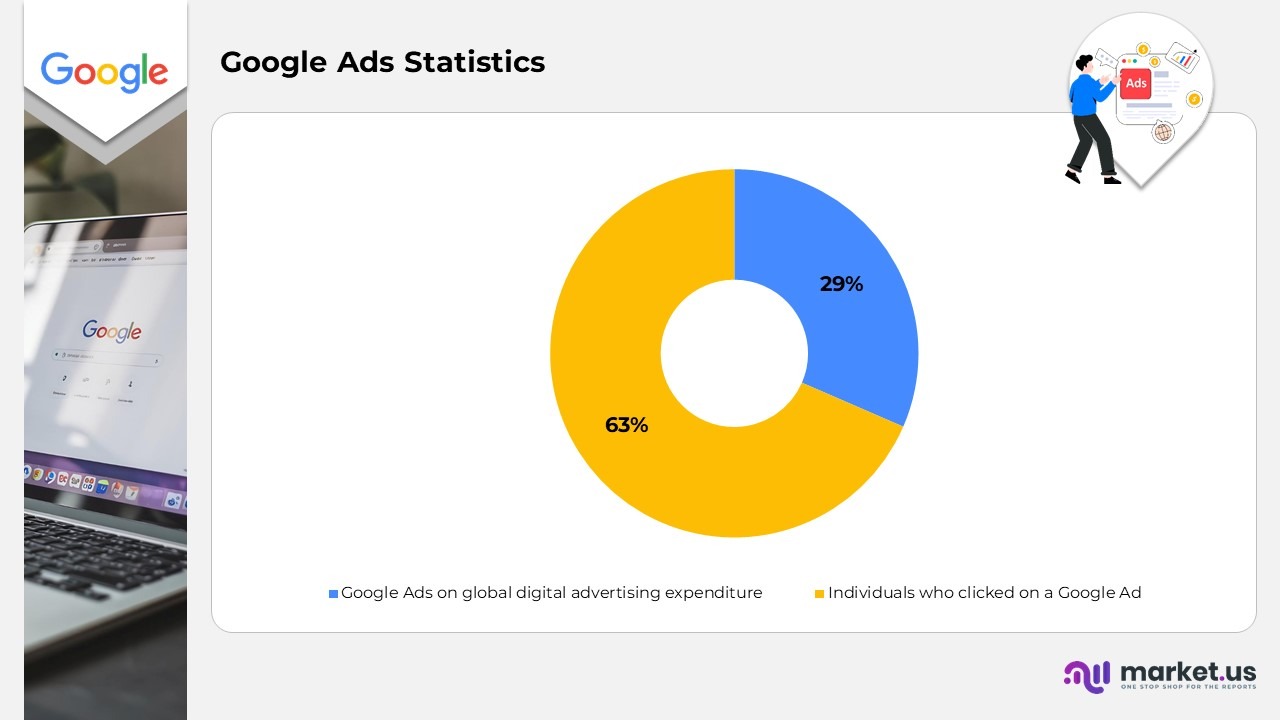
- 63% of individuals have clicked on a Google Ad at some point during their lifetime while viewing the Google search results page.
- Google Ads accounts for 29% of the global digital advertising expenditure.
- In 2019, Google Ads commanded a 73.1% share of the paid search market.
- 80% of companies are expected to use the Google Ads platform for their pay-per-click (PPC) campaigns.
- In the fourth quarter of 2022, Google Ads generated $59 billion in revenue.
- Google recommends a daily advertising budget of $10 to $50 for newcomers to the advertising landscape.
- Four out of five consumers prefer Google Ads that are pertinent to their geographical location.
- As of 2023, the average cost-per-click for Google Ads was $4.22.
- The average conversion rate for Google Ads from 2022 to 2023 was recorded at 7.04%.
- For every dollar invested in Google Search Ads, users can anticipate an average return on investment (ROI) of $8.
Google AI Statistics
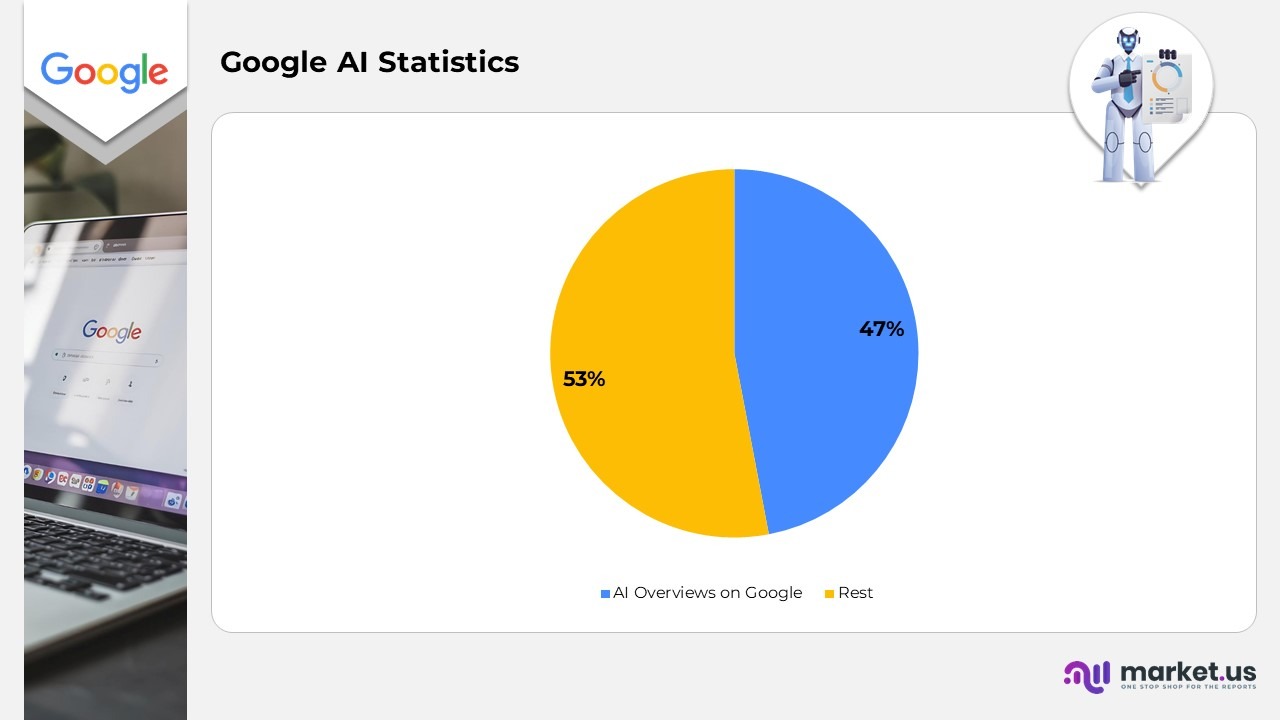
- 47% of search queries activate AI Overviews (AIOs) on Google.
- 51% of desktop SERPs feature both advertisements and AI Overviews.
- AI Overviews are concise summaries produced by Google’s AI, averaging 157 words or 984 characters per response.
- 90% of AI Overviews reference 8 or fewer sources, with less than 1% containing no sources at all.
- 99% of AI Overviews consist of fewer than 328 words, crafted for quick and easily digestible information.
- 52% of the sources cited in AI Overviews rank within the top 10 organic results, with the majority positioned at #5.
- AIO responses vary from 5 to 488 words, with an average of 119 words on desktop and 91 on mobile.
- 82% of desktop and 76% of mobile AI Overviews are displayed for keywords that receive fewer than 1,000 monthly searches.
- Informational keywords are predominant, while transactional keywords account for less than 3% and navigational keywords for under 2%.
- 35% of desktop and 32% of mobile keywords that trigger AIOs are phrased as questions.
- Keywords that begin with “how,” “what,” and “is” are the most frequently seen in AIOs.
- 21% of AIOs are formatted in short paragraphs.
Moreover
- AIOs emphasize well-organized, informative content rather than keyword-heavy material.
- AIOs incorporate the exact query 5.4% of the time, highlighting natural language usage over strict keyword matching.
- 99% of the sources in AI Overviews are cited only once.
- Domains appearing in traditional top-10 SERPs experience higher average traffic 69% of the time compared to those referenced in AIOs.
- The leading organic ranking URL is found in 46% of desktop AIOs and 34% of mobile AIOs.
- More than 50% of desktop and 60% of mobile AIOs do not feature the top organic result.
- Websites that are not in the top 10 SERPs can still achieve visibility through AI Overviews.
- Niches with the highest number of AIOs include Relationships (46.14%), Food and Beverage (33.46%), and Business (23.40%).
- Niches where both AIOs and ads exceed 60% include Pets, Healthcare, and Beauty and Fashion.
- The representation of e-commerce in AIOs is minimal, with only 0.3% including e-commerce sources.
- AIOs for queries such as “glasses in the sun” featured product cards followed by shopping advertisements.
Google Maps and My Business Statistics
- 42% of users searching for local queries engage with results in the Google Map Pack.
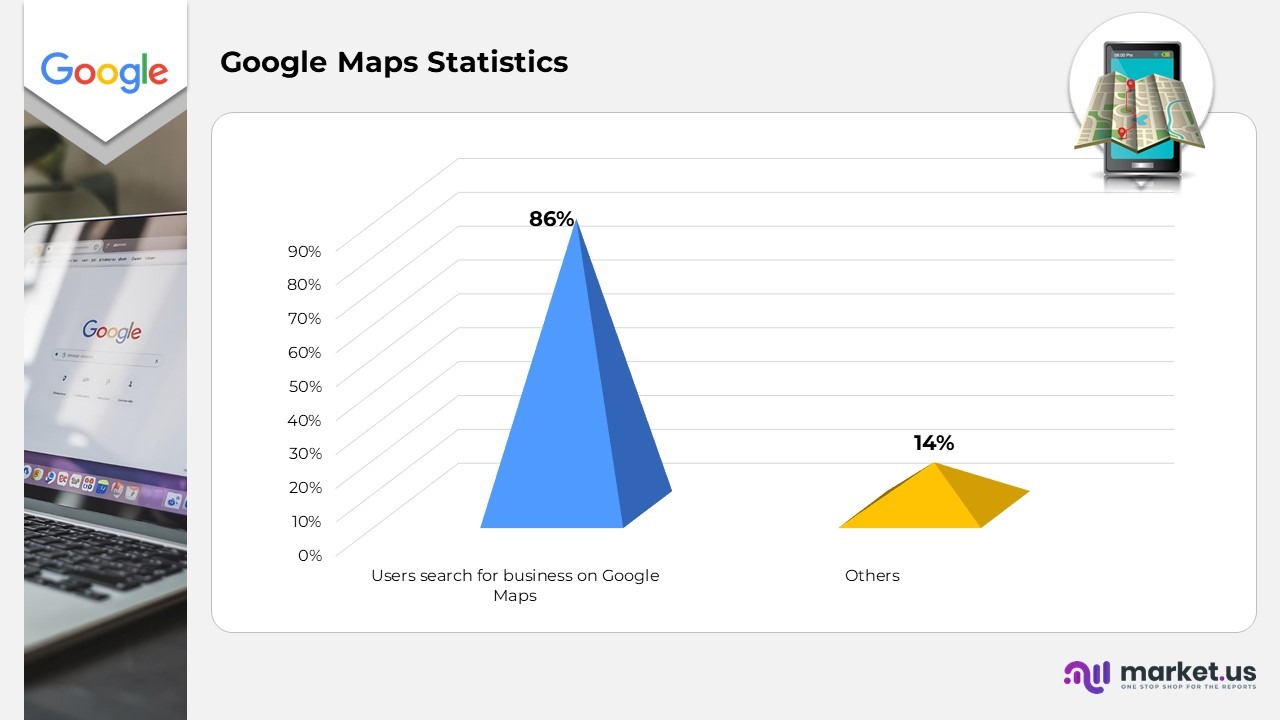
- 86% of individuals directly search for a business location on Google Maps.
- 46% of Google search queries exhibit local search intent.
- 58% of businesses fail to optimize for local search.
- Customers are 2.7 times more likely to perceive your business as ‘reputable’ if they encounter a complete Business Profile while browsing search results and Google Maps.
- 6% of consumers indicate they are likely to review ratings on Google before visiting a business location.
- Google Business Profile posts that include titles garnered nearly double the clicks and twice the conversions compared to those without titles.
- Posts on Google Business Profiles featuring non-all-caps titles attracted almost twice the clicks in comparison to posts with all-caps titles.
- Google Business Profile posts that incorporate emojis received twice as many clicks and higher conversion rates than those that did not include emojis.
- Posts on Google Business Profile with images containing text achieved nearly four times more clicks than images lacking text.
Moreover
- Google Business Profile posts featuring logos did not demonstrate a significant difference in performance relative to posts without logos.
- Posts on Google Business Profile that utilized non-stock photos received 5.6 times more clicks than those that used stock photos.
- Google Business Profile posts that included calls-to-action averaged 2.71 clicks per post.
- Google Business Profile posts that conveyed a sense of urgency averaged 2.68 clicks per post.
- Google Business Profile posts stating ‘We are open’ averaged 1.93 clicks per post.
- Google Business Profile posts highlighting awards or unique selling propositions averaged 1.36 clicks per post.
- Google Business Profile posts that posed questions averaged 1.23 clicks per post.
- Google Business Profile posts discussing products or services averaged 1.04 clicks per post.
- Google Business Profile posts about ‘who we are’ averaged 1.03 clicks per post.
- Seasonal posts on Google Business Profiles averaged 0.75 clicks per post.
Audio Google Search Statistics
- According to projections, by the end of 2024, half of all searches performed on Google will be conducted via voice.
- Google records over 1 billion voice searches monthly across all devices compatible with Google Assistant.
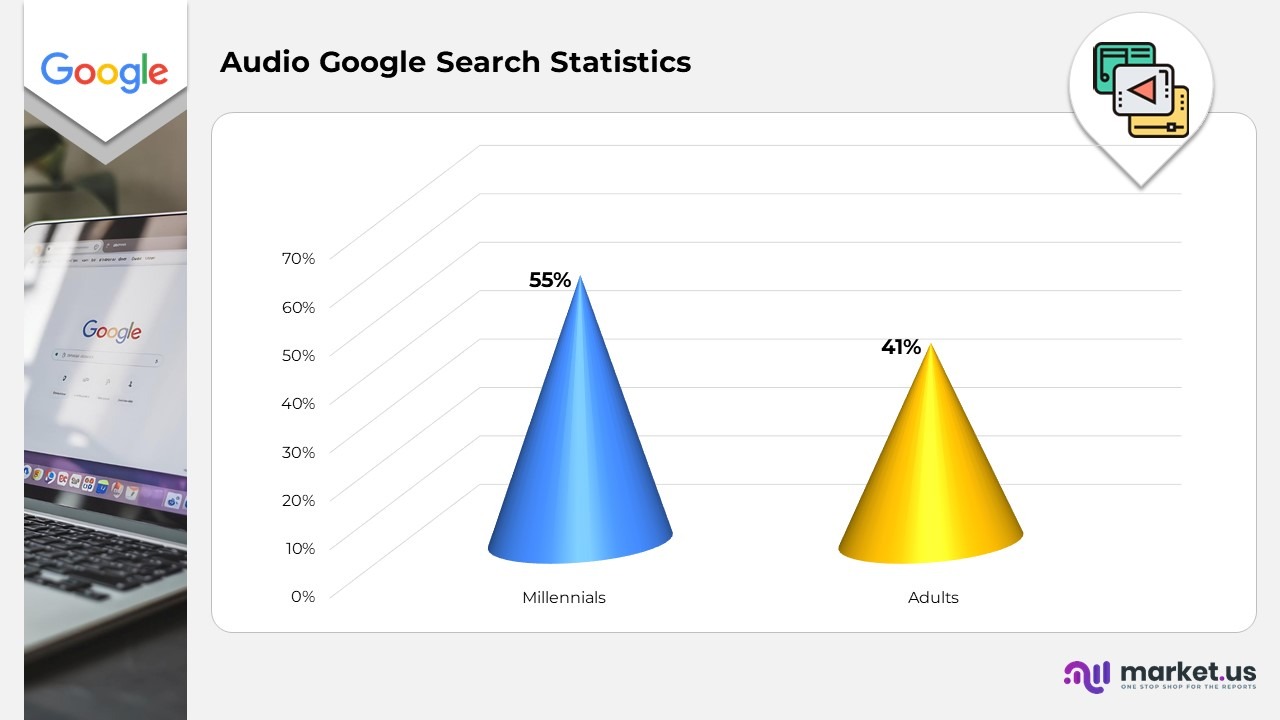
- Each day, 41% of adults and 55% of millennials make use of Google Voice Search.
- Approximately 58% of Google users have utilized voice search to find local businesses, thereby strengthening the connection between local intent and voice search.
- 40% of adults turn to voice search for purchasing or acquiring product information.
- A notable 65% of voice searches are phrased as questions, with the most frequently used interrogative words being “who,” “what,” “where,” “when,” and “how.”
Visual Google Search Statistics
- Since 2022, Google Lens has processed 1 billion visual searches each month.
- Google Image Search handles over 3.5 billion searches daily, establishing it as one of the largest search tools globally.
- Visual search engines, including Google Lens, have demonstrated an accuracy rate of up to 95% in recognizing common objects, plants, and animals.
- In the realm of e-commerce, visual search enables 62% of consumers to buy products they encounter through visual search.
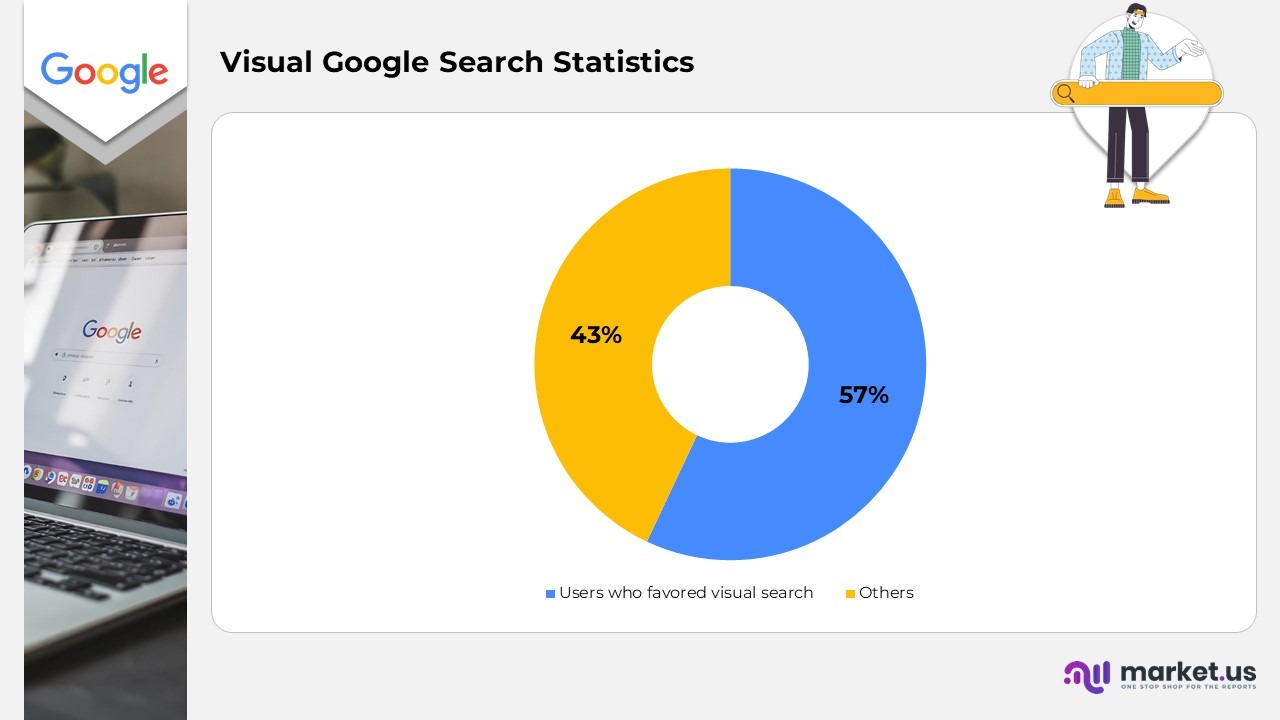
- 57% of users favored visual search for product discovery over other methods, and more than 30% of online shopping experiences in 2023 incorporated some form of visual search.
- It is noteworthy that Google Lens accounts for over 40% of Google’s traffic derived from visual searches, offering features such as barcode scanning, text identification and translation, as well as landmark recognition.
SEO and Google Ranking Statistics
- 95% of Google users prefer to click on the first result displayed in the search engine results page.
- Carefully executed SEO strategies are likely to yield traffic increases of up to 1000% compared to organic social media efforts.
- A single position improvement can enhance the click-through rate (CTR) by 30.8%.
- 12% of searches result in featured snippets appearing in the search results.
- Web pages with the greatest number of total backlinks typically achieve the highest rankings on Google.
- URLs that include a keyword experience a 45% increase in CTR.
- Paid search advertisements provide a return on investment (ROI) that is 5.66 times greater than that of organic search.
- Title tags represent one of the most optimized elements of the code regarding CTRs (click-through rates) and can enhance CTRs by as much as 20 to 30%.
- In simple terms, the average CTR on pages with an optimized meta description is 5.8% higher than on those without.
- 77% of the first page of Google results utilize HTTPS.
- 25% of ranking pages are optimized for images and may include alt tags to improve a page’s SEO score.
- A first-page result on Google averages 1,447 words.
- Video pages are 53 times more likely to appear on the first page of Google results.
Google Play Store Statistics
- As of the second quarter of 2024, there are more than 2.26 million mobile applications available for download on the Google Play Store.
- The Google Play Store reached the significant milestone of 1 million applications in July 2013.
- YouTube ranks as the most popular application from Google, achieving 13.65 million downloads from users of both iOS and the Google Play Store in July 2024.
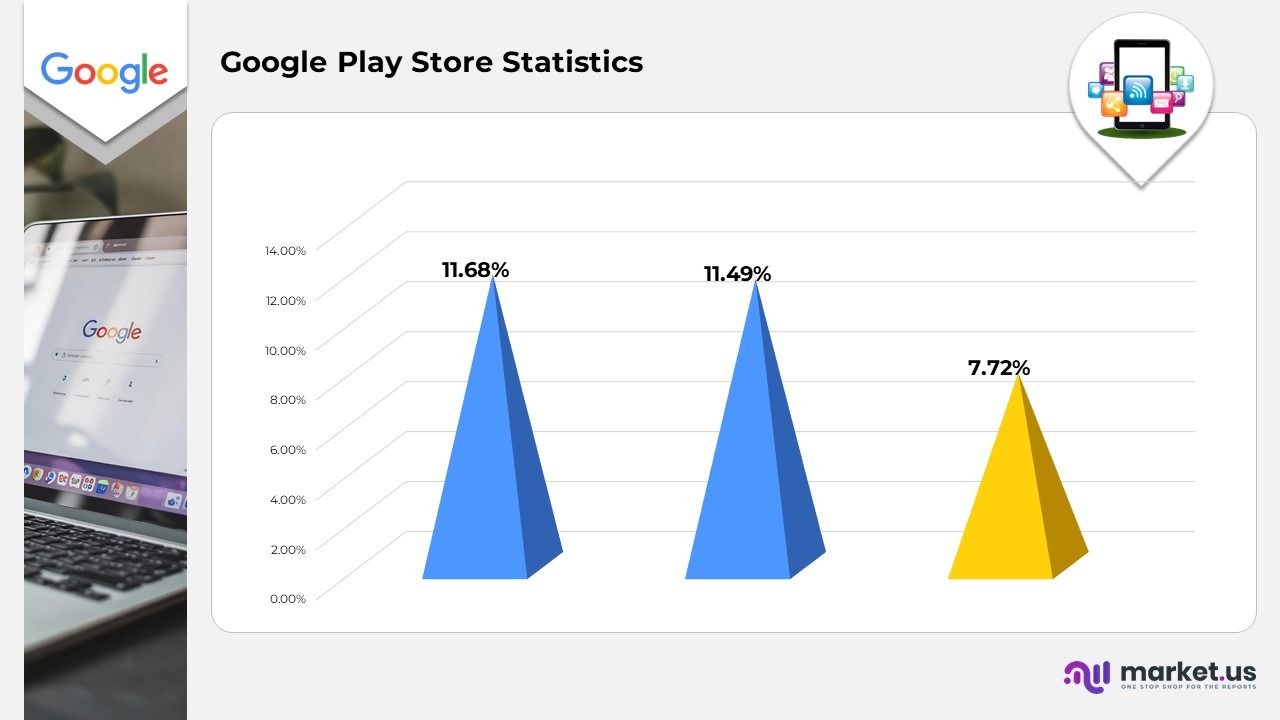
- Games constitute 11.68% of the total applications on the Google Play Store, followed closely by educational applications at 11.49% and business applications at 7.72%.
- Health and fitness applications on the Google Play Store boast an average rating of 4.12 stars, which is the highest average rating across all categories.
Google Fun Facts
- Google was originally called “BackRub” during its early development at Stanford University because it analysed backlinks to determine a site’s importance.
- The name “Google” is a play on the mathematical term “googol,” which means the number 1 followed by 100 zeros.
- Google’s first workspace was a garage in Menlo Park, California, rented from Susan Wojcicki who later became CEO of YouTube.
- Google launched Gmail on April Fool’s Day, adding to the company’s quirky brand personality.
- Early on, Google’s founders tried to sell the company to Excite for less than $1 million, but the offer was rejected.
Recent Developments
- Google has recently made notable advancements in artificial intelligence across its primary services, such as the introduction of Gemini in Chrome and the enhancement of AI functionalities for Search.
- The “Nano Banana” AI model has been developed for Search and NotebookLM, alongside improvements to Google Cloud’s AI capabilities and progress in robotics and video generation technologies, including Veo 3.1.
- Google is channeling investments into infrastructure and technology across multiple states to foster innovation and uphold its commitments to clean energy. Recent updates encompass new features for the Pixel Buds 2a, Pixel Watch 4, and Pixel 10 Pro Fold, as well as information regarding repair options and new collaborations.
Google Future Predictions
- If Google’s revenue increases by 12% annually over the next five years, and the operating margin remains consistent, the earnings per share are expected to grow at a comparable rate, reaching approximately $16.5 by the year 2030. By applying a price-to-earnings ratio of 25, the projected share price for 2030 would be around $415.
- Google’s stock (GOOGL) is forecasted to experience steady growth with price predictions around $214 by the end of 2025 and reaching about $260 to $270 by 2030.
Conclusion
Over the years, Google has greatly broadened its array of services, especially following its acquisition of YouTube in 2006. This video platform has emerged as one of Google’s most prosperous endeavors, presently representing over 13 percent of the company’s revenue. In addition, Google’s portfolio encompasses the Android mobile operating system, which held more than 72 percent of the global smartphone operating system market share in 2024.
Its digital offerings include the content platform Google Play, the Chrome browser and the ChromeOS operating system, the online payment service Google Pay, as well as a variety of mobile devices and hardware such as the Chromecast. Furthermore, Google Cloud, along with the company’s various subscriptions, platforms, and devices, has also played a crucial role in enhancing its earnings in recent years.