
Global Virtual Try-ons Market Size, Share Analysis By Component (Software, Hardware, and Services), By Technology (Augmented Reality (AR), Virtual Reality (VR), AI/Computer Vision/ML, and Others), By Devices (Smartphones & Tablets and Computer), By Application, By End-User Industry, By Region and Companies - Industry Segment Outlook, Market Assessment, Competition Scenario, Trends and Forecast 2025-2034
- Published date: August 2025
- Report ID: 155616
- Number of Pages: 300
- Format:
-
keyboard_arrow_up
Quick Navigation
- Virtual Try-ons Market Size
- Key Takeaways
- Market Overview
- Roles of AI
- U.S. Industry Size
- By Component Analysis
- By Technology Analysis
- By Devices Analysis
- By Application Analysis
- By End-User Industry Analysis
- Key Trends and Innovations
- Top Growth Factors
- Key Market Segments
- Driver Analysis
- Restraint Analysis
- Opportunity Analysis
- Challenge Analysis
- Key Player Analysis
- Recent Developments
- Report Scope
Virtual Try-ons Market Size
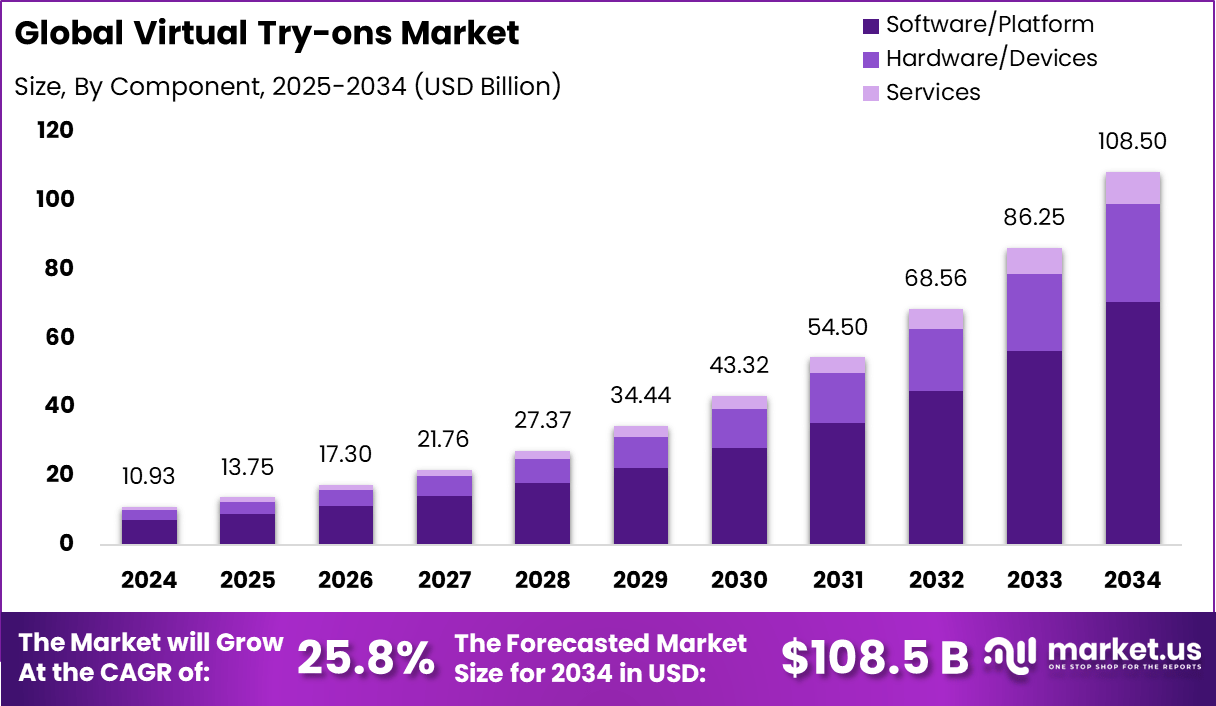
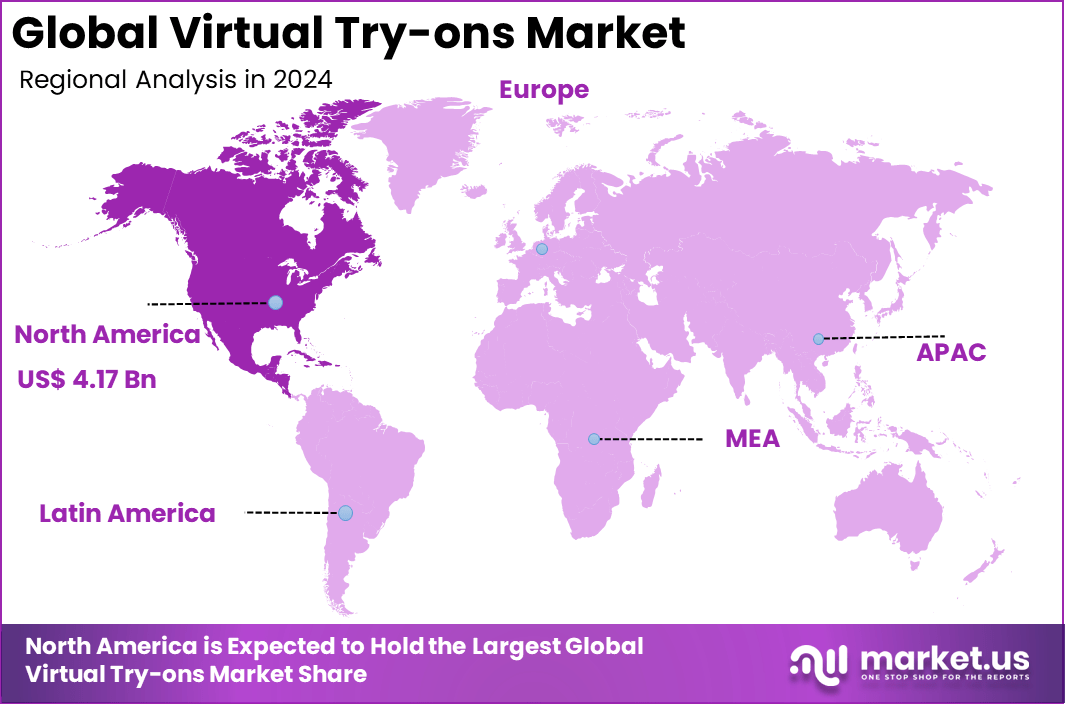
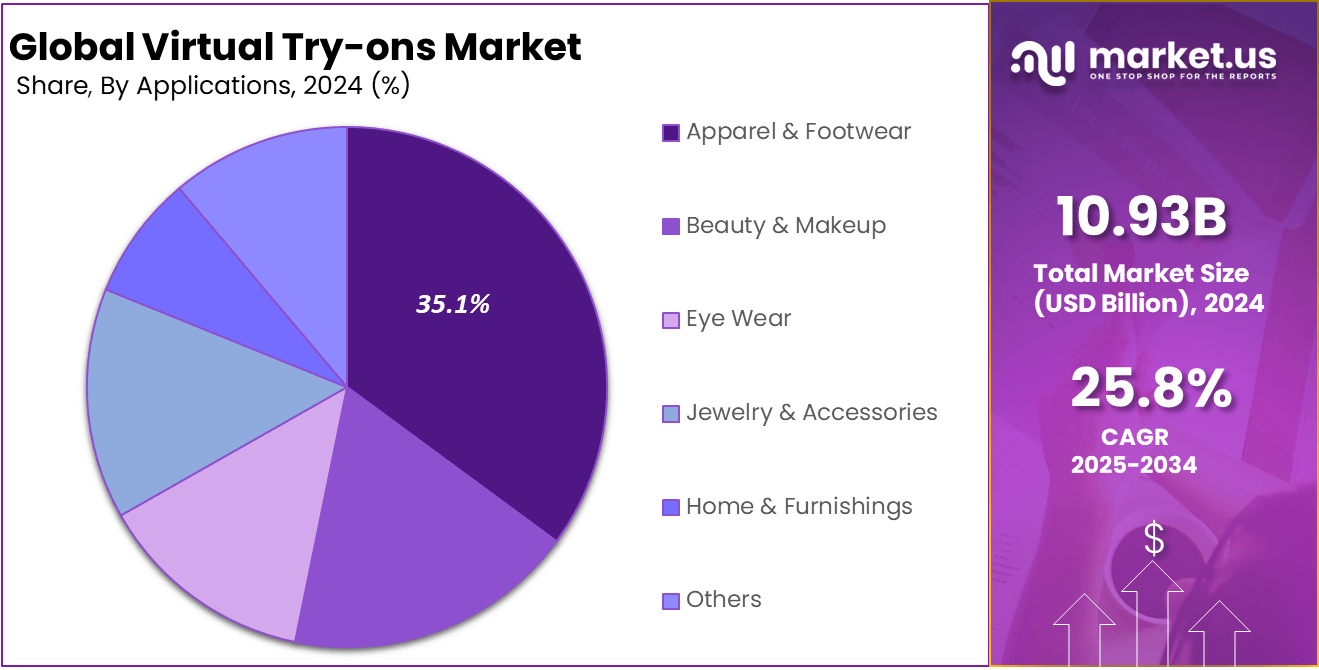
The Global Virtual Try-ons Market size is expected to be worth around USD 108.5 billion by 2034, from USD 10.93 billion in 2024, growing at a CAGR of 25.8% during the forecast period from 2025 to 2034. In 2024, North America held a dominant market position, capturing more than a 38.2% share, holding USD 4.17 billion in revenue.
Key Takeaways
- The market is valued at USD 10.93 billion in 2024 and is expected to grow at a CAGR of 25.8% (2025–2034), driven by increasing adoption of immersive retail experiences.
- Software/Platform dominates the component segment with a 65.2% share, reflecting the strong demand for scalable virtual try-on solutions over physical hardware.
- Augmented Reality (AR) is the leading technology, accounting for 58.4% share, fueled by AR-powered mobile apps and online retail integrations.
- Smartphones & Tablets lead the device segment with 71.6% share, highlighting mobile-first consumer engagement strategies.
- Apparel & Footwear is the top application segment at 35.1%, followed by beauty and eyewear virtual try-on solutions.
- E-commerce dominates end-user industries with a 52.6% share, as major online retailers integrate virtual try-on to boost conversion rates and reduce returns.
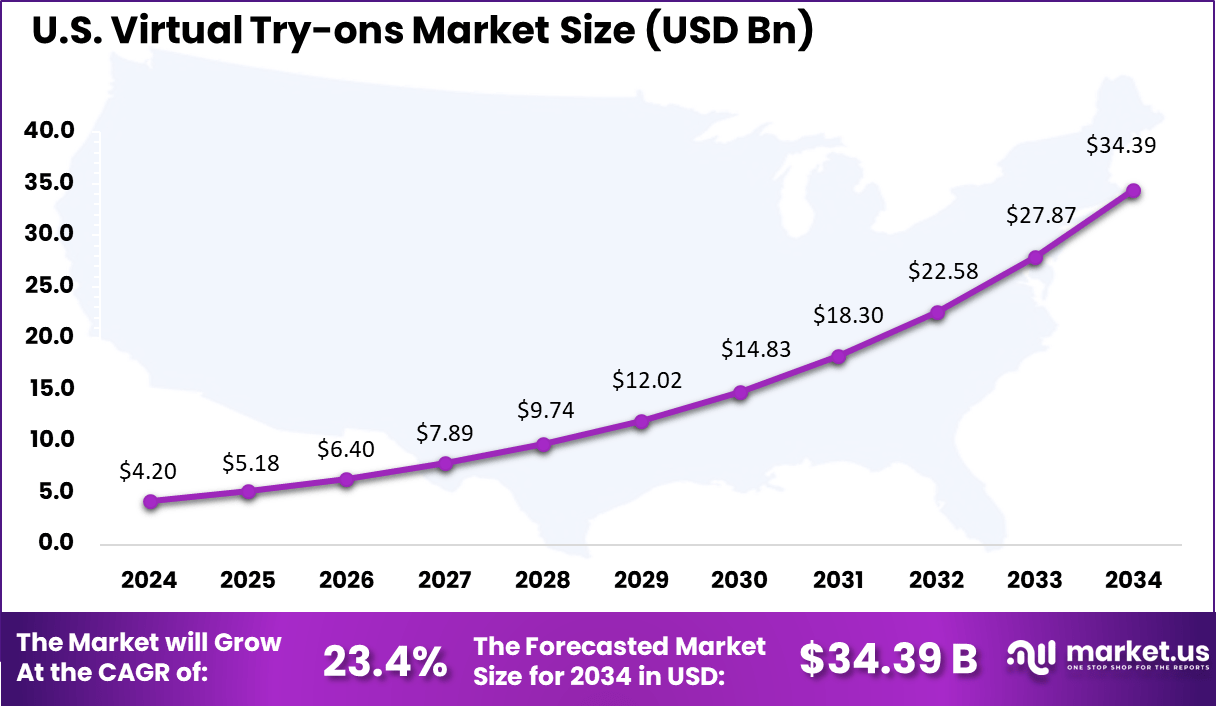
- North America holds the largest regional market share at 38.2%, with the US contributing USD 4.2 billion in 2024 and projected to grow at a 23.4% CAGR.
Market Overview
The Virtual Try-ons Market focuses on digital tools that let people see how clothing, accessories, cosmetics, and other products would look on them before buying, all from a phone or computer. This type of technology is changing the way people shop both online and in stores, making it easier for customers to make decisions and for businesses to engage visitors in new ways.
Virtual try-ons have gained a strong foothold in fashion, eyewear, beauty, and even furniture, as brands look for ways to bridge the gap between digital browsing and the hands-on experience of a physical store. Top driving factors include the high cost of product returns and the need to raise conversion without discounting.
According to NRF, total returns for the retail industry are projected to reach $890 billion in 2024, highlighting the growing importance of returns management in balancing profitability and customer satisfaction. Consumer behavior strongly influences this trend, as 76% of shoppers view free returns as a deciding factor in where they shop, while more than two-thirds of retailers are prioritizing upgrades to their returns capabilities within the next six months.
Shopify reported that merchants using 3D and AR content saw an average 94% conversion increase, with experiments showing 44% higher add to cart and 27% higher order likelihood after 3D interaction. A study summarized by RetailDive found 66% of shoppers who use AR are less likely to return items, which aligns with retailers’ push to reduce costly reverse logistics.
Roles of AI
AI Role> >Description> 3D Body/Face Detection & Modeling AI uses computer vision to scan users via camera, generating realistic 3D avatars and accurate virtual fits. Real-Time Rendering & Augmentation Deep learning enables smooth, real-time overlay of clothing, accessories, makeup, or eyewear on live images or video feeds. Personalized Fit & Style Recommendation AI analyzes user measurements, purchase behavior, and preferences to suggest optimal sizes and curated styles. Predictive Sizing & Return Reduction AI predicts fit issues before checkout, lowering return rates and optimizing inventory management. Multimodal & Cross-Platform Experience AI powers seamless try-ons across devices, apps, and channels, including AR, web, mobile, and metaverse platforms. U.S. Industry Size
The U.S. Virtual Try-ons Market was valued at USD 4.2 Billion in 2024 and is anticipated to reach approximately USD 24.39 Billion by 2034, expanding at a compound annual growth rate (CAGR) of 23.4% during the forecast period from 2025 to 2034.
In 2024, North America held a dominant market position, capturing more than 38.2% share and generating nearly USD 4.17 billion in revenue. The region’s leadership in the virtual try-ons market is strongly linked to its advanced digital infrastructure, early adoption of augmented reality and AI technologies, and the dominance of e-commerce platforms.
In the beauty sector, Ulta Beauty’s GLAMlab has seen over 200 million shade try-ons since its launch, significantly boosting online sales. According to Snap Inc., AR experiences influence 94% higher conversion rates for some U.S. retailers. With high smartphone penetration and strong consumer preference for immersive shopping, the U.S. market is poised for sustained expansion.
The region’s high smartphone penetration and widespread use of social media have also created a favorable environment for virtual try-ons. Consumers in the U.S. and Canada actively engage in online shopping and value immersive tools that allow them to test products virtually before purchase. Beauty, eyewear, and apparel retailers in particular have leveraged this trend, offering highly personalized and realistic experiences that drive customer trust.
By Component Analysis
In 2024, the Software/Platform segment dominates the Virtual Try-ons Market with a substantial share of 65.2%. This segment’s prominence is driven by the growing need for advanced software solutions that enable realistic and interactive virtual try-on experiences.
Software platforms act as the backbone, integrating technologies such as augmented reality (AR), 3D modeling, and AI to simulate products on users virtually. Retailers and brands leverage these platforms to create immersive and personalized shopping experiences, which are particularly crucial in reducing return rates and increasing customer satisfaction in online shopping environments.
The continuous evolution of software capabilities, such as enhanced rendering quality, real-time adaptability, and seamless integration with e-commerce platforms, further accelerates the demand for this segment. Its ability to deliver scalability and customization ensures it remains the core of virtual try-on technologies worldwide in 2024.
By Technology Analysis
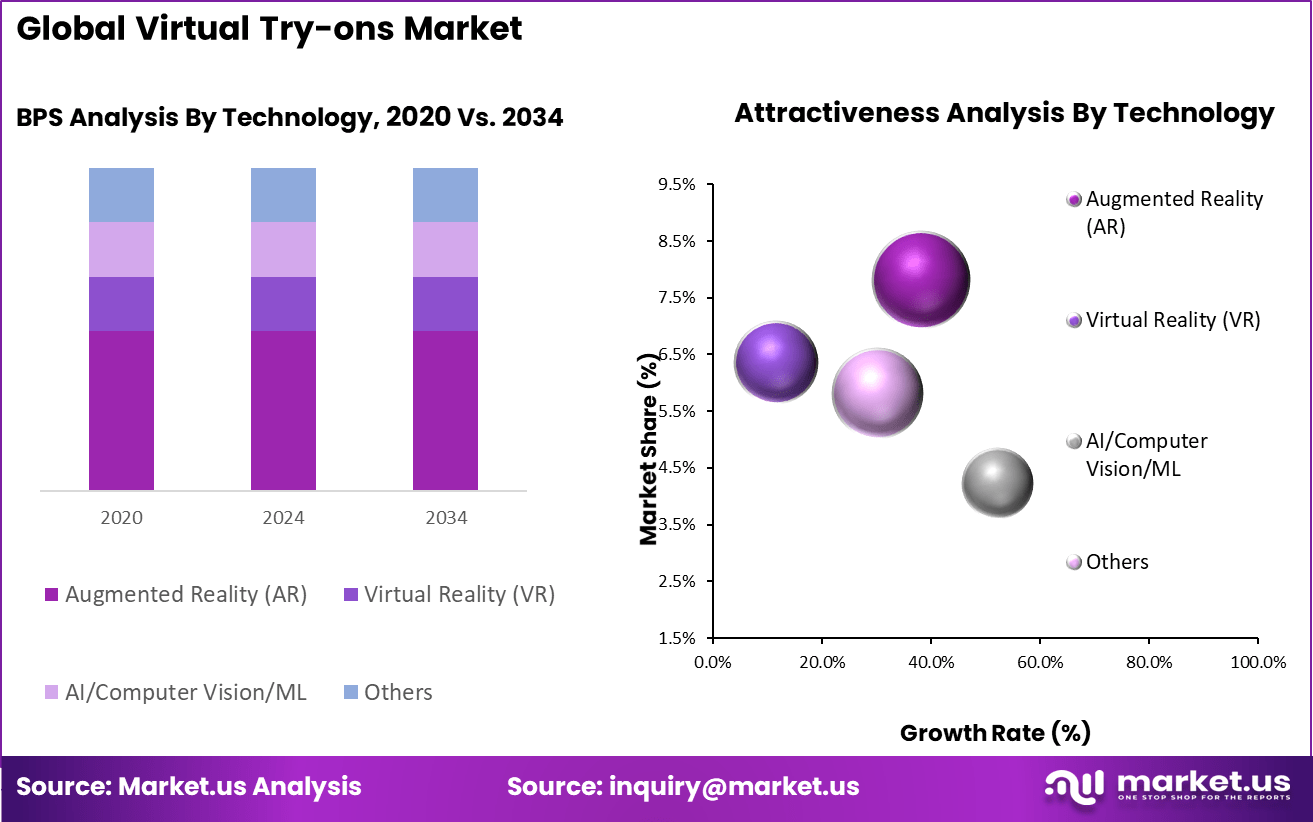
In 2024, Augmented Reality (AR) emerges as the leading technology within the Virtual Try-ons Market, holding 58.4% of the market share. AR technology enhances virtual try-ons by overlaying digital images of products like apparel, accessories, or footwear onto the user’s live environment, creating an interactive and lifelike experience. This real-time visualization fosters consumer confidence in online purchases by bridging the gap between physical and digital shopping.
The widespread adoption of AR is facilitated by its ability to function on multiple devices without the need for specialized hardware, along with constant improvements in AR frameworks and SDKs. As brands seek innovative ways to engage customers and differentiate themselves digitally, AR remains a powerful tool driving advancements and adoption in virtual try-on solutions throughout 2024.
By Devices Analysis
In 2024, Smartphones & Tablets dominate the devices segment in the Virtual Try-ons Market with a commanding share of 71.6%. The widespread usage, portability, and constant connectivity of these devices make them the primary medium through which consumers experience virtual try-ons. Enhanced camera technologies and powerful processors in modern smartphones and tablets facilitate high-quality AR visualizations and seamless user experiences.
Retailers and tech developers prioritize smartphone and tablet compatibility to reach a broader customer base, leveraging these devices’ familiarity and convenience. This accessibility drives mass adoption of virtual try-on applications, especially in the e-commerce and fashion industries, positioning smartphones and tablets as the leading hardware in 2024.
By Application Analysis
In 2024, the Apparel & Footwear segment leads the application side of the Virtual Try-ons Market with a significant share of 35.1%. This segment benefits greatly from virtual try-on technology as consumers increasingly seek convenient ways to visualize clothing and footwear digitally before purchasing.
Virtual try-ons help customers assess fit, style, and color without physically trying the products, significantly enhancing the online shopping experience and reducing return rates. The fashion industry’s fast-paced cycles coupled with consumer demand for personalized shopping experiences continue to drive the use of virtual try-ons in this segment.
Brands actively invest in these technologies to improve engagement and conversion rates, cementing apparel and footwear as a critical application for virtual try-on solutions in 2024. According to Shopify, virtual fitting tools can reduce return rates by up to 40% and increase conversion by 20%.
The boom in digital fashion, coupled with social media integration, where customers can share try-on looks on platforms like Instagram, has fueled adoption. Additionally, sneaker resellers and sportswear brands leverage AR try-ons to tap into younger, mobile-first audiences. As e-commerce competition intensifies, apparel & footwear will remain the primary driver of virtual try-on innovation.
By End-User Industry Analysis
In 2024, E-commerce leads the end-user industry segment of the Virtual Try-ons Market, capturing a majority share of 52.6%. The rapid expansion of online retail has made virtual try-on technologies indispensable as they address critical challenges such as customer uncertainty and product return rates.
E-commerce platforms leverage these solutions to offer immersive experiences that replicate in-store shopping benefits, thereby enhancing consumer trust and loyalty. The growth of mobile commerce, coupled with increasing investments in digital transformation initiatives by retailers, fuels the adoption of virtual try-on tools in the e-commerce space.
As competition intensifies, businesses are compelled to integrate these immersive technologies to differentiate themselves and deliver superior customer experiences, driving robust market growth for virtual try-ons in the e-commerce industry throughout 2024.
Key Trends and Innovations
Trend/Innovation Description Cloud-Based SaaS VTO ~70% market share by platform with scalable subscription models for retailers AI-Driven Fit & Personalization ML and deep learning offer hyper-personalized recommendations and predictive sizing Multimodal & Hybrid Solutions Integration of AR/VR, AI, cloud, 3D avatars, and mobile-first workflows Cross-Category Expansion VTO moves beyond apparel to jewelry, hairstyles, makeup, and even home interiors Analytics & Data Monetization Retailers use VTO-generated user data for personalization, remarketing, and inventory planning Sustainability & CSR VTO reduces carbon footprint by limiting returns/shipping and supports virtual fashion Top Growth Factors
Key Factors Description E-commerce Expansion Surge in online shopping post-pandemic and continued retail digitization fuels VTO adoption Augmented Reality Adoption AR-enabled try-on experiences boost engagement and conversion for fashion, beauty, and eyewear Smartphone Penetration High global smartphone/internet access widens the audience for mobile VTO solutions Personalization Demand Rising consumer expectations for customized, size-accurate, and interactive online shopping AI & Computer Vision Advances Improved 3D body/face scanning, ML fit prediction, and low-latency rendering offer immersive realism Reduced Return Rates Try-ons decrease purchase uncertainty, lowering product return rates and improving margins Omnichannel Retailing Brands focus on seamless transition between online and in-store try-on journeys Key Market Segments
Component
- Software/Platform
- Hardware/Devices
- Services
Technology
- Augmented Reality (AR)
- Virtual Reality (VR)
- AI/Computer Vision/ML
- Others
Devices
- Smartphones & Tablets
- Computer
Application
- Apparel & Footwear
- Beauty & Makeup
- Eye Wear
- Jewelry & Accessories
- Home & Furnishings
- Others
End-User Industry
- E-commerce
- Fashion
- Beauty & Cosmetics
- Eyewear Retailers & Labs
- Others
Key Regions and Countries Covered in this Report
- North America
- The US
- Canada
- Europe
- Germany
- France
- The UK
- Spain
- Italy
- Russia
- Netherland
- Rest of Europe
- APAC
- China
- Japan
- South Korea
- India
- Australia & New Zealand
- ASEAN
- Rest of APAC
- Latin America
- Brazil
- Mexico
- Rest of Latin America
- Middle East & Africa
- GCC Countries
- South Africa
- Rest of MEA
Driver Analysis
Boom in Online Shopping and Demand for Convenience
The explosive growth of online shopping is a main force behind the rise of virtual try-ons. Consumers want convenience – they prefer browsing a wide selection from the comfort of their homes and expect a seamless, enjoyable experience. Virtual try-on bridges the gap by letting buyers visualize how things fit or look before buying, reducing the guesswork and common disappointment that comes with traditional online shopping.
This shift is especially noticeable among younger buyers and urban populations who value quick, personalized, and risk-free purchasing experiences. By making it easier for shoppers to imagine products on themselves, virtual try-on technology builds confidence and makes customers more likely to complete a purchase without visiting a physical store.
Restraint Analysis
High Initial Setup Costs and Technology Integration
Virtual try-on systems require significant investment in both software and hardware. Setting up high-quality 3D modeling, integrating with existing online platforms, and ensuring smooth performance demand skilled expertise and resources. For smaller businesses, these costs can be prohibitive and slow down adoption.
Despite the potential for increased sales and customer engagement, technical barriers still exist. Integrating virtual try-on functions seamlessly with e-commerce platforms and making sure they work for all devices remains a challenge. These factors can limit access for smaller and less tech-savvy retailers, even as demand among consumers grows.
Opportunity Analysis
Wider Access Through Mobile Adoption and New Partnerships
Growing access to smartphones and advancements in camera technology have made virtual try-ons possible for a broader audience. As more people carry devices equipped for augmented reality, the technology becomes available to shoppers worldwide, opening new markets and customer segments. Companies have an opportunity to team up with tech providers or offer virtual try-on as a service – this simplifies adoption and brings fresh innovation.
There’s also room for growth by expanding into untapped product categories and regions. Brands that invest in making these experiences easy to use and relevant for local cultures can capture new customers and stand out in crowded digital marketplaces.
Challenge Analysis
Ensuring Realism and Building Trust
One of the biggest hurdles is convincing shoppers that virtual try-on accurately represents real-life appearance. If the on-screen results do not match what is delivered, customers may lose trust in both the retailer and the technology. Continued improvements in graphics, better 3D scanning, and clear communication about limitations are essential for maintaining credibility.
Building a reliable user experience is crucial – technical glitches and unrealistic previews frustrate customers and can harm brand reputation. The industry needs to keep raising the standard for quality and ensure users know what to expect, so virtual try-on tools become a source of trust instead of confusion.
Key Player Analysis
In the Virtual Try-ons Market, companies such as Zakeke, Wannaby Inc., DeepAR, and Kling AI have established themselves as pioneers in immersive digital experiences. These firms focus on creating advanced visualization platforms that allow consumers to preview products with greater accuracy and personalization. Their innovations in augmented reality and computer vision have enhanced customer confidence in online shopping.
Another cluster of notable participants includes Banuba Limited, Onix, metadome.ai, and 3DLOOK Inc. These companies specialize in AI-driven facial recognition, 3D modeling, and AR-based fitting room solutions. Their technologies are designed to provide realistic simulations of apparel, accessories, and cosmetics, offering brands a tool to reduce returns while boosting conversion rates.
Emerging players such as AUGLIO, Quy Technology, WEARFITS, MySize Inc., Zugara, and Queppelin are also expanding their market footprint. These firms emphasize affordability, scalability, and integration capabilities, enabling small and medium retailers to adopt virtual try-on technology. Their solutions are particularly relevant for niche markets such as eyewear, footwear, and jewelry, where product fit and aesthetics strongly influence purchase decisions.
Top Key Players in the Virtual Try-ons Market
- Zakeke
- Wannaby Inc.
- DeepAR (I Love Ice Cream Ltd.)
- Kling AI
- Banuba Limited
- Onix
- metadome.ai (Formerly Adloid)
- 3DLOOK Inc.
- AUGLIO
- Quy Technology Pvt. Ltd. (QUYTECH)
- WEARFITS
- MySize Inc.
- Zugara, Inc.
- Queppelin
- Other Key Players
Recent Developments
- July 2025: Google has launched AI-powered shopping tools, including a nationwide virtual try-on for clothing in the U.S., enhanced price alerts, and an AI-driven style inspiration feature. Users can upload full-length photos via Search, Shopping, or Images to see how apparel fits, save looks, revisit try-ons, and share results.
- May 2025: AlphaBake has launched AI-powered virtual try-ons for online clothing brands, partnering with Prashanti Sarees, Jade Blue, and Maatshi. The scalable, photorealistic solution boosts conversions, revenue, and engagement by letting customers visualize garments on themselves. Integrated with Shopify or via API, it enhances personalization, reduces acquisition costs, and bridges digital-physical shopping experiences.
- May 2025: KiranaPro has acquired AR-driven virtual try-on startup Likeo to enhance its Gen Z-focused BLACK shopping app, making it India’s first to offer AI-powered try-ons for apparel, jewellery, and eyewear. The rollout aims to boost shopping confidence, cut returns, and deliver a personalised, immersive online retail experience.
- June 2025: KiranaPro has acquired Likeo to integrate AI-powered virtual try-ons into its Black fashion platform, becoming India’s first app to offer immersive clothing, jewellery, and eyewear trials. Targeting Gen Z, the feature combines visual computing and interactivity, with Likeo’s CEO joining KiranaPro to drive AI innovation and enhance online shopping experiences.
- October 2024: Zalando has launched a new virtual fitting room, allowing customers in 14 European countries to create 3D avatars from their body measurements for a better fit. Featuring Levi’s garments, the four-week test builds on 2023 tech, aiming to reduce returns—already showing up to 40% fewer size-related returns in trials.
Report Scope
Report Features Description Market Value (2024) USD 10.93 Bn Forecast Revenue (2034) USD 108.50 Bn CAGR (2025-2034) 25.8% Base Year for Estimation 2024 Historic Period 2020-2023 Forecast Period 2025-2034 Report Coverage Revenue forecast, AI impact on market trends, Share Insights, Company ranking, competitive landscape, Recent Developments, Market Dynamics and Emerging Trends Segments Covered By Component (Software, Hardware, and Services), By Technology (Augmented Reality (AR), Virtual Reality (VR), AI/Computer Vision/ML, and Others), By Devices (Smartphones & Tablets and Computer), By Application (Apparel & Footwear, Beauty & Makeup, Eye Wear, Jewelry & Accessories, Home & Furnishings, and Others), By End-User Industry (E-commerce, Fashion, Beauty & Cosmetics, Eyewear Retailers & Labs, and Others) Regional Analysis North America – US, Canada; Europe – Germany, France, The UK, Spain, Italy, Russia, Netherlands, Rest of Europe; Asia Pacific – China, Japan, South Korea, India, New Zealand, Singapore, Thailand, Vietnam, Rest of APAC; Latin America – Brazil, Mexico, Rest of Latin America; Middle East & Africa – South Africa, Saudi Arabia, UAE, Rest of MEA Competitive Landscape Zakeke, Wannaby Inc., DeepAR (I Love Ice Cream Ltd.), Kling AI, Banuba Limited, Onix, metadome.ai (Formerly Adloid), 3DLOOK Inc., AUGLIO, Quy Technology Pvt. Ltd. (QUYTECH), WEARFITS, MySize Inc., Zugara, Inc., Queppelin, and Other Key Players Customization Scope Customization for segments, region/country-level will be provided. Moreover, additional customization can be done based on the requirements. Purchase Options We have three license to opt for: Single User License, Multi-User License (Up to 5 Users), Corporate Use License (Unlimited User and Printable PDF) 
-
-
- Zakeke
- Wannaby Inc.
- DeepAR (I Love Ice Cream Ltd.)
- Kling AI
- Banuba Limited
- Onix
- metadome.ai (Formerly Adloid)
- 3DLOOK Inc.
- AUGLIO
- Quy Technology Pvt. Ltd. (QUYTECH)
- WEARFITS
- MySize Inc.
- Zugara, Inc.
- Queppelin
- Other Key Players
Our Clients
- 155616
- August 2025


