


Report Overview
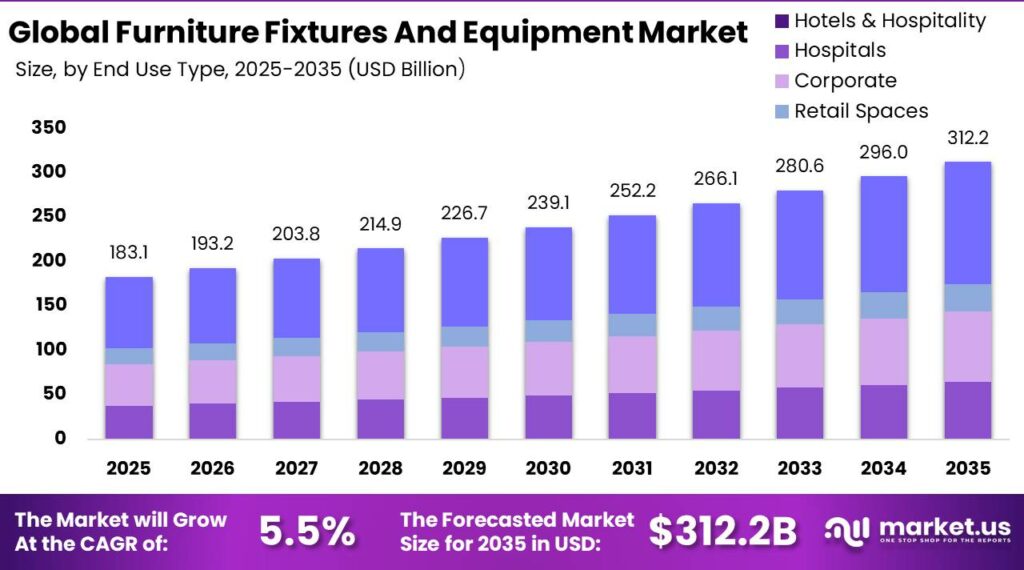
Global Furniture Fixtures And Equipment Market size is expected to be worth around USD 312.2 Billion by 2035 from USD 183.1 Billion in 2025, growing at a CAGR of 5.5% during the forecast period 2026 to 2035. This growth signals steady, capital-backed demand rather than a speculative spike. Investors gain a predictable runway tied to real estate and institutional build cycles.
The Home Improvement Market shares structural roots with this sector, yet FF&E is defined by movable furniture, built-in fixtures, and operational equipment installed across commercial and institutional buildings. Buyers procure these items as bundled packages during fit-out projects, not as one-off retail purchases. This project-driven structure means demand tracks construction and renovation pipelines, so vendors must align capacity with building activity to protect order flow.
Key Takeaways
- Global market size reached USD 183.1 Billion in 2025 and heads toward USD 312.2 Billion by 2035.
- The market grows at a CAGR of 5.5% across the 2026 to 2035 forecast window.
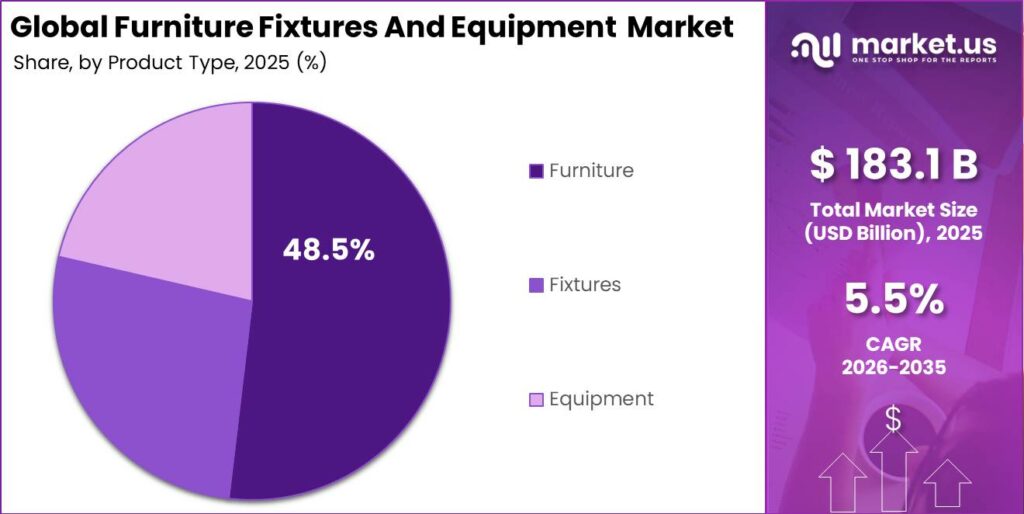
- Furniture led the By Product segment with a 48.5% share.
- Hotels & Hospitality led the By End Use segment with a 39.2% share.
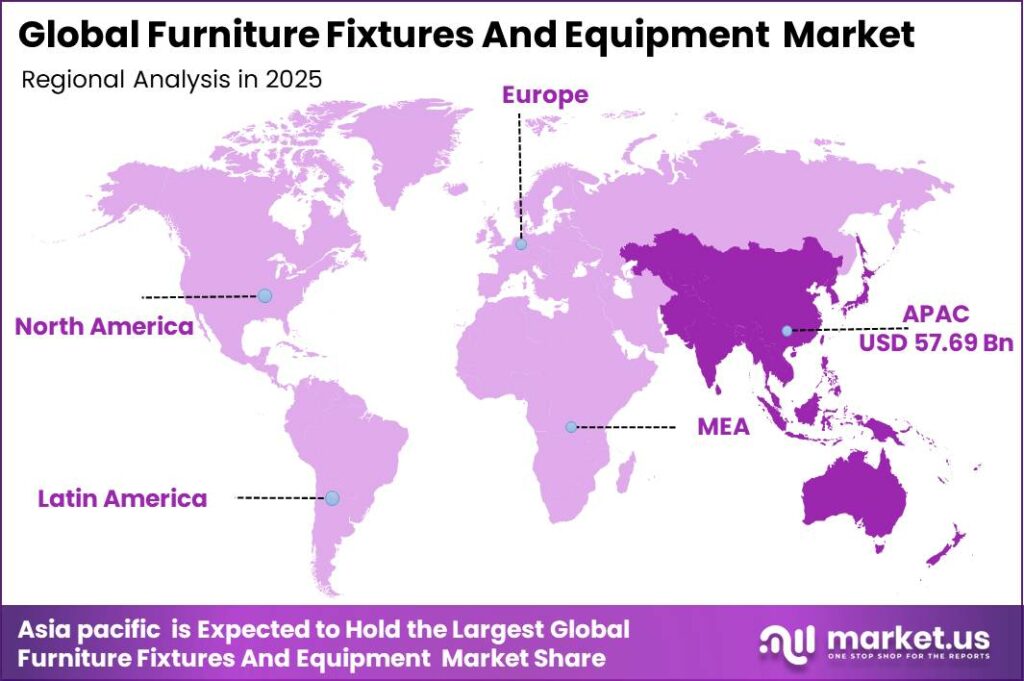
- Asia-Pacific dominated all regions with a 31.5% share, valued at USD 57.69 Billion.
Government policy shapes FF&E demand through building, energy, and procurement rules that dictate what buyers can specify. Data from UNEP shows the construction and building sector accounts for approximately 37% of global CO2 emissions and about 34% of global energy demand. This regulatory pressure pushes public buyers toward certified, energy-aware fixtures. Vendors who pre-certify products win eligibility for large government tenders before competitors react.
As reported by UNEP, the buildings and construction sector contributes around 11% to 13% of global GDP and employs about 7% to 10% of the global workforce. This scale anchors FF&E procurement across offices, hotels, and hospitals. Therefore, suppliers tied to institutional projects gain a broad, stable customer base that cushions them against single-sector downturns.
Figures from UNEP show around 2.3 Billion square meters of new floor area gets added worldwide each year. New floor area triggers first-fit FF&E installation across every commercial category. Consequently, manufacturers with fast lead times capture repeat specification on high-volume rollout projects. The World Bank found that the global education sector serves more than 1.5 Billion learners, sustaining continuous classroom furniture procurement.
Product Analysis
Furniture dominates with 48.5% due to high-volume seating and workstation demand.
In 2025, Furniture held a dominant market position in the By Product segment of Furniture Fixtures And Equipment Market, with a 48.5% share. Data from UN Comtrade and WITS shows world exports under furniture code HS 9403 form a multi billion dollar trade base, with office furniture code HS 940330 alone reaching USD 5.18 Billion in 2024. This trade depth confirms furniture as the volume anchor. Manufacturers should prioritize furniture capacity to defend baseline revenue.
Fixtures cover built-in elements such as lighting, shelving, and casework installed permanently within a space. According to UNIDO, quarterly industrial indices now cover 117 countries representing 97.2% of global manufacturing value added, showing broad supply capacity for fixture production. This wide manufacturing base keeps fixture pricing competitive. Buyers gain sourcing flexibility, so vendors must compete on installation service and lead time rather than price alone.
Equipment includes operational hardware such as kitchen units, audiovisual systems, and clinical devices tied to a building’s function. As per our research, Starjoy Global highlighted in January 2026 that 2026 FF&E procurement increasingly bundles smart furniture integration with equipment specification. This bundling raises equipment value per project. Suppliers who pair equipment with data and monitoring features unlock premium margins on institutional contracts.
End Use Analysis
Hotels & Hospitality dominates with 39.2% due to full-package branded room procurement.
In 2025, Hotels & Hospitality held a dominant market position in the By End Use segment of Furniture Fixtures And Equipment Market, with a 39.2% share. Data from UN Comtrade shows India alone exported USD 1,130.40 Million of HS 9403 furniture in 2023, holding a 1.15% global share that feeds hospitality supply chains. This export capacity supports bulk hotel rollouts. Suppliers with branded package programs capture repeat multi property orders.
Hospitals & Healthcare Facilities procure compliance certified furniture and equipment for wards, operating rooms, and diagnostics. WHO data on hospital beds shows global capacity averaging around 307 beds per 100,000 population across 183 countries. This installed base drives constant replacement demand. Therefore, vendors holding clinical certifications gain protected access to a recurring, regulation locked procurement stream.
Corporate offices buy workstations, storage, and collaboration furniture during fit-out and refurbishment cycles. As per our research, office furniture trade under HS 940330 reached USD 5.18 Billion globally in 2024, reflecting steady corporate specification. This volume rewards modular product lines. Manufacturers offering reconfigurable systems win longer account tenure with facilities teams.
Retail Spaces invest in experiential fixtures and interactive display equipment to support omnichannel formats, while Others end uses collectively hold the remaining share. Retail fixtures turn over faster than office furniture as brands refresh store concepts. Consequently, fixture vendors with rapid design-to-install cycles capture the highest reorder frequency across these two end-use groups.
Key Market Segments
By Product
- Furniture
- Fixtures
- Equipment
By End Use
- Hotels & Hospitality
- Hospitals & Healthcare Facilities
- Corporate/Offices
- Retail Spaces
- Others
Regional Analysis
Asia-Pacific Dominates the Furniture Fixtures And Equipment Market with a Market Share of 31.5%, Valued at USD 57.69 Billion
Asia-Pacific led the global market in 2025 with a 31.5% share worth USD 57.69 Billion. Rapid hotel and commercial construction across the region feeds bulk FF&E procurement. As per our research, the global hospitality pipeline exceeded 187,000 hotels in 2025, with much of that build activity concentrated in Asia. This scale rewards local manufacturing. Vendors with regional factories cut freight cost and lead time, protecting margin on high-volume rollouts.
Emerging Asia-Pacific markets also rank among the fastest-growing zones as urbanization drives first-generation commercial FF&E demand. New office and healthcare construction lifts installation cycles across India and Southeast Asia. This creates green field demand rather than replacement demand. As a result, early entrants who build distribution now lock in specification relationships before the market matures and competition tightens.
Key Regions and Countries
North America
- US
- Canada
Europe
- Germany
- France
- The UK
- Spain
- Italy
- Rest of Europe
Asia Pacific
- China
- Japan
- South Korea
- India
- Australia
- Rest of APAC
Latin America
- Brazil
- Mexico
- Rest of Latin America
Middle East and Africa
- GCC
- South Africa
- Rest of MEA
Market Dynamics
Market Opportunity Analysis - Underserved end uses and emerging regions open entry points for new FF&E players
Retail Spaces remain underexploited within the By End Use segment, sitting well below the Hotels & Hospitality 39.2% share. Retail buyers refresh store fixtures often, yet few vendors specialize in fast experiential formats. This gap rewards suppliers who build rapid design-to-install capability. New entrants targeting retail refresh cycles capture reorder frequency that hospitality-focused rivals overlook.
Hospitals & Healthcare Facilities offer a protected niche, since the segment trails Hotels & Hospitality yet demands certified products. By contrast to open commercial furniture, clinical procurement locks out non-certified suppliers. This creates a defensible position for vendors who invest early in compliance. Investors backing certified healthcare FF&E makers gain durable, regulation-shielded demand.
Emerging Asia-Pacific markets sit under the region’s 31.5% headline share, where first-generation commercial demand stays partly unserved. Local manufacturing capacity remains thin relative to build activity. This shortfall favors firms that localize production early. Therefore, early entrants secure specification relationships before larger global brands establish regional distribution.
Technology and Innovation Landscape - Smart integration, modular systems, and circular design reshape FF&E competition
Smart sensor-enabled FF&E now supports occupancy tracking and space utilization analytics in commercial buildings. This data turns passive furniture into a building management tool. Vendors embedding sensors unlock premium pricing and recurring analytics revenue. As a result, tech-enabled entrants gain an edge over volume-only manufacturers.
Modular acoustic furniture adoption is rising in open-plan office redesigns, giving buyers flexible, reconfigurable layouts. This modularity extends product life across changing floor plans. Manufacturers offering demountable systems win longer client relationships. Consequently, modular design becomes a competitive moat rather than a feature.
Digital FF&E specification platforms integrated with BIM-enabled construction workflows are reshaping how large projects get procured. BIM integration cuts specification errors and speeds installation. Suppliers with BIM-ready catalogues secure preferred status on major tenders. This means digital capability now gates access to the largest institutional contracts.
Antimicrobial and stain-resistant surface technologies are gaining ground across hospitality and healthcare FF&E, while circular economy principles guide lifecycle refurbishment. These material advances raise durability and hygiene compliance. Therefore, vendors leading on surface innovation and remanufacturing capture both certification-driven demand and second-cycle circular revenue.
Drivers
Commercial office space has been restructured since 2022 as companies adopt hybrid work, with hybrid schedules stabilizing at 58% to 68% of knowledge workers in North America and Europe. Firms convert assigned desk floors into activity-based layouts that need entirely new FF&E. A typical 10,000 square meter refurbishment replaces about 85% to 95% of existing furniture at a fit-out budget of USD 180 to USD 420 per square meter. This lifts per-project spend and rewards modular system suppliers.
Through 2023 to 2025, firms cut office footprint by 15% to 30% in high-cost cities yet raised furniture quality in retained space. This paradox held aggregate procurement above pre-pandemic dollar levels despite smaller floors. Modular system furniture grew from about 28% to 35% of commercial revenue toward 48% to 58% in tier-1 accounts. As a result, manufacturers investing in configuration software extend client tenure from 5 to 7 years toward 9 to 14 years.
| Driver | (~) % Impact on CAGR Forecast | Geographic Relevance | Impact Timeline |
|---|---|---|---|
| Commercial Real Estate Fit-Out & Office Refurbishment Wave Driving Institutional FF&E Procurement Across Post-Pandemic Workplace Redesign | +1.70% | United States, United Kingdom, Germany, France, Japan, Australia, China, UAE, Singapore | Short term (≤ 2 years) |
| Hospitality & Hotel Sector Renovation & New Build Pipeline Driving High-Volume Branded FF&E Specification Procurement | +1.20% | United States, GCC, China, Southeast Asia, India, Europe, Latin America | Short term (≤ 2 years) |
| Healthcare Infrastructure Expansion & Hospital Fit-Out Driving Specialised Clinical Furniture & Equipment Procurement | +0.90% | United States, India, China, GCC, Germany, United Kingdom, Australia, Brazil | Medium term (2–4 years) |
| Education Sector Capital Infrastructure Spending Driving Classroom & Campus FF&E Fleet Upgrades | +0.65% | United States, India, China, United Kingdom, Brazil, Southeast Asia, GCC | Medium term (2–4 years) |
| Ergonomic & Activity-Based Working Standards Mandating Sit-Stand Desk & Ergonomic Seating FF&E Specification Uplift | +0.52% | Europe, United States, Australia, Japan, Canada, Singapore, South Korea | Short term (≤ 2 years) |
| Rapid Urbanisation & Mixed-Use Real Estate Development in Emerging Markets Expanding First-Generation Commercial FF&E Demand | +0.38% | India, Southeast Asia, Sub-Saharan Africa, Latin America, Middle East | Short term (≤ 2 years) |
Restraints
Benchmark interest rates stayed high across major economies, with the U.S. Federal Reserve holding the federal funds rate at 5.25% to 5.50% through most of 2023 and 2024. This raised commercial construction loan rates from about 3.5% to 5.0% toward 6.5% to 8.5%. Higher debt cost deferred or cancelled many office and hotel projects. Consequently, FF&E suppliers lost near-term order volume tied to those stalled builds.
The Real Estate Development Market slowdown hit hospitality hardest, with U.S. hotel construction starts falling about 22% to 28% in 2023 versus 2019. Each cancelled 200 to 400 room project defers USD 4 Million to USD 12 Million in FF&E value. This stretches the order cycle from 18 to 30 months toward 28 to 48 months. As a result, manufacturers carry heavier receivables and thinner revenue recognition against pipeline.
| Restraint | (~) % Impact on CAGR Forecast | Geographic Relevance | Impact Timeline |
|---|---|---|---|
| Elevated Interest Rates & Tightened Commercial Real Estate Lending Suppressing New Office & Hotel Development CapEx | -1.20% | United States, Europe, Australia, Canada — commercial property finance-dependent development markets | Short term (≤ 2 years) |
| Commercial Office Vacancy Rate Overhang Deferring Landlord & Tenant FF&E Refurbishment Investment | -0.75% | United States, United Kingdom, Germany, France, Canada, Australia — high vacancy markets | Short term (≤ 2 years) |
| Public Sector Procurement Austerity & Budget Constraints Delaying Education & Government FF&E Replacement Cycles | -0.48% | United Kingdom, France, Germany, Australia, India, Brazil, South Africa | Short term (≤ 2 years) |
| Prolonged Lead Times for Specialised Upholstered & Custom-Specified Hospitality FF&E Delaying Project Completion & Payment | -0.32% | Global — most acute for bespoke hospitality & healthcare FF&E supply chains | Short term (≤ 2 years) |
Challenges
Public buyers, corporate ESG commitments, and product rules now require verified sustainability credentials as a baseline for FF&E tenders. Manufacturers must prove recycled content, formaldehyde-free materials, and take-back programs across full catalogues. The EU Ecodesign for Sustainable Products Regulation 2024/1781 took force on 18 July 2024, adding Digital Product Passport duties. This forces PLM system investment of EUR 500,000 to EUR 3 Million per manufacturer, raising the cost of market entry.
EU Green Public Procurement criteria increasingly require minimum 20% to 30% recycled content in metal parts and formaldehyde emissions below 0.03 milligrams per cubic meter. These thresholds force reformulation of 25% to 40% of existing catalogues at EUR 15,000 to EUR 60,000 per SKU. Total compliance cost reaches EUR 2 Million to EUR 15 Million per manufacturer. Consequently, government contract eligibility concentrates among larger, better-funded players.
| Challenge | (~) % CAGR Friction Drag | Geographic Relevance | Mitigation Horizon |
|---|---|---|---|
| Circular Economy & Furniture Sustainability Certification Compliance Complexity | -0.82% | European Union, United Kingdom, United States, Australia, Canada — ESG procurement mandate markets | Long term (≥ 4 years) |
| Skilled Upholstery, Joinery & Installation Workforce Shortages | -0.65% | United States, Europe, Australia, United Kingdom, Canada — tight trades labour markets | Long term (≥ 4 years) |
| Fragmented Global Supply Chain & Component Sourcing Lead Time Variability | -0.50% | Global — most acute for custom hospitality & healthcare FF&E with Asian component sourcing | Medium term (2–4 years) |
| BIM & Digital Specification Integration Complexity for FF&E in Large Project Environments | -0.35% | United States, Europe, Australia, Singapore, GCC — BIM-mandatory procurement markets | Long term (≥ 4 years) |
| Counterfeit & Grey Market FF&E Products Undercutting Branded Specification in Emerging Markets | -0.22% | India, Southeast Asia, Middle East, Sub-Saharan Africa, Latin America | Long term (≥ 4 years) |
Opportunities
FF&E-as-a-Service is open white space because most commercial FF&E still sells as outright capital purchases. Leasing and subscription models penetrated fewer than 3% to 6% of commercial FF&E volume even in advanced markets. Corporate sustainability goals and flexible term preferences now favor subscription contracts with 24 to 36 month renewals. This shift lets manufacturers convert lumpy project sales into recurring revenue and capture underserved demand.
The Smart Furniture Market strengthens this model, since a USD 2 Million installation sold outright yields 38% to 52% one-time margin. The same install as a 36-month service contract at USD 65,000 to USD 90,000 monthly returns USD 2.34 Million to USD 3.24 Million. Remanufacturing adds a second-cycle margin of 55% to 70%. Therefore, early movers lift service EBITDA margins toward 28% to 38%.
| Opportunity | (~) % Potential CAGR Upside | Geographic Relevance | Execution Window |
|---|---|---|---|
| FF&E-as-a-Service (FFaaS) Operating Lease & Circular Take-Back Subscription Models for Corporate & Hospitality Clients | +1.40% | United States, United Kingdom, Germany, Netherlands, Australia, Singapore, GCC | Medium term (2–4 years) |
| Smart & IoT-Integrated FF&E for Occupancy Sensing, Space Utilisation Analytics & Building Management Integration | +1.00% | United States, Germany, United Kingdom, Japan, Singapore, Australia, GCC | Medium term (2–4 years) |
| Emerging Market Hospitality & Healthcare Infrastructure First-Generation FF&E Localisation & Manufacturing | +0.72% | India, Nigeria, Ethiopia, Vietnam, Indonesia, Saudi Arabia, Egypt, Philippines | Short term (≤ 2 years) |
| Modular & Demountable FF&E Systems for Temporary, Pop-Up & Flexible Use Commercial Spaces | +0.52% | United States, United Kingdom, Germany, Australia, China, GCC, Singapore | Short term (≤ 2 years) |
| Refurbishment & Remanufacturing of Existing FF&E Assets as Circular Revenue Stream for Manufacturers & Dealers | +0.38% | Europe, United States, Australia, Japan, Canada — ESG-mandated procurement environments | Long term (≥ 4 years) |
Key Company Insights
Ashley Furniture Industries, Inc. holds a structural advantage through large-scale vertical manufacturing that lets it serve high-volume hospitality and corporate orders at competitive cost. As per our research, healthcare spending reached about 10% of world GDP, expanding institutional buyers Ashley can target. Its scale limits smaller rivals on price. However, heavy reliance on volume production leaves a gap for tech-enabled and service-based competitors.
Global Furniture Group positions around contract furniture for offices, healthcare, and education, giving it broad institutional reach. The World Bank found urban population reached 57% in 2024, lifting demand for the dense commercial spaces this firm supplies. Its multi-sector catalogue spreads risk across end uses. However, its mid-market focus exposes it to price pressure from both premium brands and low-cost regional makers competing on the same contract tenders.
Key Players
- Ashley Furniture Industries, Inc.
- Global Furniture Group
- Häfele
- Haworth Inc.
- Herman Miller Inc.
- Inter IKEA Systems B.V.
- Kimball International Inc.
- Kinnarps Group
- Steelcase Inc.
- Stryker Corporation
Recent Developments
- December 2025: JasonL acquired the collapsed Gregory Commercial Furniture along with Basset and workstation brands to stabilize stranded FF&E orders and preserve Australian commercial furniture manufacturing capacity.
- November 2025: SoundPro acquired ProAudio.com, expanding its hospitality and commercial AV-furnishings integration capabilities within the FF&E ecosystem for hotels and large venues.
- December 2025: Global hotel FF&E market reports indicated rising investment in smart and modular furniture systems as hotels prioritize faster renovation cycles and digital room integration.
Geopolitical Impact Analysis
According to the WTO, global merchandise trade growth stayed under pressure through 2024, with world goods trade volume rising only about 2.7% after a 1.2% contraction in 2023. FF&E makers rely on cross-border sourcing of wood, metal, and upholstery components, so this volatility raises landed cost. As reported by UNCTAD, container shipping rates spiked over 150% during Red Sea rerouting in early 2024. This means hospitality and healthcare projects with Asian component sourcing face longer lead times and higher freight exposure.
Figures from the IEA show energy prices stayed volatile, with natural gas costs in Europe still running roughly 2 times pre-2021 levels through 2024. Furniture and fixture production consumes heavy energy in metal forming, kiln drying, and finishing, so this pressure lifts factory costs. The World Bank found tariff measures expanded across major economies during 2024, raising input duties on imported components. Consequently, FF&E manufacturers reshore or regionalize production to protect margin and stabilize delivery schedules.
Report Scope
| Report Features | Description |
|---|---|
| Market Value (2025) | USD 183.1 Billion |
| Forecast Revenue (2035) | USD 312.2 Billion |
| CAGR (2026-2035) | 5.5% |
| Base Year for Estimation | 2025 |
| Historic Period | 2020-2024 |
| Forecast Period | 2026-2035 |
| Report Coverage | Revenue Forecast, Market Dynamics, Market Opportunity Analysis, Technology and Innovation Landscape, Competitive Landscape, Recent Developments |
| Segments Covered | By Product (Furniture, Fixtures, Equipment), By End Use (Hotels & Hospitality, Hospitals & Healthcare Facilities, Corporate/Offices, Retail Spaces, Others) |
| Regional Analysis | North America (US and Canada), Europe (Germany, France, The UK, Spain, Italy, and Rest of Europe), Asia Pacific (China, Japan, South Korea, India, Australia, and Rest of APAC), Latin America (Brazil, Mexico, and Rest of Latin America), Middle East and Africa (GCC, South Africa, and Rest of MEA) |
| Competitive Landscape | Ashley Furniture Industries, Inc., Global Furniture Group, Häfele, Haworth Inc., Herman Miller Inc., Inter IKEA Systems B.V., Kimball International Inc., Kinnarps Group, Steelcase Inc., Stryker Corporation |
| Customization Scope | Customization for segments, region / country-level will be provided. Additional customization can be done based on requirements. |
| Purchase Options | We have three licenses to opt for: Single User License | Multi-User License (Up to 5 Users) | Corporate Use License (Unlimited User and Printable PDF) |





































