


Report Overview
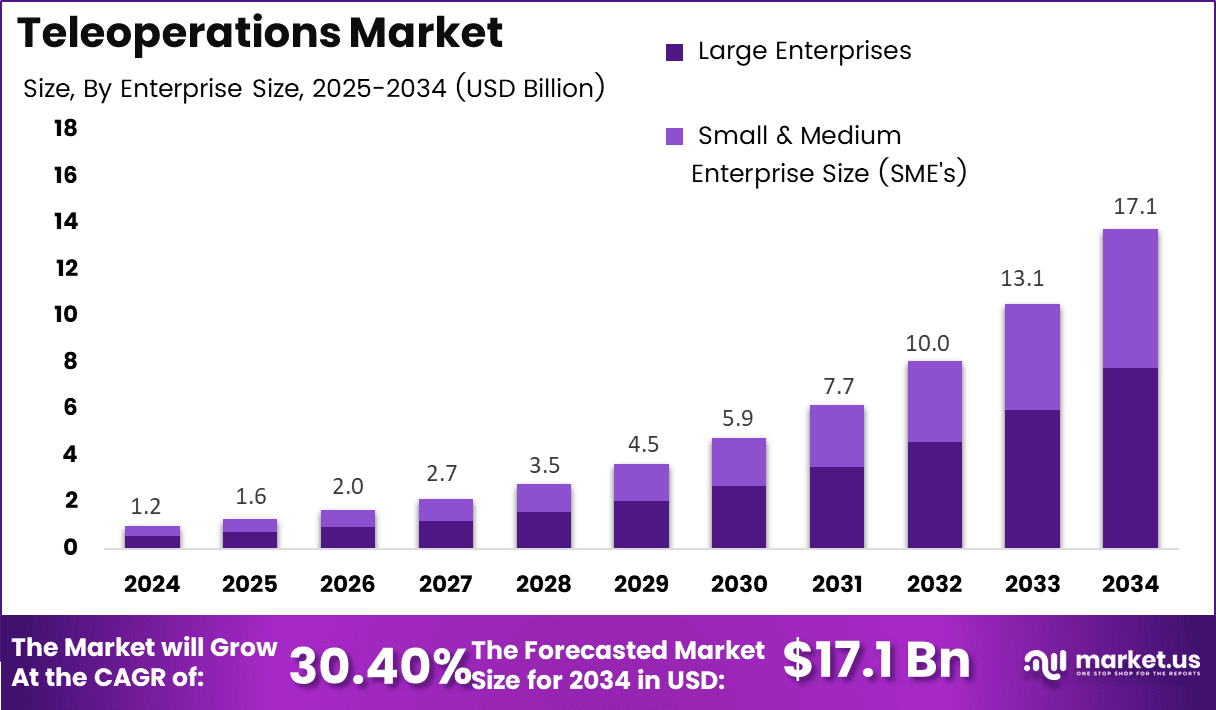
In 2024, the Global Teleoperations Market was valued at USD 1.2 billion. The market is projected to grow at a CAGR of 30.4% during 2025–2034, reaching approximately USD 17.1 billion by 2034. North America dominated the global market in 2024, accounting for the total market share and generating approximately USD 0.38 billion in revenue.
Growth in the teleoperations market is driven by the rising need to supervise robots, vehicles, and machines when full automation cannot safely complete tasks alone. The International Federation of Robotics recorded 542,000 industrial robot installations in 2024, while the global operating stock reached 4.664 million units, up 9% from the previous year.
Transportation and logistics provide another major growth base. U.S. freight activity is expected to reach 28.7 billion tons by 2050, representing a 50% increase from 2020, while freight value could double to USD 36.2 trillion. In 2021, U.S. freight moved at an average rate of 53.6 million tons per day, worth more than USD 54 billion daily, creating strong demand for teleoperations in automated trucks, warehouses, delivery robots, and fleet recovery.
Key Takeaways
- The Global Teleoperations Market was valued at USD 1.2 billion in 2024 and is projected to reach USD 17.1 billion by 2034, growing at a 30.4% CAGR.
- Hardware led the market with a 57.0% share due to the essential role of sensing, control, and display equipment.
- Large Enterprises dominated with a 74.6% share, supported by larger capital budgets and multi-site fleet operations.
- Transportation and Logistics accounted for 30.7% of the market, driven by continuous fleet movement and labor shortages.
- North America dominated the market in 2024, generating approximately USD 0.38 billion in revenue.
Role of Generative AI
Generative AI is transforming the Teleoperations Market by enhancing the capabilities of remote systems. By leveraging machine learning and advanced algorithms, AI enables predictive maintenance, real-time data analysis, and adaptive decision-making, making remote operations more efficient and intelligent.
In industries like healthcare, logistics, and manufacturing, generative AI aids in creating digital twins, optimizing remote control of machinery, and automating tasks. This results in improved operational efficiency, reduced downtime, and enhanced safety. As AI continues to evolve, it is expected to further drive innovation in teleoperation systems, enabling more sophisticated, autonomous, and scalable solutions for businesses worldwide.
By Component
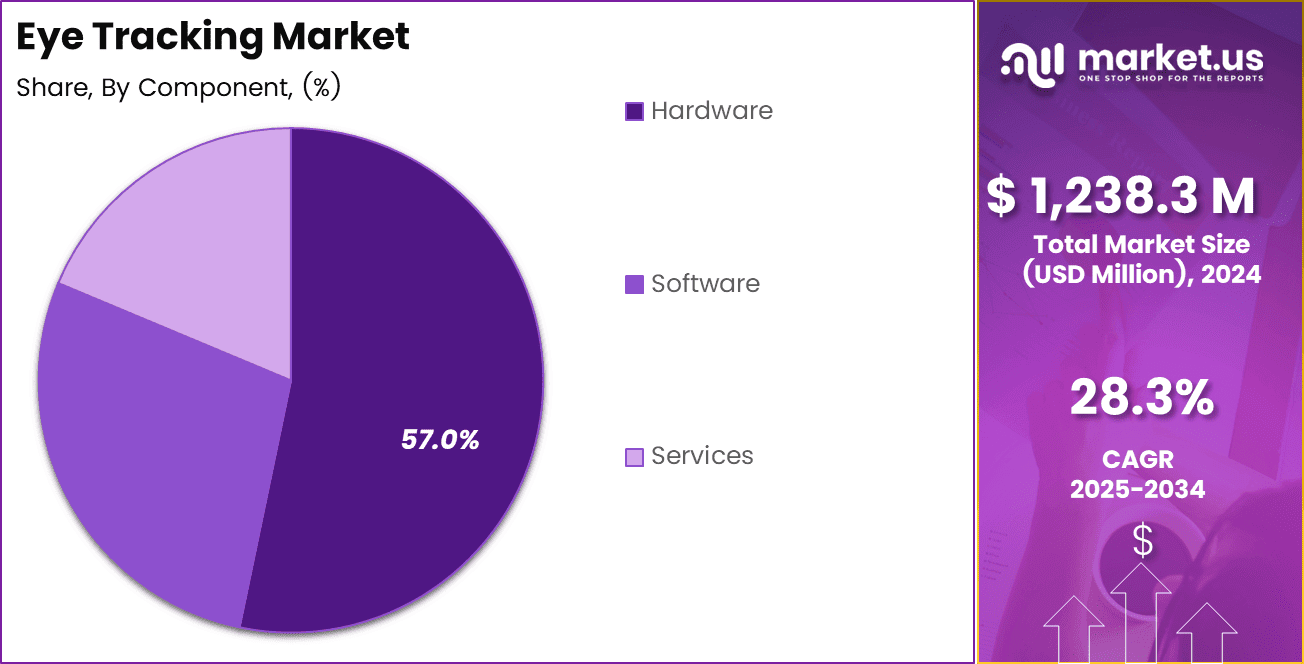
Hardware dominates with 57.0% due to essential sensing, control, and display equipment.
Hardware leads because every teleoperation setup needs physical tools before an operator can control a remote asset. HMD devices give the operator a direct view of the site, while telemanipulator devices turn human hand movements into precise robot actions. Cameras, sensors, control consoles, network units, and safety switches also create a large upfront equipment bill.
The International Federation of Robotics recorded 542,000 industrial robot installations in 2024 and counted 4.664 million industrial robots in use worldwide. These units need hardware for remote checks, manual intervention, and safe control when automation reaches its limit. Teleoperation platforms and software will grow fastest because users want to connect more machines without buying a separate control room for each one.
Cloud tools also let a small operator team support assets across several sites. Global connectivity supports this shift: ITU counted 5.5 billion people online in 2024, while 5G covered 51% of the world population. These links make live video and control more practical. Service demand will also rise, but software creates the fastest path for repeatable fleet growth and lower operating costs.
By Enterprise Size
Large Enterprises dominate with 74.6% due to multi-site fleets and larger capital budgets.
Large enterprises lead because they operate the asset fleets, sites, and safety teams that gain the most from teleoperation. A logistics group can use remote operators across warehouses, yards, and delivery routes. An energy company can use the same control center for distant substations, offshore assets, or high-risk inspection work.
They also face strict uptime and safety needs, which makes remote support a clear business case. The United States had almost 580,000 active motor carriers in June 2025, and 99.3% of them operated 100 or fewer trucks. This structure shows why large fleet owners carry most current spending: they can spread platform and operator costs across many vehicles and daily jobs.
SMEs will grow fastest because lower-cost cloud platforms, rented robots, and managed services reduce the initial barrier. U.S. Census data counted 5.58 million employer firms with fewer than 500 employees in 2023, up from 5.53 million in 2022. Smaller firms can now start with one remote-support use case, measure results, and add users without building a full internal control center.
By Application
Transportation and Logistics dominates with 30.7% due to continuous fleet movement and labor gaps.
Transportation and logistics leads because fleets move assets every day and lose money when vehicles, warehouse robots, or loading equipment stop. Teleoperation lets a skilled worker handle unusual road, yard, loading, or delivery events from a control center instead of sending a person to each location.
Operators can also step in when automated systems face blocked routes, unclear markings, or difficult handovers. U.S. domestic trucks moved an estimated 11.27 billion tons of freight in 2024. They also traveled 329.86 billion miles in 2023. This scale creates a strong need for remote support, better asset use, and shorter recovery time. Healthcare will grow fastest because providers need specialist care beyond major hospitals and increasingly use robotic tools for procedures and support work.
In August 2025, the World Health Organization and the Society of Robotic Surgery launched a joint initiative to expand virtual care and telesurgery. The WHO adopted its Global Strategy on Digital Health in 2020, which gives health systems a clear policy base for digital care planning. Teleoperation can help specialists guide procedures, inspect patients remotely, and support care teams in rural or emergency settings.
Key Market Segments
By Component
- Hardware
- HMD Devices
- Telemanipulator Devices
- Others
- Teleoperation Platform/Software
- Services
- Implementation & Integration Services
- Consulting Services
- Support & Maintenance Services
By Enterprise Size
- Small & Medium Enterprise Size (SME’s)
- Large Enterprises
By Application
- Transportation & Logistics
- Healthcare
- Aerospace & Defence
- Energy & Power
- Agriculture
- Construction & mining
- Others
Investment and Business Benefits
The Teleoperations Market, growing at a projected 21.3% CAGR, offers investors promising returns by capitalizing on the rapid adoption of AI and automation technologies. As companies move toward cybersecurity, investment opportunities in automation-driven systems are expanding. Investors can tap into the growing demand across industries like healthcare, logistics, and manufacturing, benefiting from a market valued at USD 15.2 billion by 2030.
Businesses integrating teleoperation systems can expect up to 30% reductions in labor and operational costs, thanks to enhanced automation. Teleoperations also improve workplace safety, with companies experiencing fewer accidents and hazards. The market’s scalability across industries further offers long-term growth potential, positioning early adopters as leaders.
Regional Analysis
The North American teleoperation market, valued at USD 0.38 billion, commands a leading position in the global landscape, driven by advanced technological infrastructure, substantial R&D investments, and high adoption rates in key sectors like autonomous vehicles, healthcare, manufacturing, and defense.
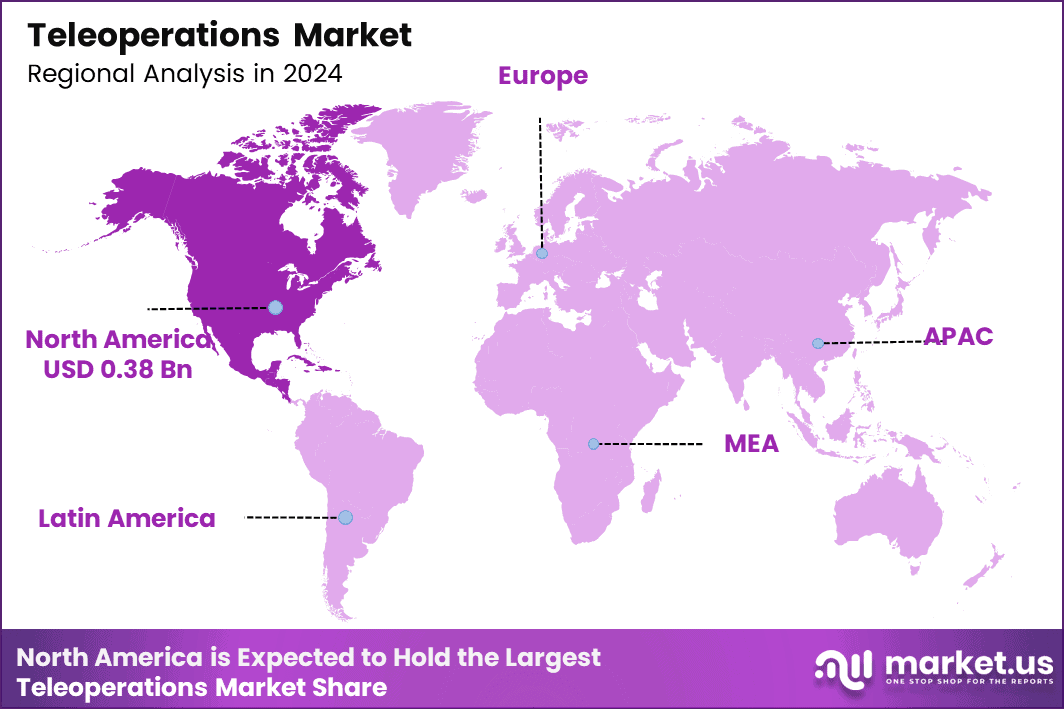
This region’s dominance stems from innovations in AI, 5G connectivity, and robotics, enabling precise remote control in hazardous environments and fostering economic growth through enhanced efficiency and safety. Projections indicate robust expansion, underscoring North America’s pivotal role in shaping the future of remote operations worldwide.
US Market Size
The US Teleoperations market, starting at USD 0.31 billion in 2024, is projected to grow to USD 3.52 billion by 2034, with a CAGR of 27.5%. This upward trend, visualized in a line graph, shows steady increases of USD 0.40 in 2025, USD 1.04 in 2029, and USD 2.76 in 2033, highlighting robust market expansion.
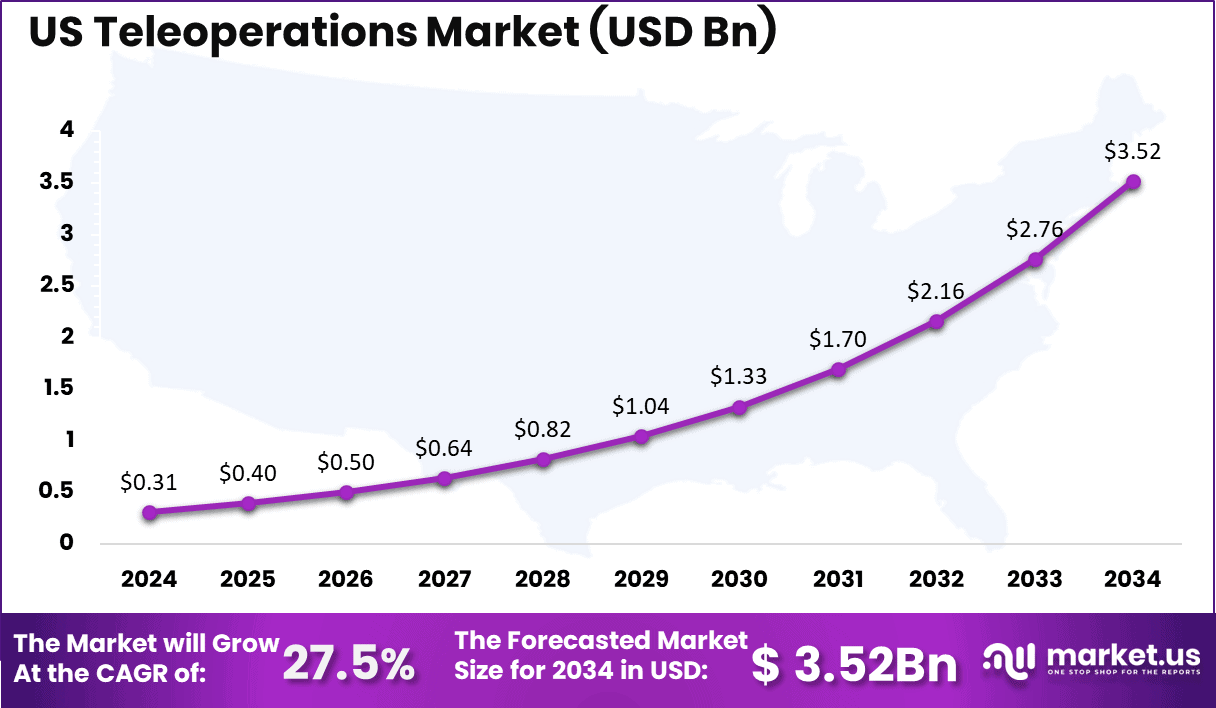
The US Teleoperations market is poised for substantial growth, fueled by rapid technological advancements and rising connectivity needs. As a cornerstone of digital infrastructure, the sector is expected to expand significantly over the decade, driven by innovations and increasing demand across various industries, shaping the future economy.
Key Regions and Countries
- North America
- US
- Canada
- Europe
- Germany
- France
- The UK
- Spain
- Italy
- Rest of Europe
- Asia Pacific
- China
- Japan
- South Korea
- India
- Australia
- Rest of APAC
- Latin America
- Brazil
- Mexico
- Rest of Latin America
- Middle East & Africa
- GCC
- South Africa
- Rest of MEA
Market Dynamics
Drivers
| Driver | (~) % Impact on CAGR Forecast | Geographic Relevance | Impact Timeline |
|---|---|---|---|
| Formal Remote-Driving Authorization | +3.2% | Germany; European Union | Short term (2 years or less) |
| Autonomous Fleet Exception Handling | +2.7% | North America; China; Europe | Short term (2 years or less) |
| Private 5G Edge Deployment | +2.4% | East Asia; Europe; North America | Medium term (2 to 4 years) |
| Industrial Vehicle Automation | +1.9% | Global industrial sites | Medium term (2 to 4 years) |
| Remote Safety Supervision Demand | +1.6% | North America; Europe; Japan | Short term (2 years or less) |
Formal Remote-Driving Authorization
Formal authorization is turning teleoperations from bespoke engineering support into an approved operating model for controlled fleets. Germany’s Road Traffic Remote Control Regulation entered force on December 1, 2025, established a five-year trial framework, limited remotely driven vehicles to 80 km/h, and required both vehicle and operating-area approval.
This approval path can support recurring revenue from operator workstations, fleet-control software, connectivity assurance, compliance records, and managed services. In the U.S., NHTSA’s proposed ADS transparency framework in 2024 also strengthens demand for auditable remote-intervention records. Together, these developments could contribute an estimated +3.2% above the baseline 30.4% CAGR.
Restraints
| Restraint | (~) % Impact on CAGR Forecast | Geographic Relevance | Impact Timeline |
|---|---|---|---|
| High Fleet Retrofit Cost | -3.1% | Global | Short term (2 years or less) |
| Unsettled Liability Allocation | -2.6% | North America; Europe | Medium term (2 to 4 years) |
| Restricted Operating-Domain Approval | -2.2% | Europe; selected Asian markets | Short term (2 years or less) |
| Control-Center Compliance Cost | -1.8% | Global regulated fleets | Medium term (2 to 4 years) |
| Insurance Underwriting Limits | -1.4% | North America; Europe | Medium term (2 to 4 years) |
High Fleet Retrofit Cost
The main near-term restraint is the high upfront investment required for redundant sensors, secure communications, edge computing, vehicle-control interfaces, recording systems, and certified control rooms. The ITU indicates remote-driving applications may require around 5–10 ms end-to-end latency and packet-error performance near 10⁻⁵, while 3GPP specifies up to 100 Mbps, 50 ms latency, and 99.9999% reliability for remote process control.
Meeting these requirements usually needs connectivity and system redundancy beyond standard enterprise networks. Germany’s framework also requires individual vehicle authorization and approved operating areas, increasing compliance-related CapEx and extending customer payback periods. These costs can delay fleet orders and pressure integrator margins, supporting an estimated -3.1% drag on the baseline growth trajectory.
Challenges
| Challenge | (~) % CAGR Friction Drag | Geographic Relevance | Mitigation Horizon |
|---|---|---|---|
| Network Resilience Assurance | -2.8% | Global; rural and tunnel routes | Medium term (2 to 4 years) |
| Cybersecurity Attack Surface | -2.4% | Global | Long term (4 years or more) |
| Operator Workload Calibration | -2.0% | Global | Medium term (2 to 4 years) |
| Vehicle Interface Interoperability | -1.7% | Global multi-OEM fleets | Long term (4 years or more) |
| Video Data Management | -1.3% | Global | Medium term (2 to 4 years) |
Network Resilience Assurance
Teleoperations can operate effectively in controlled environments, but scaling across mixed road networks remains exposed to radio handoffs, congestion, tunnels, weather-related signal loss, and backhaul outages. 3GPP associates remote process control with up to 100 Mbps user-experienced data rates, 50 ms end-to-end latency, and 99.9999% reliability, while the ITU places autonomous-driving connectivity requirements around 5–10 ms end-to-end performance. The FCC’s 5G Fund also reflects continuing rural coverage gaps.
To manage these risks, operators need multi-network failover, local minimum-risk maneuvers, edge processing, route-level connectivity mapping, and continuous service-level monitoring. These requirements raise operating costs and can limit fleet utilization until network resilience and coverage standards become more consistent.
Opportunities
| Opportunity | (~) % Potential CAGR Upside | Geographic Relevance | Execution Window |
|---|---|---|---|
| Multi-Vehicle Tele-Assistance Platforms | +3.6% | North America; Europe; East Asia | Medium term (2 to 4 years) |
| Port and Yard Orchestration | +2.8% | Asia-Pacific; Europe; Middle East | Medium term (2 to 4 years) |
| Mining Fleet Command Services | +2.3% | Australia; Latin America; Africa | Long term (4 years or more) |
| Incident-Recovery Service Contracts | +1.9% | North America; Europe | Medium term (2 to 4 years) |
| Cross-Fleet Command Centers | +1.5% | Global logistics corridors | Long term (4 years or more) |
Multi-Vehicle Tele-Assistance Platforms
If teleoperation platforms shift from dedicated driving to exception-only supervision, labor cost per supervised vehicle could fall by 30–50%. Recurring software, incident-resolution, and compliance services could also improve blended gross margins by around 8–15 percentage points, supporting potential CAGR upside of about +3.6% above the baseline.
Key Player Analysis
The teleoperations market remains fragmented, with Rockwell Automation as the main Tier-1 industrial leader and Boston Dynamics as a major robotics-platform contender. Rockwell reported FY2025 revenue of $8.42 billion and $482 million in R&D spending, equal to 5.7% of sales.
Its FY2024 capital expenditure was $141 million, while the company plans about $2 billion of U.S. manufacturing, engineering, and digital infrastructure investment during 2025–2029. Rockwell is estimated to control around 20–30% of the named industrial-automation-adjacent opportunity.
Boston Dynamics benefits from strong backing from Hyundai, which acquired the company in a transaction valuing it at $1.1 billion. Hyundai’s commitment to purchase tens of thousands of Boston Dynamics robots could create a major captive channel for remote supervision, fleet management, and embodied-AI applications.
Among Tier-2 challengers, Formant raised a $21 million Series B in October 2023, following a $6 million seed round and $18 million Series A. Its estimated share of the named-vendor software layer is around 8–12%. Ottopia raised $14.5 million in Series A financing, including a $4 million investment from ComfortDelGro, after an earlier $9 million Hyundai-backed round. Serve Robotics also acquired Phantom Auto and Voysys assets for approximately $5.75 million in 2025.
Neya Systems, Taurob, DriveU, Shadow Robot, and Roboauto remain niche competitors. Neya participated in an Army ATV-S award pool worth $14.8 million across 3 vendors and has received around $9.1 million in historical SBIR investment. DriveU has disclosed $4 million in financing, while Taurob continues to strengthen its industrial inspection position through strategic investment and joint-development programs.
Top Key Players
- Ottopia Technologies, Ltd.
- Voysys
- Formant
- Shadow Robot Company
- Neya Systems
- Boston Dynamics
- Taurob GmbH
- Rockwell Automation, Inc.
- Driveu Tech LTD.
- Roboauto
- Others
Recent Development
- In January 2026, Boston Dynamics and Hyundai introduced a productized electric Atlas humanoid and announced the 2026 opening of the Robot Metaplant Application Center (RMAC). Boston Dynamics reported more than 500 robots deployed in 2025 and approximately $130 million of revenue from Spot and Stretch; all Atlas units allocated for 2026 were committed to RMAC and Google DeepMind.
- In January 2025, Vay announced expansion of its Las Vegas remotely driven car-sharing operation to 100 electric vehicles by year-end. The commercial scaling program extends a fleet in which human teledrivers remotely deliver Kia e‑Niro vehicles to customers and retrieve them after trips; Vay subsequently reported nearly 100 fleet vehicles and more than 30,000 rides by December 2025.
Report Scope
| Report Features | Description |
|---|---|
| Market Value (2024) | USD 1.2 Bn |
| Forecast Revenue (2034) | USD 17.1 Bn |
| CAGR(2025-2034) | 30.4% |
| Base Year for Estimation | 2024 |
| Historic Period | 2020-2023 |
| Forecast Period | 2025-2034 |
| Report Coverage | Revenue forecast, AI impact on Market trends, Share Insights, Company ranking, competitive landscape, Recent Developments, Market Dynamics, and Emerging Trends |
| Segments Covered | By Component (Hardware, [HMD Devices, Telemanipulator Devices, Others], Teleoperation Platform/Software, Services, [Implementation & Integration Services, Consulting Services, Support & Maintenance Services]), By Enterprise Size (Small & Medium Enterprise Size (SME’s), Large Enterprises), By Application (Transportation & Logistics, Healthcare, Aerospace & Defence, Energy & Power, Agriculture, Construction & mining, Others) |
| Regional Analysis | North America – US, Canada; Europe – Germany, France, The UK, Spain, Italy, Russia, Netherlands, Rest of Europe; Asia Pacific – China, Japan, South Korea, India, New Zealand, Singapore, Thailand, Vietnam, Rest of Latin America; Latin America – Brazil, Mexico, Rest of Latin America; Middle East & Africa – South Africa, Saudi Arabia, UAE, Rest of MEA |
| Competitive Landscape | Ottopia Technologies, Ltd., Voysys, Formant, Shadow Robot Company, Neya Systems, Boston Dynamics, Taurob GmbH, Rockwell Automation, Inc., Driveu Tech LTD., Roboauto, Others |
| Customization Scope | Customization for segments, region/country-level will be provided. Moreover, additional customization can be done based on the requirements. |
| Purchase Options | We have three licenses to choose from: Single User License, Multi-User License (Up to 5 Users), Corporate Use License (Unlimited Users, Printable PDF) |





























