


Report Overview
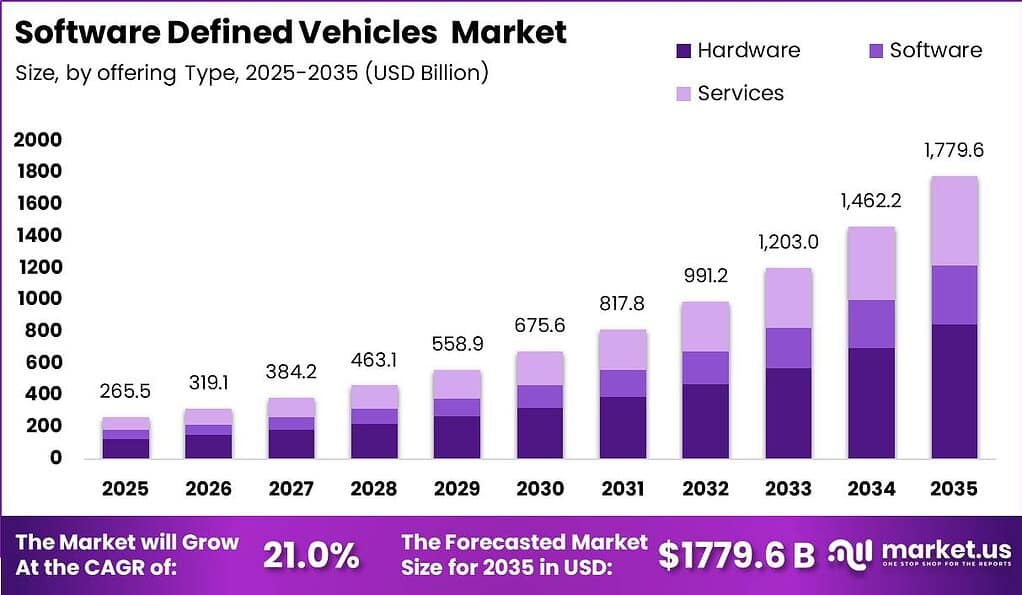
Global Software Defined Vehicles Market size is expected to be worth around USD 1,779.60 Billion by 2035 from USD 265.50 Billion in 2025, growing at a CAGR of 21.0% during the forecast period 2026 to 2035. This scale signals a structural market shift, not a product cycle, demanding immediate strategic attention from OEMs, Tier 1 suppliers, and software investors alike.
The Software Defined Vehicles Market covers vehicles where software controls core functions including powertrain, chassis, safety, and infotainment through centralized compute architectures. This replaces legacy distributed electronic control unit networks with consolidated domain or zonal controllers, enabling post-sale feature deployment and recurring digital revenue streams across the vehicle ownership lifecycle.
Key Takeaways
- Market size in 2025: USD 265.50 Billion
- Market forecast in 2035: USD 1,779.60 Billion
- CAGR (2026 to 2035): 21.0%
- Dominant Offering segment: Software with 47.7% share
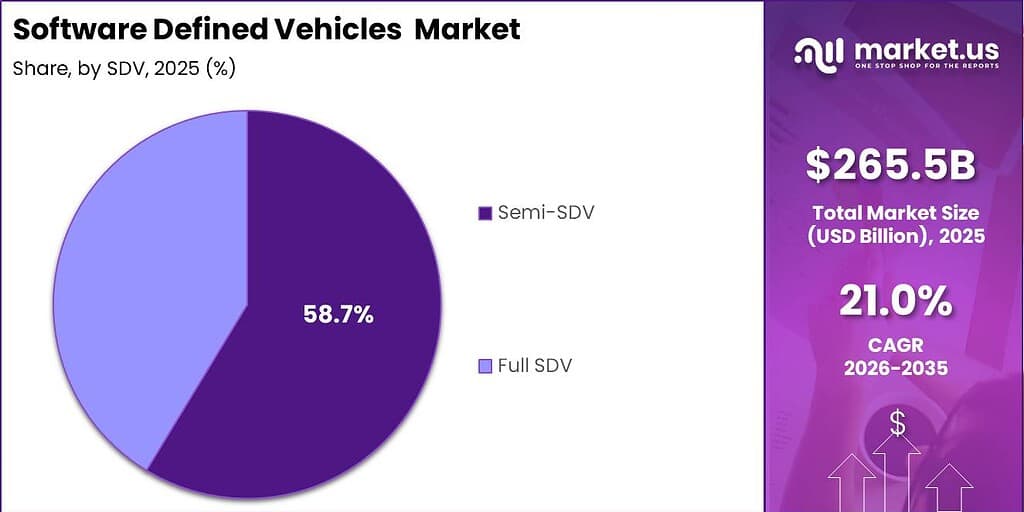
- Dominant SDV Type segment: Semi-SDV with 58.7% share
- Dominant Level of Autonomy segment: Level 2 to 3 (ADAS / Partial Automation) with 60.2% share
- Dominant Vehicle Type segment: Passenger Vehicles with 55.6% share
- Dominant Application segment: ADAS and Safety with 34.5% share
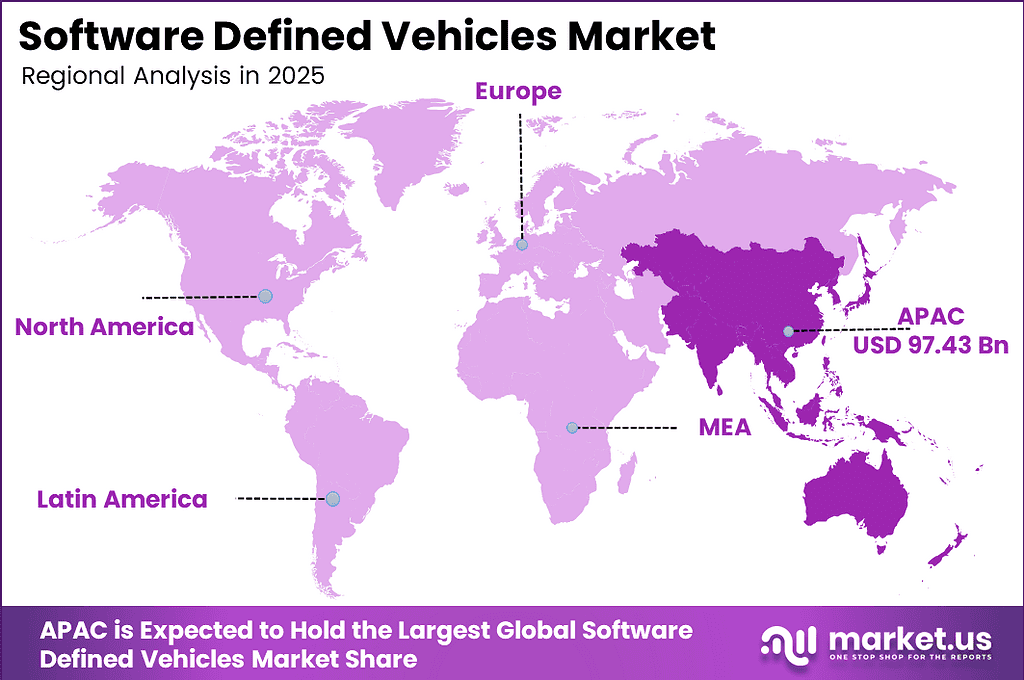
- Dominant Region: Asia Pacific with 36.7% share, valued at USD 97.43 Billion
Government bodies and international regulators are accelerating SDV adoption through formal compliance mandates. As reported by Bosch Mobility, its vehicle connectivity platform delivers OTA software updates, remote diagnostics, and remote function activation while meeting UNECE R155 and R156 requirements. These regulations convert cybersecurity and update governance from optional features into market entry prerequisites, raising the compliance floor for all OEM participants globally.
Consumer awareness of SDVs remains a near-term commercial constraint that the industry must overcome. Bosch data shows awareness of software-defined vehicles sat just under 20% among survey respondents in 2025. However, the same survey found approximately 75% of respondents reported positive expectations after learning about SDV capabilities. This conversion gap between unaided awareness and informed enthusiasm confirms that structured consumer education will directly expand the addressable market for early-moving OEMs.
In January 2026, Qualcomm and Google expanded their decade-long collaboration to accelerate AI-powered software-defined vehicles through Google Cloud integration and generative AI capabilities. This partnership reflects a broader industry pattern where cloud and semiconductor leaders embed themselves into the SDV stack, compressing the timeline for AI feature deployment. OEMs that secure platform partnerships early will hold software integration advantages that late movers cannot quickly replicate.
Offering Analysis
Software dominates with 47.7% due to centralized compute replacing distributed ECUs.
In 2025, Software held a dominant market position in the By Offering segment of the Software Defined Vehicles Market, with a 47.7% share. According to UNIDO industrial output tracking, automotive software content per vehicle has expanded continuously as OEMs consolidate electronic control functions onto fewer, more powerful domain controllers. This concentration of software spend creates high switching costs for OEMs once a software platform is selected, locking in vendor relationships across multi-year vehicle programs.
Hardware underpins every software-defined vehicle architecture and commands a structurally necessary position in the market. ITU data on semiconductor deployment in connected vehicles confirms that compute-capable hardware shipments to the automotive sector have grown consistently as zonal and domain controller architectures replace legacy ECU networks. OEMs that secure preferred hardware supply agreements early gain a deployment speed advantage, since hardware qualification cycles in automotive programs typically span two to four years.
Services represent the fastest-expanding revenue layer as OEMs shift toward post-sale monetization models. Corporate filings from leading automotive groups confirm growing investment in software-as-a-service delivery models, remote diagnostics, and fleet management platforms. This shift from one-time vehicle sales toward recurring service contracts fundamentally changes OEM revenue recognition timelines, improving cash flow predictability and supporting higher enterprise valuations for software-enabled vehicle brands.
SDV Type Analysis
Semi-SDV dominates with 58.7% due to phased OEM migration from legacy platforms.
In 2025, Semi-SDV held a dominant market position in the By SDV Type segment of the Software Defined Vehicles Market, with a 58.7% share. National automotive registration data from major markets including Germany, the United States, and China confirms that the majority of new vehicles entering service operate on partially centralized architectures, where software controls select domains while mechanical and legacy electronic systems remain. This hybrid configuration reflects OEM capital constraints that prevent full-stack SDV re-architecture across entire model portfolios simultaneously.
Full SDV architecture represents the long-term endpoint for the industry, where all vehicle functions operate under unified software control from a central compute node. Patent database analysis shows a sustained rise in filings covering zonal electrical architecture, vehicle abstraction layers, and hardware-agnostic software frameworks, signaling that Tier 1 suppliers and OEMs are actively building the intellectual property base for full SDV deployment. Investors entering the Full SDV sub-segment now face a longer commercialization horizon but position for disproportionate returns as architecture migration accelerates beyond 2027.
Level of Autonomy Analysis
Level 2 to 3 (ADAS / Partial Automation) dominates with 60.2% due to regulatory-approved feature deployment at scale.
In 2025, Level 2 to 3 (ADAS / Partial Automation) held a dominant market position in the By Level of Autonomy segment of the Software Defined Vehicles Market, with a 60.2% share. Regulatory filings under Euro NCAP and NHTSA safety assessment programs confirm that Level 2 driver assistance systems including adaptive cruise control, lane centering, and automated emergency braking are now standard fitment requirements or strong commercial differentiators across most new vehicle categories. This regulatory pull ensures Level 2 to 3 software demand remains structurally supported across all major OEM markets through the forecast period.
Level 0 to 1 systems covering basic driver assistance such as collision warnings and automatic braking without sustained control represent the installed base of the global vehicle fleet. World Bank vehicle registration data confirms that the majority of vehicles currently in global operation carry no autonomy beyond Level 1, creating a large retrofit and upgrade addressable market as connectivity hardware becomes more affordable. Suppliers offering modular ADAS upgrade kits compatible with existing vehicle architectures are positioned to capture this installed-base opportunity ahead of OEM-led replacement cycles.
Level 4 to 5 high and full automation systems remain confined to geo-fenced commercial deployments including robotaxi fleets and port logistics vehicles. Corporate filings from active robo-mobility operators confirm that commercial operations are expanding in defined urban zones across the United States, China, and select European cities. This controlled expansion creates a proving ground that generates real-world safety data, which regulators in Europe and North America require before broader public-road certification can proceed.
Vehicle Type Analysis
Passenger Vehicles dominates with 55.6% due to mass-market OEM software platform investment.
In 2025, Passenger Vehicles held a dominant market position in the By Vehicle Type segment of the Software Defined Vehicles Market, with a 55.6% share. UN Comtrade trade data confirms that passenger vehicle production volumes across the top five manufacturing countries exceeded 60 million units in the most recent annual reporting period, providing the volume base that justifies large-scale software platform investment by OEMs. The mass production scale of passenger vehicles allows software development costs to be amortized across far larger unit counts than commercial vehicle programs, accelerating the return on SDV architecture investment.
Light Commercial Vehicles represent a high-priority segment for SDV adoption given the fleet-managed nature of their operations. ITC Trade Map data on light commercial vehicle shipments confirms growing import activity in markets with expanding last-mile logistics infrastructure, particularly across South and Southeast Asia. Fleet operators managing large numbers of light commercial vehicles gain direct cost advantages from predictive maintenance and remote diagnostics software, creating a commercially motivated pull for SDV features that accelerates adoption independently of consumer preference dynamics.
Heavy Commercial Vehicles present a distinct SDV adoption pathway driven by total cost of ownership reduction rather than feature enrichment. UNIDO manufacturing and freight output data confirms that heavy vehicle utilization rates make fuel efficiency software and predictive maintenance platforms economically compelling for fleet operators. Uptime improvement of even a fraction of a percentage point translates into material cost savings at scale, making the business case for SDV investment in heavy commercial fleets straightforward for logistics and transport operators.
Application Analysis
ADAS and Safety dominates with 34.5% due to global regulatory mandates driving standard fitment.
In 2025, ADAS and Safety held a dominant market position in the By Application segment of the Software Defined Vehicles Market, with a 34.5% share. Regulatory filings from UNECE and NHTSA confirm that automated emergency braking and lane departure warning systems are now mandatory fitment requirements across new vehicle type approvals in the European Union and the United States. This compliance-driven demand floor insulates the ADAS and Safety application segment from cyclical consumer spending fluctuations, making it the most defensible revenue category within the SDV application stack.
Powertrain and Energy management software including EV energy optimization platforms occupies a structurally critical position as electric vehicle penetration accelerates globally. IEA electric vehicle deployment data confirms that battery electric vehicle sales have grown in consecutive years across all major markets, expanding the installed base that requires software-controlled energy and thermal management systems. Every additional EV unit registered expands the addressable fleet for powertrain software update services, creating a compounding demand base for OEMs and Tier 1 software vendors.
Infotainment and Connectivity platforms represent the most visible SDV touchpoint for consumers and carry significant influence over vehicle purchase decisions. ITU data on in-vehicle connectivity adoption confirms that connected infotainment systems are now standard across new vehicle categories in North America, Europe, and China. Autonomous Driving Functions and Body, Comfort, V2X and Others complete the application stack, with autonomous functions capturing fleet and mobility operator budgets while body and comfort software generates incremental revenue through post-sale feature activation.
Key Market Segments
By Offering
- Software
- Hardware
- Services
By SDV Type
- Semi-SDV
- Full SDV
By Level of Autonomy
- Level 2 to 3 (ADAS / Partial Automation)
- Level 0 to 1 (Basic Assistance)
- Level 4 to 5 (High / Full Automation)
By Vehicle Type
- Passenger Vehicles
- Light Commercial Vehicles
- Heavy Commercial Vehicle
By Application
- ADAS and Safety
- Powertrain and Energy / EV Management
- Infotainment and Connectivity
- Autonomous Driving Functions
- Body, Comfort, V2X and Others
Regional Analysis
Asia Pacific Dominates the Software Defined Vehicles Market with a Market Share of 36.7%, Valued at USD 97.43 Billion
Asia Pacific commands the largest regional position in the Software Defined Vehicles Market, holding 36.7% share valued at USD 97.43 Billion. The International Energy Agency identifies electric vehicles as the leading platform accelerating SDV adoption through centralized software control, and China leads global EV production by a substantial margin. This alignment between EV penetration and SDV architecture adoption concentrates the highest near-term software deployment opportunity within the Asia Pacific region, making it the primary battleground for platform market share.
North America represents the fastest-scaling region for SDV software revenue, anchored by a mature connected vehicle regulatory environment and concentrated presence of software-native automotive competitors. The region benefits from established cloud infrastructure partnerships between major technology companies and automotive OEMs, enabling faster OTA update deployment cycles than markets still building regulatory frameworks. Investors targeting North America gain exposure to the segment with the highest average software revenue per vehicle, driven by consumer willingness to pay for subscription feature unlocks.
Europe holds the third major regional position, shaped primarily by stringent regulatory requirements under UNECE WP.29 that mandate cybersecurity and software update management systems for all new vehicle type approvals. Latin America and the Middle East and Africa regions represent earlier-stage SDV markets where platform localization and connectivity infrastructure investment will determine the pace of adoption over the forecast period.
Key Regions and Countries
North America
- US
- Canada
Europe
- Germany
- France
- The UK
- Spain
- Italy
- Rest of Europe
Asia Pacific
- China
- Japan
- South Korea
- India
- Australia
- Rest of APAC
Latin America
- Brazil
- Mexico
- Rest of Latin America
Middle East and Africa
- GCC
- South Africa
- Rest of MEA
Market Dynamics
Market Opportunity Analysis - Underexploited segments and regions offer high-margin entry points for software-native challengers
Full SDV architecture remains a largely uncaptured segment despite representing the industry’s long-term structural endpoint. Most OEM capital today flows into Semi-SDV platforms, which hold 58.7% of the current market, leaving the Full SDV sub-segment with relatively few scaled competitors. New entrants offering full-stack software abstraction layers and hardware-agnostic vehicle operating platforms can establish IP and customer relationships now, before the migration from Semi-SDV accelerates and incumbents consolidate control over the architecture transition.
Level 4 to 5 autonomous driving applications remain confined to geo-fenced commercial deployments, creating a defined, lower-risk entry environment compared to public-road markets. Robotaxi operators, port logistics platforms, and campus mobility services represent a commercially addressable base where safety certification requirements are more contained. This signals that software vendors with validated autonomy stacks in controlled environments can generate real-world performance data and regulatory credibility ahead of broader public-road certification windows opening later in the forecast period.
Emerging-market SDV platform localization carries a potential +1.2% CAGR upside across India, Southeast Asia, and Latin America, yet these regions remain underpenetrated by global SDV platform vendors. The addressable fleet in these markets is large and growing, while local software compliance requirements differ from European and North American frameworks. This creates a structural gap where localized platform providers can compete without facing the full regulatory and certification burden that constrains entry into mature markets.
The Services sub-segment within the Offering category represents an underutilized revenue layer compared to its long-term potential. OEMs currently generate the majority of software revenue through upfront hardware-bundled sales rather than recurring service contracts. By contrast, firms that build fleet management, remote diagnostics, and predictive maintenance service layers on top of existing connected vehicle infrastructure can generate recurring revenue at margins structurally above hardware sales, capturing value from an installed base that already exists without requiring new vehicle sales.
Technology and Innovation Landscape - OTA platforms, AI compute integration, and open software ecosystems redefine the SDV competitive stack
Over-the-air software update technology is the foundational capability that converts a static vehicle into a continuously improving digital product. As stated by Bosch, OTA technology eliminates costly recall actions and reduces repair shop visits through secure firmware and software updates. This capability allows manufacturers to activate new vehicle functions after purchase without replacing vehicle hardware, fundamentally extending the commercial life of each vehicle unit and enabling OEMs to compete on post-sale software quality rather than hardware specification alone.
Automotive manufacturers are adopting Android Automotive OS and open software ecosystems as a strategic response to the fragmented operating system landscape that currently drags -1.2% off the market’s potential CAGR. Open platform standardization reduces per-OEM development cost by enabling shared app ecosystems and third-party developer networks. This signals that the competitive advantage in SDV software will shift from proprietary OS ownership toward the quality of AI applications and services built on top of standardized platforms.
Generative AI copilots are being embedded into in-vehicle infotainment and driver assistance platforms, reflecting a direct application of large language model technology to the vehicle user experience. This innovation layer sits on top of existing SDV compute infrastructure, meaning OEMs with already-centralized domain controller architectures can deploy AI features faster than those still operating distributed ECU networks. The speed advantage compounds across model years, widening the software capability gap between architecture-modern and architecture-legacy OEMs.
Strategic collaborations between automakers and semiconductor companies for SDV compute platforms represent the defining innovation pattern of the current market period. Vehicle software decoupling from hardware now enables continuous feature releases throughout the ownership lifecycle, and the compute silicon underpinning this capability requires deep co-engineering between chip designers and vehicle software architects. OEMs that secure exclusive or preferred semiconductor partnerships gain a feature velocity advantage that cannot be matched by competitors relying on commodity compute components.
Drivers
OTA update commercialization is the single most consequential shift reshaping SDV business models, contributing an estimated +3.4% incremental lift to the baseline CAGR. As reported by Bosch Mobility, OTA updates eliminate workshop visits by installing software directly in vehicles while helping manufacturers comply with UNECE R156 software update regulations. This converts each connected vehicle into a recurring revenue node, shifting OEM economics from one-time hardware sales toward high-margin software annuities throughout the vehicle ownership lifecycle.
Zonal and centralized electrical and electronic architecture consolidation adds an estimated +2.6% to the baseline by enabling scalable software monetization across vehicle platforms. ADAS and AI-enabled feature stack integration contributes a further +2.2%, while 5G and vehicle-to-cloud connectivity densification adds +1.5%. Cloud-native CI/CD and virtual validation adoption by OEMs contributes +1.3%, and commercial fleet software demand adds +1.1%. This layered driver structure means the market’s growth is distributed across multiple reinforcing forces rather than dependent on any single catalyst.
| Driver | (~) % Impact on CAGR Forecast | Geographic Relevance | Impact Timeline |
|---|---|---|---|
| Over-the-air update commercialization and recurring feature unlocks | +3.4% | North America, Europe, China | Short term (2 years or less) |
| Zonal and centralized E/E architecture consolidation | +2.6% | Europe, North America, Japan, South Korea | Medium term (2 to 4 years) |
| ADAS and AI-enabled feature stack integration | +2.2% | Global | Medium term (2 to 4 years) |
| 5G and vehicle-to-cloud connectivity densification | +1.5% | China, North America, Western Europe | Medium term (2 to 4 years) |
| Cloud-native CI/CD and virtual validation adoption by OEMs | +1.3% | Europe, North America, India (engineering hubs) | Short term (2 years or less) |
| Commercial fleet and logistics vehicle software demand | +1.1% | North America, Europe, China | Medium term (2 to 4 years) |
Restraints
Elevated interest rates represent the most immediate structural brake on SDV investment, deducting an estimated -2.4% from the baseline CAGR. SDV re-architecture demands substantial upfront cloud-tooling, CI/CD, and validation outlays whose returns accrue only across a 4 to 6 year horizon. When capital costs rise, finance committees defer these programs, while higher consumer financing costs simultaneously slow fleet turnover and shrink the connected installed base that generates software revenue.
UNECE Regulation No. 155 requires vehicle manufacturers to implement certified cyber security management systems before vehicle type approval, adding mandatory compliance costs that suppress margin across all OEM tiers. This regulatory burden deducts an estimated -1.3% from the CAGR baseline, concentrated in Europe, Japan, and South Korea where type-approval frameworks are most stringent. Consumer resistance to subscription-gated features adds a further -1.6% drag, while sporadic advanced-node semiconductor supply tightness and cross-border data localization restrictions collectively constrain deployment timelines across global markets.
| Restraint | (~) % Impact on CAGR Forecast | Geographic Relevance | Impact Timeline |
|---|---|---|---|
| Elevated interest rates constraining OEM software CapEx | -2.4% | North America, Europe | Short term (2 years or less) |
| Sporadic advanced-node semiconductor supply tightness | -1.9% | Global | Medium term (2 to 4 years) |
| Consumer resistance to subscription-gated features | -1.6% | North America, Europe | Short term (2 years or less) |
| Mandatory cybersecurity type-approval compliance cost | -1.3% | Europe, Japan, South Korea | Short term (2 years or less) |
| Cross-border data localization and transfer restrictions | -1.1% | China, EU | Medium term (2 to 4 years) |
Challenges
The structural scarcity of automotive-grade software engineering talent drags an estimated -2.1% off the market’s maximum potential CAGR. Workforce assessments point to a global automotive skilled-worker shortfall of roughly 2.3 million by 2025 and a composite smart-car manufacturing gap near 37,000 specialized professionals. This talent deficit inflates per-feature development costs and delays release cadence, creating a direct revenue opportunity for firms offering software engineering outsourcing, hardware-in-the-loop tooling, and automated CI/CD platforms to constrained OEM teams.
Legacy supplier integration complexity removes an estimated -1.5% from the baseline, while software validation and safety certification drag contributes a further -1.4%. Fragmented operating system standards create a -1.2% friction drag across global programs, and ongoing fleet cybersecurity incident response suppresses a final -1.0% of potential. Each of these friction points opens a distinct service market for specialist vendors offering integration middleware, automated safety verification tools, OS consolidation platforms, and managed security operations for connected fleets.
| Challenge | (~) % CAGR Friction Drag | Geographic Relevance | Mitigation Horizon |
|---|---|---|---|
| Embedded software talent deficit | -2.1% | Europe, North America, Japan | Long term (4 years or more) |
| Legacy supplier integration complexity | -1.5% | Global | Medium term (2 to 4 years) |
| Software validation and safety certification drag | -1.4% | Europe, North America | Medium term (2 to 4 years) |
| Fragmented operating system standards | -1.2% | Global | Long term (4 years or more) |
| Ongoing fleet cybersecurity incident response | -1.0% | Global | Long term (4 years or more) |
Opportunities
Usage-based insurance and telematics revenue sharing represents genuine white space that could add an estimated +2.3% on top of the baseline CAGR if captured. The International Energy Agency states that software-defined vehicles enable continuous OTA feature deployment and subscription-based digital services throughout vehicle ownership, and telematics data monetization extends this revenue logic into the insurance sector. Per-vehicle telematics data carries near-zero marginal delivery cost once connectivity is provisioned, meaning incremental revenue-share flows arrive at structurally high margins without adding to vehicle bill-of-materials cost.
In-vehicle commerce and payments ecosystems could contribute a further +1.8% upside, while predictive maintenance as a service adds +1.5% and EV charging and grid energy optimization services contribute +1.4%. Emerging-market SDV platform localization adds +1.2% across India, Southeast Asia, and Latin America, and anonymized mobility data licensing to third parties rounds out the opportunity stack at +1.0%. Investors who identify and enter these adjacent revenue streams before they are standardized into baseline OEM offerings will capture the highest margin windows in the SDV value chain.
| Opportunity | (~) % Potential CAGR Upside | Geographic Relevance | Execution Window |
|---|---|---|---|
| Usage-based insurance and telematics revenue sharing | +2.3% | North America, Europe, India | Medium term (2 to 4 years) |
| In-vehicle commerce and payments ecosystem | +1.8% | North America, China, Europe | Long term (4 years or more) |
| Predictive maintenance as a service | +1.5% | Global | Medium term (2 to 4 years) |
| EV charging and grid energy optimization services | +1.4% | Europe, North America, China | Long term (4 years or more) |
| Emerging-market SDV platform localization | +1.2% | India, Southeast Asia, Latin America | Long term (4 years or more) |
| Anonymized mobility data licensing to third parties | +1.0% | Global | Long term (4 years or more) |
Key Company Insights
Robert Bosch GmbH has delivered more than 10 million cockpit computers powered by Qualcomm Snapdragon Cockpit Platforms for software-defined vehicles. In April 2026, Bosch and Qualcomm expanded their strategic partnership beyond cockpit computers to include scalable ADAS platforms supporting centralized SDV architectures. This extension positions Bosch across both the infotainment and safety compute stacks, creating a supplier relationship that is structurally difficult for OEMs to unbundle once integrated into a vehicle program.
In March 2026, Hyundai Motor, Kia, and NVIDIA Corporation expanded their strategic partnership to develop next-generation autonomous driving technologies for software-defined vehicles and future mobility platforms. NVIDIA’s strength lies in providing the high-performance compute silicon and software development kits that enable AI-driven autonomy stacks. This deep integration into Hyundai and Kia vehicle programs gives NVIDIA a platform foothold that compounds as those OEMs grow their global EV and SDV deployment volumes across Asia Pacific and beyond.
Key Players
- Tesla
- Toyota Motor Corporation
- Volkswagen Group / CARIAD
- General Motors
- BYD Company Limited
- Hyundai Motor Company / Hyundai Motor Group
- BMW Group
- Mercedes-Benz Group
- Ford Motor Company
- Stellantis
- NVIDIA Corporation
- Qualcomm Technologies Inc.
- Robert Bosch GmbH
- Continental AG
- NIO
Recent Developments
- January 2026: Hyundai Mobis and Qualcomm Technologies signed a comprehensive agreement at CES 2026 to jointly develop next-generation Software-Defined Vehicle and ADAS solutions using the Snapdragon Ride Flex platform.
- January 2026: Volkswagen Group and Qualcomm Technologies signed a Letter of Intent for Snapdragon Digital Chassis solutions to power Volkswagen’s next-generation Software-Defined Vehicle architecture developed with Rivian.
- March 2026: Qualcomm announced its Snapdragon Digital Chassis platform had expanded through new collaborations with major automakers including Volkswagen Group, BMW, Mercedes-Benz, and Toyota to accelerate Software-Defined Vehicle deployment.
Geopolitical Impact Analysis
Trade policy shifts are directly reshaping the cost structure of SDV compute components. According to WTO trade monitoring data, automotive semiconductor tariffs between the United States and key supplier nations have increased by up to 25% on selected product categories since 2023, raising bill-of-materials costs for advanced-node chips essential to domain controllers and ADAS platforms. This means OEMs sourcing high-performance automotive compute silicon through standard global supply chains face margin compression at the component level before a single line of software code is written.
Supply chain rerouting driven by geopolitical tensions between the United States and China is extending automotive component lead times across global OEM programs. Based on World Shipping Council port congestion and transit data, average container transit times on key Asia-to-Europe and Asia-to-North America routes have increased by 15% to 20% compared to pre-disruption baselines. This extends the physical delivery timeline for SDV hardware modules and forces OEMs to carry higher safety stock, increasing working capital requirements and delaying connected vehicle program launch schedules across both mature and emerging markets.
Report Scope
| Report Features | Description |
|---|---|
| Market Value (2025) | USD 265.50 Billion |
| Forecast Revenue (2035) | USD 1,779.60 Billion |
| CAGR (2026-2035) | 21.0% |
| Base Year for Estimation | 2025 |
| Historic Period | 2020-2024 |
| Forecast Period | 2026-2035 |
| Report Coverage | Revenue Forecast, Market Dynamics, Market Opportunity Analysis, Technology and Innovation Landscape, Competitive Landscape, Recent Developments |
| Segments Covered | By Offering (Software, Hardware, Services), By SDV Type (Semi-SDV, Full SDV), By Level of Autonomy (Level 2 to 3 ADAS / Partial Automation, Level 0 to 1 Basic Assistance, Level 4 to 5 High / Full Automation), By Vehicle Type (Passenger Vehicles, Light Commercial Vehicles, Heavy Commercial Vehicle), By Application (ADAS and Safety, Powertrain and Energy / EV Management, Infotainment and Connectivity, Autonomous Driving Functions, Body, Comfort, V2X and Others) |
| Regional Analysis | North America (US and Canada), Europe (Germany, France, The UK, Spain, Italy, and Rest of Europe), Asia Pacific (China, Japan, South Korea, India, Australia, and Rest of APAC), Latin America (Brazil, Mexico, and Rest of Latin America), Middle East and Africa (GCC, South Africa, and Rest of MEA) |
| Competitive Landscape | Tesla, Toyota Motor Corporation, Volkswagen Group / CARIAD, General Motors, BYD Company Limited, Hyundai Motor Company / Hyundai Motor Group, BMW Group, Mercedes-Benz Group, Ford Motor Company, Stellantis, NVIDIA Corporation, Qualcomm Technologies Inc., Robert Bosch GmbH, Continental AG, NIO |
| Customization Scope | Customization for segments, region / country-level will be provided. Additional customization can be done based on requirements. |
| Purchase Options | We have three licenses to opt for: Single User License | Multi-User License (Up to 5 Users) | Corporate Use License (Unlimited User and Printable PDF) |





































