


Report Overview
Global Gaming Console Market size is expected to be worth around USD 41.10 Billion by 2035 from USD 26.50 Billion in 2025, growing at a CAGR of 4.5% during the forecast period 2026 to 2035. This steady expansion signals reliable hardware demand across generations. Investors gain a stable base for long-term platform and content bets.
The Gaming Console Market covers dedicated hardware devices built to run interactive games across home, handheld, and hybrid formats. Manufacturers structure the market around hardware sales, software attach rates, and recurring subscription services. This layered model means device makers earn beyond the first sale. Companies that link hardware to services capture higher lifetime value per user.
Key Takeaways
- Global market value stands at USD 26.50 Billion in 2025 and reaches USD 41.10 Billion by 2035 at a CAGR of 4.5%.
- Home console leads the By Console Type segment with a 45.3% share.
- Gaming applications dominate with a 90.3% share.
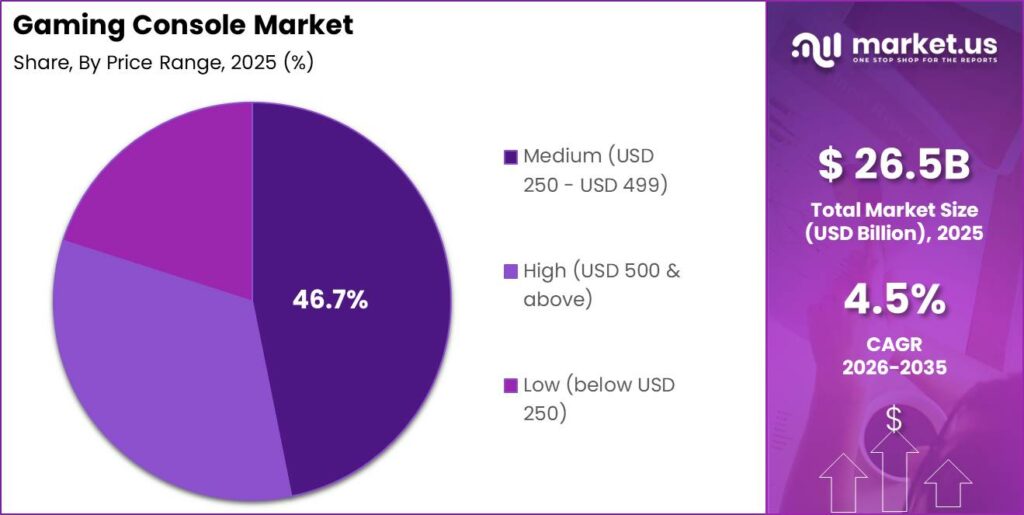
- Medium price range (USD 250 to USD 499) holds 46.7% of demand.
- Residential end users account for 81.2% of the market.
- Online distribution channels capture 52.1% of sales.
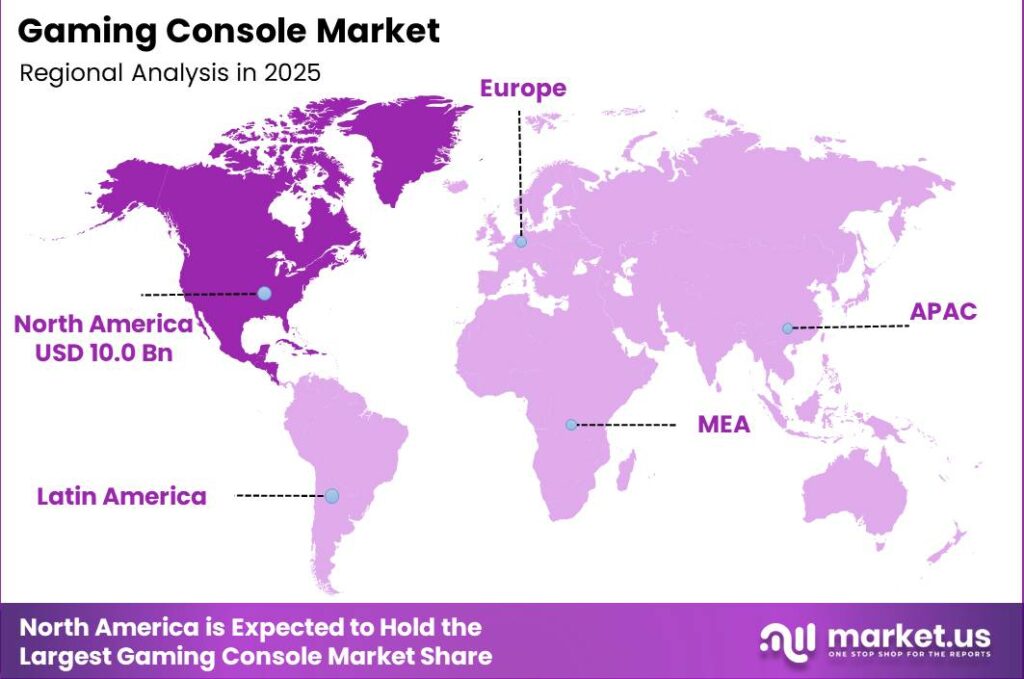
- North America dominates with a 37.8% share, valued at USD 10.00 Billion.
Cloud Gaming adoption now shapes government and platform priorities as regulators review subscription bundling and digital storefront competition. This regulatory attention pushes manufacturers toward transparent pricing models. Sony Interactive Entertainment reported cumulative PlayStation 5 hardware sales above 93 million units as of March 31, 2026. This scale confirms strong demand for high-performance consoles. Vendors building premium graphics hardware gain a defensible installed base. 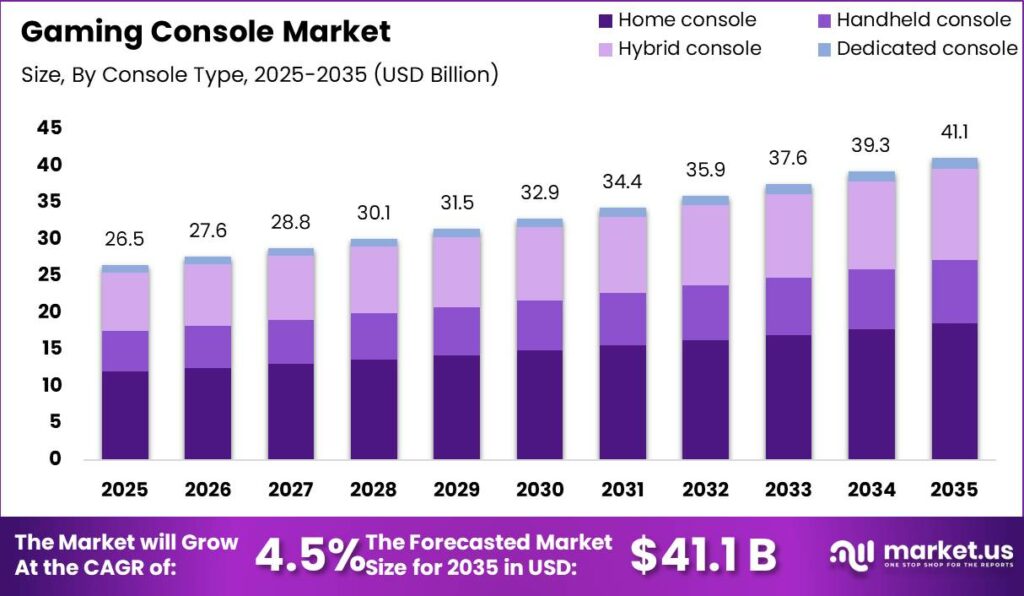
Rising household gaming penetration widens the buyer pool for console makers. The Entertainment Software Association found that 212 million Americans play video games, with 67% playing at least one hour weekly. This mainstream adoption expands the addressable market beyond core gamers. Therefore, companies targeting casual and family segments can grow volume without relying only on enthusiast upgrades.
Console Type Analysis
Home console dominates with 45.3% due to superior graphics and living-room integration.
In 2025, Home console held a dominant market position in the By Console Type segment of Gaming Console Market, with a 45.3% share. Sony Interactive Entertainment confirmed PlayStation 5 lifetime hardware sales above 93 million units by March 31, 2026. This volume anchors developer support around home platforms. As a result, publishers prioritize home consoles first, reinforcing their lead in premium content availability.
Handheld consoles serve mobile-first players who value portability over raw performance. Nintendo reported lifetime Nintendo Switch sales reaching 155.92 million hardware units and 1.528 billion software units by March 31, 2026. This attach ratio shows handheld owners buy many games per device. Therefore, manufacturers can lean on software revenue to offset thinner hardware margins in this format.
Hybrid consoles merge home and portable play into one device, widening use cases. Nintendo launched Nintendo Switch 2 in 2025, and it reached 19.86 million hardware units and 48.71 million software units sold by March 31, 2026. This rapid uptake proves hybrid demand is durable. Companies investing in convertible form factors capture buyers who reject single-mode devices.
Dedicated consoles target focused gaming without media add-ons, appealing to cost-aware buyers. These devices hold the remaining share collectively alongside lower-volume formats. Their simpler bill of materials keeps entry prices low. This creates an opening for vendors to win first-time and emerging-market gamers with affordable, single-purpose hardware.
Application Analysis
Gaming dominates with 90.3% due to core interactive entertainment demand.
In 2025, Gaming held a dominant market position in the By Application segment of Gaming Console Market, with a 90.3% share. Sony reported that digital sales made up roughly 80% of PlayStation full-game sales in fiscal year 2025. This shift confirms gaming demand now flows through digital channels. Publishers gain higher margins as physical distribution costs fall away.
Non-gaming applications cover streaming, media playback, and social features bundled into consoles. Data from the Entertainment Software Association shows 89% of players who play a sport both digitally and in real life said the game improved real-world performance. This crossover value extends console appeal beyond pure play. Manufacturers can market consoles as multi-purpose entertainment hubs to broaden buyer interest.
Non-gaming use also supports retention between major game releases. Console owners who stream video or use fitness and social apps stay engaged with the hardware. This sustained usage lifts subscription attach rates. Therefore, platform holders that expand media functions defend their installed base during content droughts.
Price Range Analysis
Medium range dominates with 46.7% due to balanced price and performance value.
In 2025, Medium (USD 250 to USD 499) held a dominant market position in the By Price Range segment of Gaming Console Market, with a 46.7% share. Electronic Arts reported that digital full-game downloads reached 78% of units sold on Xbox and PlayStation platforms in fiscal year 2025. This digital shift lets mid-tier buyers avoid disc premiums. As a result, the medium band captures value-focused mainstream demand.
Low price consoles below USD 250 attract budget buyers and first-time owners. These devices trade advanced graphics for accessibility and low entry cost. Their affordability drives penetration in price-sensitive households. Therefore, vendors use this tier to build early loyalty before upselling premium hardware later.
High price consoles at USD 500 and above serve enthusiasts demanding top performance. Buyers here accept premium pricing for 4K gaming and advanced features. This group holds the remaining share alongside the low tier collectively. Companies targeting this band earn strong margins but face smaller volume ceilings.
End Users Analysis
Residential dominates with 81.2% due to home-centered gaming habits.
In 2025, Residential held a dominant market position in the By End Users segment of Gaming Console Market, with a 81.2% share. The Entertainment Software Association reported that 75% of American parents play video games weekly, and 81% of them play with their children. This family adoption cements the home as the primary gaming setting. Vendors marketing multiplayer and family titles strengthen residential demand.
Commercial end users include gaming cafes, esports arenas, and hospitality venues that deploy consoles for paying customers. These operators buy in volume and refresh hardware often. Their demand steadies orders between consumer launch cycles. Therefore, manufacturers gain a predictable business channel that smooths seasonal consumer swings.
Broadening age demographics reinforce commercial and residential use alike. ESA data shows the average U.S. gamer age rose to 37 years. This maturity means gaming spans wider household budgets. Companies can price premium hardware and services toward adults with higher disposable income.
Distribution Channel Analysis
Online dominates with 52.1% due to digital storefront convenience and reach.
In 2025, Online held a dominant market position in the By Distribution Channel segment of Gaming Console Market, with a 52.1% share. Electronic Arts reported digital downloads rising from 68% in 2023 to 78% in fiscal year 2025 across major platforms. This move to e-commerce and company websites cuts retail overhead. Vendors capture more margin by selling hardware and software direct.
E-commerce platforms and company websites let makers reach buyers without shelf-space limits. Direct sales also generate first-party customer data. This data sharpens targeted marketing and subscription upsells. Therefore, platform holders who own the sales channel improve both margin and retention.
Offline channels span supermarkets, specialty retail, and other stores that serve buyers who prefer in-person purchase. These outlets remain vital for gifting seasons and first-time buyers seeking guidance. They hold the remaining share collectively. Retailers that bundle accessories at the point of sale defend their role against digital-first competitors.
Key Market Segments
By Console Type
- Home console
- Handheld console
- Hybrid console
- Dedicated console
By Application
- Gaming
- Non-Gaming
By Price Range
- Low (below USD 250)
- Medium (USD 250 – USD 499)
- High (USD 500 & above)
By End Users
- Residential
- Commercial
- Gaming cafes
- Esports arenas
- Hospitality & entertainment
By Distribution Channel
- Online
- E-commerce
- Company websites
- Offline
- Supermarkets/hypermarket
- Specialty retail stores
- Others
Regional Analysis
North America Dominates the Gaming Console Market with a Market Share of 37.8%, Valued at USD 10.00 Billion
North America leads the Gaming Console Market with a 37.8% share worth USD 10.00 Billion in 2025. High household income and deep gaming culture drive this lead. The Entertainment Software Association reported 212 million Americans play video games. This large, engaged base sustains steady hardware and software demand. Vendors prioritizing North America secure the richest per-user spending pool.
Asia Pacific stands as the fastest-growing region as rising incomes expand console access. Strong mobile-first gaming habits now convert into dedicated hardware purchases. Local manufacturing scale also lowers device costs across the region. Therefore, companies expanding entry-tier consoles here can capture rapid new-user growth ahead of saturation.
Europe, Latin America, and the Middle East and Africa together hold the remaining market share. Europe shows mature demand centered on premium hardware and subscriptions. Latin America and MEA offer earlier-stage growth tied to affordability. Vendors tailoring price tiers by region balance premium margin with volume expansion.
Key Regions and Countries
North America
- US
- Canada
Europe
- Germany
- France
- The UK
- Spain
- Italy
- Rest of Europe
Asia Pacific
- China
- Japan
- South Korea
- India
- Australia
- Rest of APAC
Latin America
- Brazil
- Mexico
- Rest of Latin America
Middle East and Africa
- GCC
- South Africa
- Rest of MEA
Market Dynamics
Market Opportunity Analysis - Underserved regions and lower-share segments open clear entry points for new players
Asia Pacific offers the clearest underexploited entry point for console makers. The region ranks as the fastest-growing area yet trails North America’s 37.8% dominant share. This gap signals room for entry-tier hardware before saturation. Therefore, new entrants that price consoles for rising-income buyers can build share ahead of established premium brands.
The handheld console sub-segment remains underexploited against the home console leader at 45.3%. Portable-first buyers value mobility that home devices cannot match. This means a focused handheld strategy avoids direct competition with dominant home platforms. Investors backing portable specialists target demand that larger players address only partially.
The low price tier below USD 250 sits well behind the medium band at 46.7%. Budget buyers and first-time owners cluster in this underserved space. This creates room for affordable devices that build early brand loyalty. As a result, new players can enter through price rather than performance, then upsell later.
The commercial end-user channel remains thin against residential dominance at 81.2%. Gaming cafes, esports arenas, and hospitality venues buy in volume yet receive limited tailored hardware. This gap rewards vendors that design durable, high-usage devices for business buyers. Companies serving commercial operators gain steady orders outside consumer launch cycles.
Technology and Innovation Landscape - AI upscaling, cloud ecosystems, and custom silicon reshape competitive edges
AI-assisted graphics upscaling now defines premium console development. Manufacturers use AI to boost frame rates and image quality without raising raw hardware cost. This lets vendors deliver 4K HDR and ray-tracing experiences at controlled prices. Therefore, companies leading in AI upscaling win performance-focused buyers while protecting margins.
Cloud-connected gaming ecosystems drive deeper subscription engagement. Microsoft reported Xbox Cloud Gaming usage through Game Pass rose 45% year over year, with console players spending 45% more time cloud streaming. This shift moves value toward recurring services. Manufacturers investing in cloud infrastructure lift lifetime revenue per user.
Cloud access is expanding fast across new markets. Xbox Cloud Gaming reached nearly 30 countries, widening console access across many devices. This broader reach reduces reliance on any single hardware sale. As a result, platform holders extend their audience beyond traditional console buyers.
Custom silicon co-engineering now anchors next-generation hardware roadmaps. In 2025, a major platform holder and a chipmaker agreed to co-develop gaming silicon combining CPU and GPU technologies. This partnership secures long-term performance gains and supply control. Therefore, companies locking in custom chip pipelines defend against component volatility and rivals.
Drivers
First-party PC and cross-platform monetization pushes the market forward by extending game revenue beyond single devices. This driver adds an estimated +1.2% to the CAGR forecast across North America and Europe. Publishers earn from one title across console, PC, and cloud. This means sellers recover development costs faster. Investors gain confidence in platforms that spread content across many revenue points.
The next-generation hybrid handheld upgrade cycle lifts demand by resetting replacement economics. The Video Games hardware refresh contributes roughly +1.0% to the global CAGR forecast in the short term. A hybrid console launched in 2025 triggered the first genuine replacement wave since 2017. This shift raised average selling prices by 15% to 20%. Buyers accept higher prices, and vendors lift blended hardware margins as a result.
| Driver | (~) % Impact on CAGR Forecast | Geographic Relevance | Impact Timeline |
|---|---|---|---|
| First-party PC and cross-platform game monetization | +1.2% | North America, Europe | Short term (≤ 2 years) |
| Next-gen hybrid handheld console upgrade cycle | +1.0% | Global | Short term (≤ 2 years) |
| Subscription game-pass attach-rate growth | +0.7% | North America, Europe | Short term (≤ 2 years) |
| Online digital storefront sales mix shift | +0.5% | Global | Short term (≤ 2 years) |
| User-generated content creator economy | +0.4% | North America, Asia Pacific | Medium term (2–4 years) |
Restraints
The memory chip price shock freezes hardware affordability across the market. Beginning in October 2025, DRAM and NAND reallocation toward AI data centers pushed 32GB DDR5 module pricing from about 94 dollars to 127 dollars in one quarter. Prices then surged a further 122% to roughly 282 dollars by early 2026. This forced console makers to raise list prices. Buyers in price-sensitive segments delay purchases, and margins compress.
Repeated console price increases erode demand across North America and Europe. At least two major manufacturers raised list prices 30% to 40% versus year-ago pricing. Overall memory input costs rose an estimated 50% across 2025. This squeezed hardware gross margins by 4% to 6%. Therefore, vendors face frozen unit growth until supply eases through 2027 to 2028.
| Restraint | (~) % Impact on CAGR Forecast | Geographic Relevance | Impact Timeline |
|---|---|---|---|
| DRAM/NAND memory chip price shock | -2.0% | Global | Short term (≤ 2 years) |
| Repeated console price increases eroding demand | -1.0% | North America, Europe | Short term (≤ 2 years) |
| Component allocation prioritization toward AI data centers | -0.7% | Global | Short term (≤ 2 years) |
Challenges
Cloud streaming adoption erodes long-run hardware necessity across North America and Europe. Roughly 60% of surveyed players had tried cloud gaming by late 2025, and 80% of them rated it positively. This durable behavior raises the opportunity cost of buying dedicated hardware. Console makers must fund exclusive content and ecosystem lock-in to defend attach rates. This ongoing spend caps growth by about 0.6% against the baseline.
This challenge opens a new revenue stream for platform holders willing to adapt. Manufacturers can bundle subscription tiers with hardware at an estimated 10% to 15% discount to standalone pricing. This defends casual and mobile-first buyers who might otherwise leave. Therefore, companies that convert streaming interest into subscriptions turn a threat into recurring income.
| Challenge | (~) % CAGR Friction Drag | Geographic Relevance | Mitigation Horizon |
|---|---|---|---|
| Cannibalization from cloud streaming platforms | -0.6% | North America, Europe | Medium term (2–4 years) |
| Lengthening console replacement cycles | -0.5% | Global | Long term (≥ 4 years) |
| Semiconductor fabrication capacity concentration | -0.4% | Asia Pacific | Long term (≥ 4 years) |
Opportunities
Console-branded cloud streaming converts a threat into a native revenue line. Current platform holders license streaming to third parties rather than capturing subscription margin directly. Converting part of the 60% of players who tried cloud gaming into first-party subscriptions at 15 to 20 dollars monthly could lift take-rate margins 8% to 10%. This shifts income toward recurring services. Early movers claim margin before rivals build competing tiers.
Services revenue carries far higher margins than hardware for this market. First-party streaming earns estimated gross margins of 60% to 70% versus 15% to 20% typical of console hardware. This gap rewards manufacturers that build infrastructure now. The shift represents an incremental 0.9% CAGR upside above the baseline. Therefore, investors favor platforms pivoting toward software-services revenue.
| Opportunity | (~) % Potential CAGR Upside | Geographic Relevance | Execution Window |
|---|---|---|---|
| Console-branded cloud-streaming service monetization | +0.9% | Global | Medium term (2–4 years) |
| Emerging-market entry-tier console penetration | +0.6% | Asia Pacific, Latin America | Medium term (2–4 years) |
| In-platform user-generated content monetization tools | +0.5% | North America, Asia Pacific | Long term (≥ 4 years) |
Key Company Insights
Anbernic positions itself around affordable handheld gaming hardware that targets cost-aware and retro-focused buyers. This focus lets it win price-sensitive segments that premium brands overlook. The Entertainment Software Association found 49% of gaming parents believe games teach problem-solving skills. This broad appeal supports low-cost handheld demand. However, thin margins on budget devices leave Anbernic exposed to component cost swings.
ASUSTeK Computer Inc. builds advantage through partnerships that extend gaming beyond traditional consoles into Windows-based handhelds. In 2025, ASUS worked with a major platform holder on portable hardware and multi-device strategies spanning cloud and remote play. This alliance leverages ASUS engineering strength for premium portable devices. However, reliance on a partner ecosystem exposes ASUS to shifts in that partner’s hardware roadmap.
Key Players
- Anbernic
- ASUSTeK Computer Inc.
- Atari, Inc.
- Ayn Technology
- Evercade (Blaze)
- Hyperkin
- Lenovo
- Logitech
- Mad Catz Global Limited
- Microsoft
- Miyoo
- Nintendo
- NVIDIA Corporation
- SEGA
- Sony Interactive Entertainment
- Tencent
Recent Developments
- June 2025: Microsoft and ASUS announced the ROG Xbox Ally and ROG Xbox Ally X handheld devices, extending the Xbox ecosystem into Windows-based portable hardware with holiday 2025 availability.
- June 2025: Microsoft Xbox and AMD announced a multi-year partnership to co-engineer next-generation gaming silicon combining AMD Ryzen and Radeon technologies for future consoles, handhelds, PCs, and cloud platforms.
- July 2025: Sony Group and Bandai Namco Holdings signed a strategic alliance, with Sony acquiring 16 million Bandai Namco shares worth roughly 68 billion yen for about a 2.5% ownership stake.
- December 2025: Sony Interactive Entertainment announced the DualSense Wireless Controller Genshin Impact Limited Edition for PlayStation 5, with pre-orders from December 11, 2025, and regional launches beginning January 2026.
- 2026: Microsoft announced a major Xbox restructuring involving roughly 4,800 job reductions globally, including about 3,200 gaming roles, as it adjusted its Xbox business strategy.
Geopolitical Impact Analysis
According to the WTO, tariff escalation between major economies now raises console component costs directly. Recent measures pushed duties on some electronics inputs above 25%, while semiconductor-related tariffs in select categories reached 50%. Consoles depend on chips and memory sourced across Asia Pacific supply chains. This means assemblers face higher landed costs. Manufacturers pass part of this burden into retail pricing, cooling demand in cost-sensitive markets.
Based on IEA data, energy volatility and shipping disruption add further pressure to console logistics. Freight rerouting around conflict zones has lengthened some transit times by 10 to 14 days, while energy price swings above 20% raise factory and transport costs. Consoles ship as bulky, high-value units sensitive to freight expense. Therefore, makers diversify assembly locations and pre-stock inventory to protect launch-window availability.
Report Scope
| Report Features | Description |
|---|---|
| Market Value (2025) | USD 26.50 Billion |
| Forecast Revenue (2035) | USD 41.10 Billion |
| CAGR (2026-2035) | 4.5% |
| Base Year for Estimation | 2025 |
| Historic Period | 2020-2024 |
| Forecast Period | 2026-2035 |
| Report Coverage | Revenue Forecast, Market Dynamics, Market Opportunity Analysis, Technology and Innovation Landscape, Competitive Landscape, Recent Developments |
| Segments Covered | By Console Type (Home console, Handheld console, Hybrid console, Dedicated console), By Application (Gaming, Non-Gaming), By Price Range (Low below USD 250, Medium USD 250 to USD 499, High USD 500 and above), By End Users (Residential, Commercial including Gaming cafes, Esports arenas, Hospitality and entertainment), By Distribution Channel (Online including E-commerce and Company websites, Offline including Supermarkets/hypermarket, Specialty retail stores, Others) |
| Regional Analysis | North America (US and Canada), Europe (Germany, France, The UK, Spain, Italy, and Rest of Europe), Asia Pacific (China, Japan, South Korea, India, Australia, and Rest of APAC), Latin America (Brazil, Mexico, and Rest of Latin America), Middle East and Africa (GCC, South Africa, and Rest of MEA) |
| Competitive Landscape | Anbernic, ASUSTeK Computer Inc., Atari, Inc., Ayn Technology, Evercade (Blaze), Hyperkin, Lenovo, Logitech, Mad Catz Global Limited, Microsoft, Miyoo, Nintendo, NVIDIA Corporation, SEGA, Sony Interactive Entertainment, Tencent |
| Customization Scope | Customization for segments, region / country-level will be provided. Additional customization can be done based on requirements. |
| Purchase Options | We have three licenses to opt for: Single User License | Multi-User License (Up to 5 Users) | Corporate Use License (Unlimited User and Printable PDF) |





































