
Quick Navigation
Report Overview
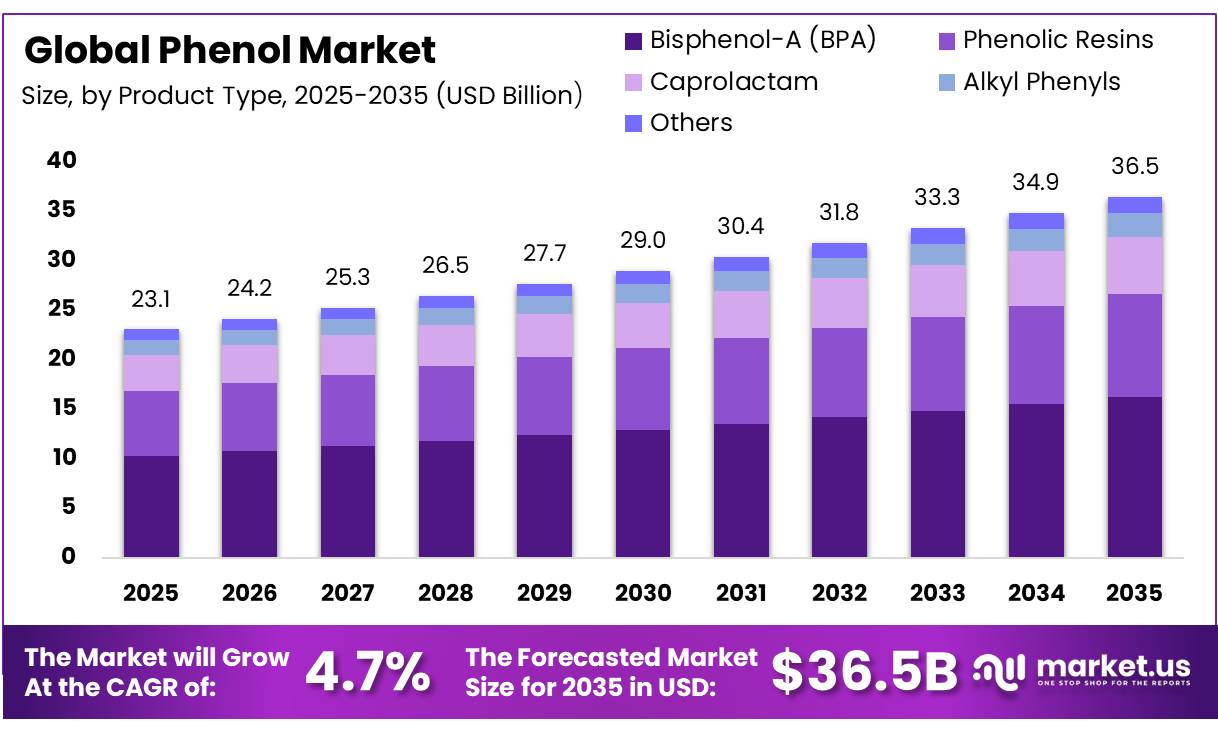
In 2025, the Global Phenol Market was valued at US$23.1 billion, and between 2026 and 2035, this market is estimated to register a CAGR of 4.7%, reaching about US$36.5 billion by 2035.
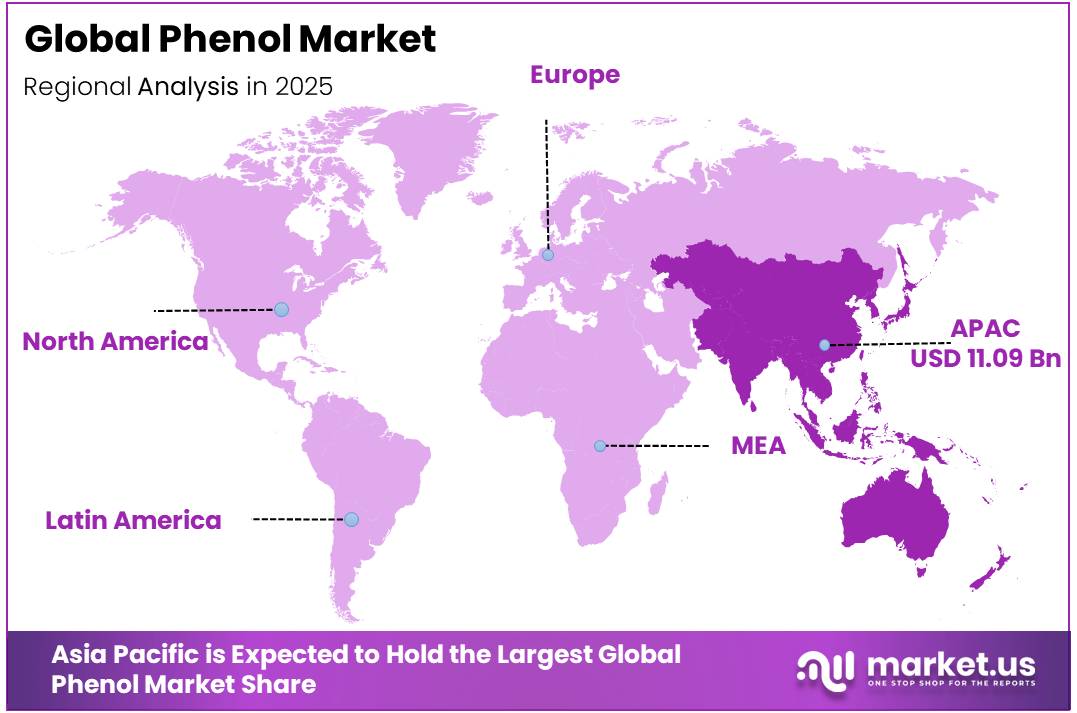
Asia Pacific held a dominant market position, capturing more than a 48.0% share, holding USD 11.09 billion in revenue.
Key Takeaways
- The global Phenol market was valued at US$23.1 billion in 2025.
- The global Phenol market is projected to grow at a CAGR of 4.7% and is estimated to reach US$36.5 billion by 2035.
- On the basis of product type, Bisphenol-A (BPA) dominated the market, constituting 44.6% of the total market share.
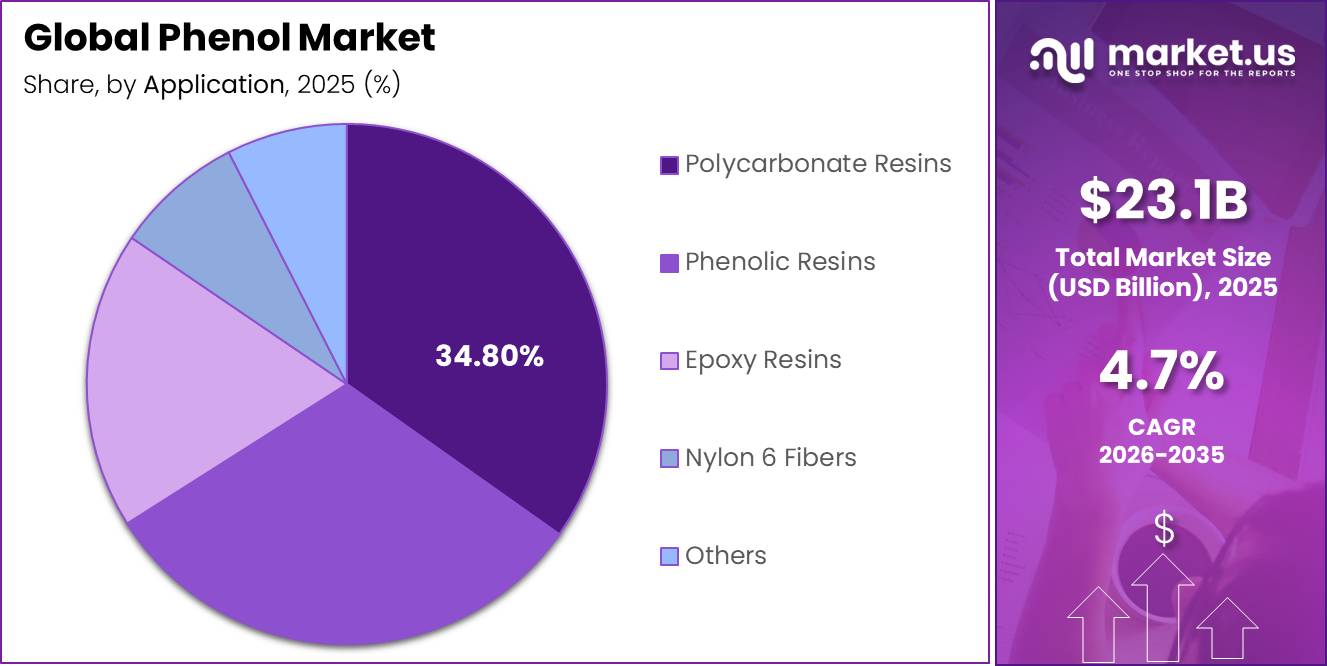
- Based on the application, Polycarbonate Resins dominated the market, with a substantial market share of around 34.8%.
- In 2025, Asia Pacific was the most dominant region in the Phenol market, accounting for 48.0% of the total global consumption.
Phenol is a fundamental petrochemical intermediate widely used in the production of bisphenol-A (BPA), phenolic resins, caprolactam, epoxy resins, and engineering plastics. The material plays a critical role in multiple end-use industries, including automotive, construction, electronics, coatings, and consumer goods. Market growth is closely linked to demand for polycarbonate resins and phenolic resin-based products, which are valued for their durability, heat resistance, and structural performance. The broader chemical industry continues to provide a strong foundation for phenol consumption, as more than 80% of basic and specialty chemicals are utilized by industrial sectors worldwide, highlighting the importance of chemical intermediates in manufacturing supply chains.
- According to the American Chemistry Council, global chemical production expanded by 2.6% in 2025, reflecting continued demand across key industrial applications.
The industrial landscape is being shaped by rising demand for lightweight materials, advanced plastics, and high-performance resins. Global plastics production reached approximately 413.8 million metric tons in 2023, supporting long-term consumption of phenol derivatives used in polycarbonate and specialty plastic manufacturing. Growth in automotive production, electronics manufacturing, and infrastructure development continues to support market expansion. In addition, increasing investments in chemical production capacity and process efficiency are strengthening supply availability across major producing regions.
Future opportunities are expected to emerge from sustainable chemical manufacturing, advanced resin technologies, and circular economy initiatives. Producers are investing in lower-emission production processes, feedstock optimization, and recycling technologies to meet evolving environmental requirements. Expanding demand for durable plastics, electronic components, and industrial materials is expected to create favorable conditions for continued growth of the phenol industry over the coming decade.
Global Phenol Market Segmentation
Product Type Analysis
Bisphenol-A (BPA) dominates with 44.6% share due to its extensive use in polycarbonate and epoxy resin production
In 2025, Bisphenol-A (BPA) held a dominant market position, capturing more than a 44.6% share of the global phenol market by product type. Its leading position was supported by strong demand from industries producing polycarbonate plastics and epoxy resins, which are widely used in automotive components, electrical equipment, electronics, and construction materials. BPA remained the largest outlet for phenol consumption as manufacturers continued to rely on its performance characteristics, including durability, heat resistance, and lightweight properties. The segment also benefited from ongoing industrial production activities and steady demand for engineered plastics across both developed and emerging economies. As of March 2025, BPA continued to account for the largest share of phenol utilization, reinforcing its importance across several downstream chemical value chains. Its broad application base and established manufacturing infrastructure helped maintain its dominant position throughout the year.
Phenolic Resins represented the second-largest product segment in 2025 and continued to record healthy demand from construction, automotive, insulation, and industrial manufacturing applications. The segment benefited from the growing use of high-performance adhesives, laminates, molded products, and thermal insulation materials. Strong demand for durable and heat-resistant materials across industrial sectors supported the steady expansion of phenolic resin consumption during 2025 and into 2026.
Application Analysis
Polycarbonate Resins dominate with 34.8% share due to their extensive use in automotive, electronics, and construction applications
In 2025, Polycarbonate Resins held a dominant market position, capturing more than a 34.80% share of the global phenol market by application. The segment maintained its leadership because phenol serves as a key raw material in the production of Bisphenol-A, which is widely used to manufacture polycarbonate plastics. These materials are valued for their high impact resistance, transparency, and lightweight properties, making them suitable for automotive components, consumer electronics, electrical equipment, and building materials. As of June 2025, manufacturers continued to increase the use of polycarbonate-based products to meet demand for durable and high-performance materials across multiple industries. The segment’s strong presence in both industrial and consumer applications supported its leading position in the phenol market throughout the year.
Phenolic Resins continued to show strong growth momentum during 2025 and into 2026, supported by rising demand from construction, wood processing, insulation, coatings, and industrial manufacturing sectors. The application benefits from the ability of phenolic resins to provide excellent heat resistance, mechanical strength, and durability. Increasing use of engineered wood products, laminates, and industrial adhesives contributed to the steady expansion of phenol consumption within this application segment.
Key Market Segments
By Product Type
- Bisphenol-A (BPA)
- Phenolic Resins
- Caprolactam
- Alkyl Phenyls
- Others
By Application
- Polycarbonate Resins
- Phenolic Resins
- Epoxy Resins
- Nylon 6 Fibers
- Others
Drivers
Restraints
Opportunity
Challenge
Geopolitical Impact Analysis
Petrochemical Trade Realignment and Feedstock Supply Risks Reshaping Global Phenol Production
Current geopolitical developments are influencing the phenol market through shifts in petrochemical trade flows, feedstock availability, and regional manufacturing strategies. Phenol production relies heavily on benzene and propylene, making the industry sensitive to trade restrictions, supply disruptions, and changing global sourcing patterns. As major economies focus on strengthening domestic chemical industries and reducing dependence on external suppliers, investment decisions across the phenol value chain are increasingly being shaped by geopolitical considerations. These developments are affecting procurement strategies for producers of Bisphenol-A (BPA), phenolic resins, caprolactam, and other phenol derivatives.
Trade policy changes, sanctions, and regional supply-chain diversification efforts have encouraged chemical manufacturers to reassess production footprints and sourcing networks. Companies are expanding local manufacturing capabilities and seeking alternative feedstock suppliers to improve supply security and reduce operational risks. At the same time, governments across Asia Pacific, North America, Europe, and the Middle East are supporting investments in petrochemical infrastructure to strengthen domestic production capacity. While these initiatives improve long-term resilience, the phenol industry remains exposed to feedstock price fluctuations, logistics challenges, regulatory changes, and geopolitical uncertainties that continue to influence global chemical trade and investment patterns.
Regional Analysis
Asia Pacific dominates the Phenol market with 48.0% share, valued at US$11.09 billion in 2025
In 2025, Asia Pacific held a dominant position in the global phenol market, accounting for 48.0% of total revenue and reaching a market value of US$11.09 billion. The region’s leadership was supported by its large petrochemical industry, strong manufacturing base, and high consumption of phenol derivatives across automotive, electronics, construction, and consumer goods sectors. China remained the largest contributor to regional demand due to its extensive production capacity and downstream chemical processing activities, while India, Japan, and South Korea continued to support market growth through expanding industrial output and infrastructure development.
The region also benefited from rising demand for Bisphenol-A (BPA), phenolic resins, and caprolactam, which are widely used in engineering plastics, coatings, adhesives, and industrial materials. Favorable manufacturing economics, integrated supply chains, and ongoing investments in chemical production facilities strengthened Asia Pacific’s position in 2025. With increasing industrialization and growing demand for high-performance materials, the region continued to serve as the primary production and consumption hub for phenol worldwide.
Key Regions and Countries Covered
- North America
- The US
- Canada
- Europe
- Germany
- France
- The UK
- Spain
- Italy
- Russia & CIS
- Rest of Europe
- APAC
- China
- Japan
- South Korea
- India
- ASEAN
- Rest of APAC
- Latin America
- Brazil
- Mexico
- Rest of Latin America
- Middle East & Africa
- GCC
- South Africa
- Rest of MEA
Key Players Analysis:
Phenol manufacturers focus on strengthening feedstock security, operational efficiency, and downstream integration to maintain their competitive position in the global market. A key strategic priority is optimizing production technologies that improve phenol yield, reduce energy consumption, and enhance cost competitiveness. Companies continue to invest in modern manufacturing facilities and process upgrades to improve operational reliability while meeting increasing demand from Bisphenol-A (BPA), phenolic resins, caprolactam, and specialty chemical applications. Expanding production capacity in high-growth industrial regions also remains an important approach to support long-term market presence.
Vertical integration with benzene, propylene, and other petrochemical feedstock suppliers helps manufacturers manage raw material availability and reduce exposure to price fluctuations. Leading producers are also strengthening relationships with downstream customers through long-term supply agreements and customized product offerings. In addition, companies emphasize sustainability initiatives, emissions reduction programs, process automation, and supply chain optimization to improve profitability and regulatory compliance. Strategic investments, production efficiency improvements, and strong distribution networks continue to play a crucial role in reinforcing market position and supporting growth across key end-use industries worldwide.
Market Key Players
- INEOS Group Holdings S.A.
- CEPSA
- Shell plc
- Mitsui Chemicals, Inc.
- BASF SE
- SABIC
- Solvay S.A.
- Honeywell International Inc.
- LG Chem Ltd.
- Chang Chun Group
- Formosa Chemicals & Fibre Corp.
- Mitsubishi Chemical Group Corporation
- Kumho P&B Chemicals
- AdvanSix Inc.
- ALTIVIA
- PTT Global Chemical Public Co., Ltd.
- Deepak Nitrite Ltd.
- Sasol Ltd.
- Domo Chemicals GmbH
- Others
Key Development
- In June 2025, INEOS Phenol announced plans to permanently cease phenol production at its Gladbeck, Germany facility as part of a strategic review, citing high energy costs and changing market dynamics while continuing to support customers through its global phenol network.
- In January 2025, Mitsui Chemicals, Inc. and Mitsubishi Chemical Group Corporation launched a joint study to establish a stable supply framework for phenol-related products, including phenol, acetone, and Bisphenol-A (BPA), aimed at strengthening supply security in Japan.
- In April 2025, Deepak Chem Tech Ltd., a subsidiary of Deepak Nitrite Ltd., approved a new manufacturing complex in Gujarat, India, for the production of phenol, acetone, and isopropyl alcohol, supporting downstream integration and future polycarbonate resin production.
- In May 2025, Deepak Chem Tech Ltd. confirmed plans to invest in a large-scale phenol, acetone, and IPA manufacturing facility to expand domestic production capacity and strengthen India’s self-reliance in key petrochemical intermediates.
Report Scope
| Report Features | Description |
|---|---|
| Market Value (2025) | US$23.1 Bn |
| Forecast Revenue (2035) | US$36.5 Bn |
| CAGR (2026-2035) | 4.7% |
| Base Year for Estimation | 2025 |
| Historic Period | 2020-2024 |
| Forecast Period | 2026-2035 |
| Report Coverage | Revenue Forecast, Market Dynamics, Competitive Landscape, Recent Developments |
| Segments Covered | By Product Type (Bisphenol-A (BPA), Phenolic Resins, Caprolactam, Alkyl Phenyls, and Others), By Application (Polycarbonate Resins, Phenolic Resins, Epoxy Resins, Nylon 6 Fibers, and Others) |
| Regional Analysis | North America – The US & Canada; Europe – Germany, France, The UK, Spain, Italy, Russia & CIS, Rest of Europe; APAC– China, Japan, South Korea, India, ASEAN & Rest of APAC; Latin America– Brazil, Mexico & Rest of Latin America; Middle East & Africa– GCC, South Africa, & Rest of MEA |
| Competitive Landscape | INEOS Group Holdings S.A., CEPSA, Shell plc, Mitsui Chemicals, Inc., BASF SE, SABIC, Solvay S.A., Honeywell International Inc., LG Chem Ltd., Chang Chun Group, Formosa Chemicals & Fibre Corp., Mitsubishi Chemical Group Corporation, Kumho P&B Chemicals, AdvanSix Inc., ALTIVIA, PTT Global Chemical Public Co., Ltd., Deepak Nitrite Ltd., Sasol Ltd., Domo Chemicals GmbH, and others. |
| Customization Scope | Customization for segments, region/country-level will be provided. Moreover, additional customization can be done based on the requirements. |
| Purchase Options | We have three licenses to opt for: Single User License, Multi-User License (Up to 5 Users), Corporate Use License (Unlimited Users and Printable PDF) |


