


Report Overview
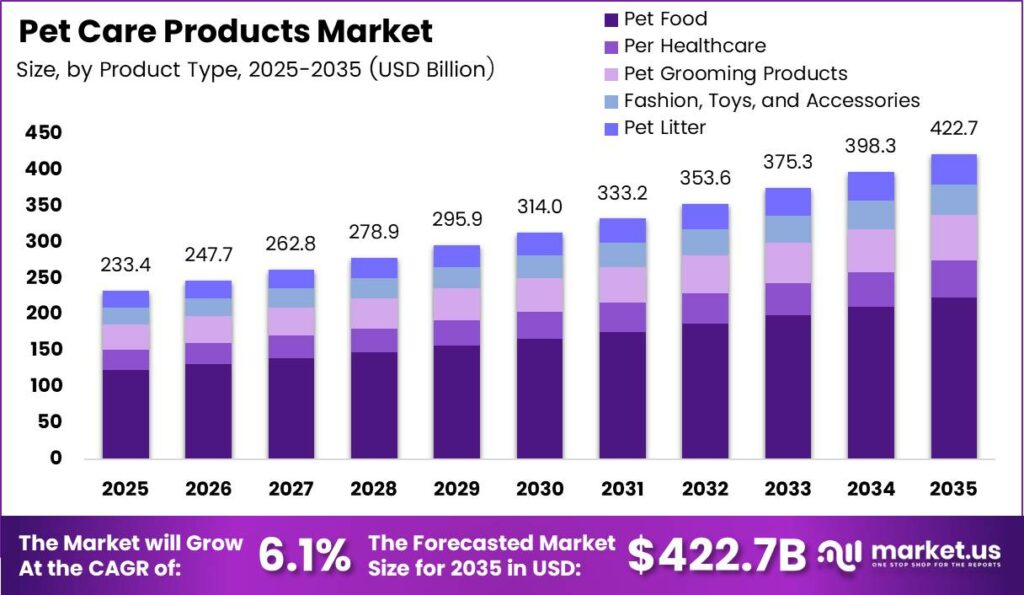
Global Pet Care Products Market size is expected to be worth around USD 422.7 Billion by 2035 from USD 233.4 Billion in 2025, growing at a CAGR of 6.1% during the forecast period 2026 to 2035. Pet care products support animal nutrition, hygiene, preventive care, comfort, and daily handling across household and specialist settings. These headline figures remain working estimates requiring independent forecast validation.
Pet care combines repeat-purchase consumables with less frequent purchases of accessories and care equipment, creating different revenue and inventory patterns. According to APPA, U.S. pet-industry expenditure reached USD 158 Billion in 2025, including products and services. That broader spending measure establishes commercial scale without defining product-only revenue. Suppliers can strengthen earnings quality through repeat purchasing, while retailers need different stock policies for essentials and discretionary items.
Key Takeaways
- The Pet Care Products Market-size is USD 233.4 Billion in 2025.
- The 2035 forecast value is USD 422.7 Billion.
- The stated CAGR is 6.1% during 2026 to 2035.
- Pet Food leads Product Type with a 52.34% share in 2025.
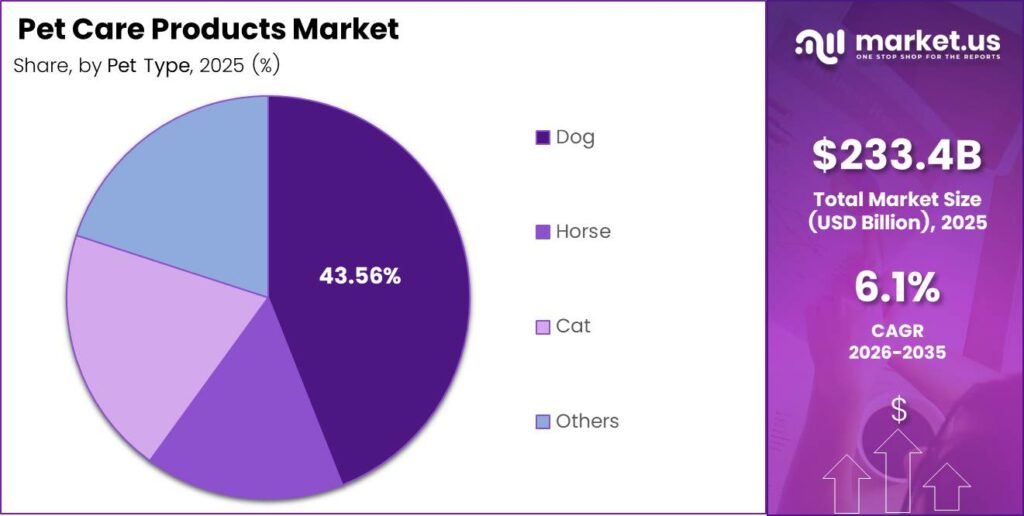
- Dog leads Pet Type with a 43.56% share in 2025.
- Offline leads Distribution Channel with a 74.87% share in 2025.
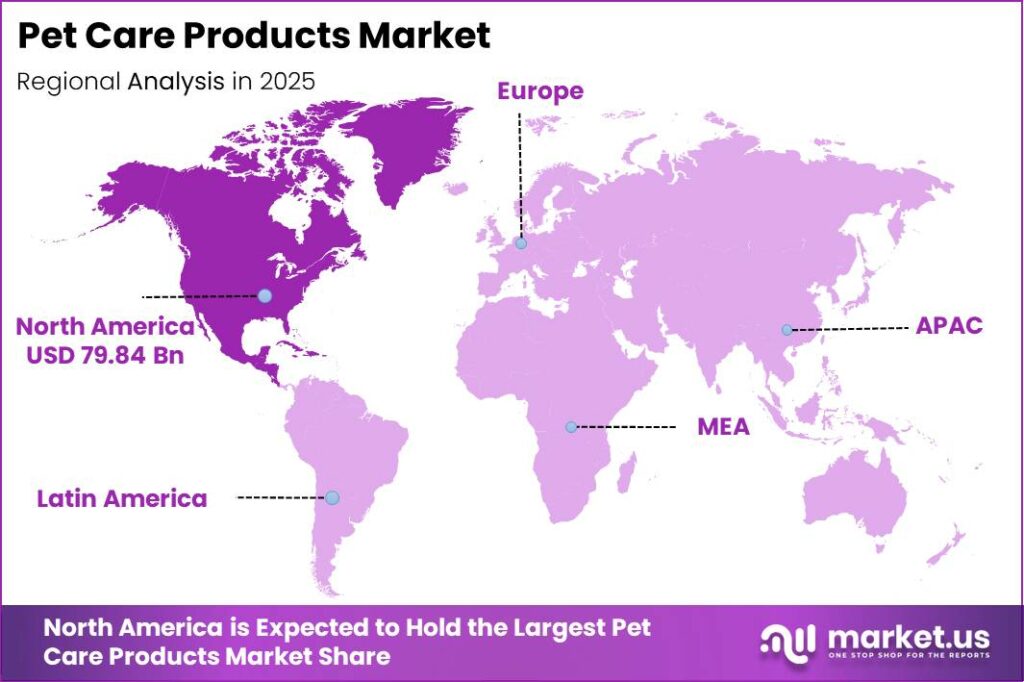
- North America leads the regional estimates with a 34.21% share and USD 79.84 Billion value in 2025.
- The forecast period runs from 2026 to 2035.
European policy exposure requires a different investment lens because product safety, packaging, and market access can influence expansion decisions alongside household ownership. As reported by FEDIAF, European households kept approximately 299 million pets in 2023, with findings published in 2025. This population measure establishes potential consumption breadth rather than regulatory spending. Investors should assess compliance readiness separately before treating geographic reach as an immediately accessible revenue opportunity.
Portfolio consolidation offers buyers a route into specialist categories without building every brand internally, although acquisition value depends on retained customers and distribution access. Data from General Mills shows its Whitebridge North American business acquisition closed in December 2024 for USD 1.45 Billion. The transaction combined premium cat feeding and pet treats. Investors should assess category fit and integration discipline rather than treating acquisition spending itself as evidence of organic expansion.
North America holds a 34.21% share in the 2025 market estimate, placing the region at the center of commercial planning. Recurring nutrition and hygiene purchases can support retailer replenishment programs, while discretionary accessories require tighter price positioning. The regional share remains an estimate rather than a separately verified measurement. Investors should distinguish installed consumption from premium conversion because those revenue sources carry different retention, promotion, and margin risks.
Manufacturing investment can improve supply control, but returns depend on utilization, product mix, and distribution execution rather than installed space alone. Figures from Nestlé Purina show its Eden factory opened in March 2024 after investment exceeding USD 450 Million. The facility covers approximately 1.3 million square feet. Investors should connect that manufacturing commitment to achievable throughput and customer retention before assuming capacity automatically produces attractive returns.
Product Type Analysis
Pet Food dominates with 52.34% share in 2025 due to essential daily feeding and repeat purchasing.
In 2025, Pet Food held a 52.34% share in the Product Type segment of the Pet Care Products Market. FEDIAF indicates that European pet-food sales reached EUR 29.3 Billion in 2023, establishing the category’s recurring-consumption scale. Purina announced its USD 195 Million Jefferson expansion in April 2024, targeting nearly 50% more wet-food production. Essential feeding supports replenishment, but investors must test utilization before pricing manufacturing expansion into returns.
Pet Healthcare serves owners seeking preventive products that support routine care between professional consultations, making product trust central to repeat purchasing. According to APPA, approximately 46% of U.S. dog owners owned dental-care products in its 2025 survey, published in 2026. Repeated oral-care use creates replacement demand, but ownership does not establish treatment adherence. Sellers should prioritize clear instructions and appropriate claims because poor use can weaken customer retention.
Pet Grooming Products support cleaning, coat maintenance, and routine handling within the home, placing convenience and ease of use near purchase decisions. As reported by APPA, approximately 51% of U.S. dog owners groomed their dogs at home in its 2025 survey. Home grooming requires reusable tools and replenished consumables, creating different replacement cycles. Retailers should pair suitable equipment with practical care guidance rather than rely exclusively on premium packaging.
Pet Type Analysis
Dog dominates with 43.56% share in 2025 due to broad daily care and feeding requirements.
In 2025, Dog held a 43.56% share in the Pet Type segment of the Pet Care Products Market. Data from APPA shows approximately 71 million U.S. households owned dogs in 2025, establishing a substantial national customer base. Differences in animal size and life stage create distinct feeding and care requirements. Suppliers should manage those differences through focused portfolios because excessive assortment can dilute stock productivity and marketing efficiency.
Horse products address specialist feeding, grooming, and handling requirements, making suitability and reliable availability more important than household-style convenience alone. UK Pet Food found that the United Kingdom had approximately 700,000 pet horses and ponies in 2024. Larger animals require different pack sizes, tools, and delivery arrangements than smaller household pets. Sellers should build specialist distribution economics rather than assume standard pet-shop formats will deliver attractive margins.
Cat products serve owners managing nutrition and daily care around indoor routines, feeding preferences, and practical household constraints. Based on UK Pet Food data, the United Kingdom had approximately 12.5 million pet cats in 2024. Frequent feeding and routine care create repeat purchasing, while animal preferences can influence switching behavior. Suppliers should test acceptance and repeat orders before extending product lines because initial trial does not establish durable customer value.
Distribution Channel Analysis
Offline dominates with 74.87% share in 2025 due to immediate availability and physical product selection.
In 2025, Offline held a 74.87% share in the Distribution Channel segment of the Pet Care Products Market. APPA indicates that approximately 32% of U.S. dog owners purchased dog food at supermarkets in its 2025 survey. Shopping incidence can overlap across channels, so that measure does not establish exclusive supermarket share. Retailers should protect shelf availability because essential feeding purchases reward dependable access more consistently than occasional promotional displays.
Online channels support planned replenishment and home delivery, making order frequency and delivery cost central to customer profitability. Figures from Chewy show approximately USD 12.6 Billion in fiscal 2025 net sales, with the fiscal year ending in February 2026. That company figure indicates online-focused retail scale rather than total channel revenue. Sellers should evaluate retained contribution after fulfillment because bulky repeat orders can expand sales without producing comparable margin gains.
Key Market Segments
By Product Type
- Pet Food
- Pet Healthcare
- Pet Grooming Products
- Fashion, Toys, and Accessories
- Pet Litter
By Pet Type
- Dog
- Horse
- Cat
- Others
By Distribution Channel
- Offline
- Online
Regional Analysis
North America Dominates the Pet Care Products Market with a Market Share of 34.21% in 2025, Valued at USD 79.84 Billion
North America’s leading estimated position gives suppliers a substantial commercial base, but the underlying household evidence specifically covers the United States. According to APPA, approximately 95 million U.S. households owned pets in 2025, supporting a broad recurring-consumption base. Food and care routines can translate that ownership into repeat purchases across retail formats. Investors should assess local distribution quality because continental leadership does not remove differences between national markets.
Asia-Pacific requires country-specific planning because import access, local production, and consumer budgets can produce different routes to profitable expansion. As reported by USDA FAS, U.S. dog- and cat-food exports to China totaled USD 244.7 Million in 2025. That bilateral flow demonstrates a trading relationship rather than total regional consumption. Manufacturers should compare export economics with local supply options before assuming overseas brands can scale without currency and distribution exposure.
Europe offers a broad ownership base, but product planning must account for differences in retail access and customer preferences across countries. Data from FEDIAF shows approximately 139 million European households owned pets in 2023, with the results published in 2025. That measure establishes household reach rather than current spending growth. Suppliers should prioritize country-level repeat purchasing and compliance costs before treating regional ownership as a uniform commercial opportunity.
Key Regions and Countries
North America
- US
- Canada
Europe
- Germany
- France
- The UK
- Spain
- Italy
- Rest of Europe
Asia Pacific
- China
- Japan
- South Korea
- India
- Australia
- Rest of APAC
Latin America
- Brazil
- Mexico
- Rest of Latin America
Middle East and Africa
- GCC
- South Africa
- Rest of MEA
Market Dynamics
APPA found that approximately 22% of U.S. pet owners spent less on their pets in 2025, making price positioning commercially important. Mars announced an A$39.3 Million Wodonga solar-thermal project in October 2024, with 18-megawatt capacity and up to 10 hours of storage. Household pressure and manufacturing investment address different parts of the profit equation. Suppliers should protect accessible products while testing whether energy projects generate measurable operating savings.
Drivers
A broader pet-owning household base supports recurring purchases rather than requiring suppliers to depend entirely on higher prices or discretionary upgrades. According to APPA’s March 2025 release, the United States had 94 million pet-owning households, including 68 million dog-owning and 49 million cat-owning households. Those species groups overlap and cannot be added together. Sellers should prioritize early customer relationships because reliable starter-to-maintenance conversion can improve retention across feeding and care routines.
Household expansion creates a commercial route into repeat orders, but ownership counts do not directly measure revenue growth or premium-product adoption. The estimated +0.55 percentage-point driver contribution represents analyst attribution within the baseline forecast, not a measured causal coefficient. Every driver estimate describes an embedded contribution rather than an automatic addition. Investors should test customer acquisition, replenishment frequency, and retention before translating household formation into a revenue premium.
| Driver | (~) % Impact on CAGR Forecast | Geographic Relevance | Impact Timeline |
|---|---|---|---|
| Expanding pet-owning household base | +0.55% | North America; Europe; urban Asia-Pacific | Short term (≤ 2 years) |
| Premiumization of everyday pet nutrition | +0.35% | North America; Western Europe; developed Asia-Pacific | Medium term (2–4 years) |
| Established online replenishment adoption | +0.25% | North America; China; Western Europe | Short term (≤ 2 years) |
| Multi-pet household consumption intensity | +0.20% | North America; Europe; Latin America | Short term (≤ 2 years) |
| Indoor-pet hygiene consumption | +0.15% | Urban markets worldwide | Medium term (2–4 years) |
Restraints
Household affordability limits spending on optional accessories, discretionary treats, and premium upgrades, even when owners protect basic feeding purchases. As reported in the Federal Reserve survey summary, 63% of U.S. adults could cover the specified emergency expense using cash or equivalents. Financial comfort reached 73%, leaving 27% outside those categories. These general household measures indicate financial pressure, not pet-specific purchasing behavior, so suppliers should avoid mechanically extending them across international markets.
An illustrative stress case assumes discretionary products represent 20% of category spending and their growth trails the unconstrained path by 2.25 percentage points. That calculation describes modeling assumptions rather than observed pet-market outcomes, keeping the restraint separate from survey evidence. Suppliers face weaker premium conversion when households delay optional purchases, making accessible entry packs and promotion discipline commercially important. Investors should treat the estimated drag as embedded pressure rather than an automatic forecast deduction.
| Restraint | (~) % Impact on CAGR Forecast | Geographic Relevance | Impact Timeline |
|---|---|---|---|
| Household affordability limits discretionary purchases | -0.45% | Global; strongest among financially constrained households | Short term (≤ 2 years) |
| Noncompliant product sales prohibitions | -0.20% | Regulated markets worldwide | Short term (≤ 2 years) |
| Small-retailer working-capital rationing | -0.15% | Emerging markets; independent retail channels | Short term (≤ 2 years) |
| Rental housing pet exclusions | -0.10% | Rental-heavy urban markets | Long term (≥ 4 years) |
| Import licensing and quarantine barriers | -0.10% | Import-dependent regulated markets | Medium term (2–4 years) |
Challenges
Biological ingredient safety creates an operating challenge because manufacturers must control hazards without unnecessarily interrupting compliant product supply or delaying every release. Based on the FDA communications summarized for January and September 2025, covered manufacturers needed to reassess relevant food-safety plans for avian influenza. Uncooked or unpasteurized poultry- and cattle-derived materials required particular attention. Manufacturers should connect supplier verification, validated processing, and traceability because isolated testing cannot substitute for an effective control system.
An illustrative affected-portfolio scenario assumes enhanced controls cover 10% of ingredient volume, adding 2 to 5 days of release inventory. The scenario assumes a 0.3 to 0.8 percentage-point gross-margin burden within that exposed portfolio, not an observed industry average. Extra qualification work can slow product development and absorb working capital before sales occur. Investors should separate those operating frictions from prohibited-product losses to avoid counting the same commercial exposure twice.
| Challenge | (~) % CAGR Friction Drag | Geographic Relevance | Mitigation Horizon |
|---|---|---|---|
| Biological ingredient safety assurance | -0.30% | Global animal-protein supply chains; U.S. regulatory exposure | Short term (≤ 2 years) |
| Packaging material qualification complexity | -0.20% | Europe; exporters serving European markets | Medium term (2–4 years) |
| Bulky product fulfillment economics | -0.15% | Global; low-density delivery networks | Medium term (2–4 years) |
| Specialist formulation talent scarcity | -0.10% | Global; emerging manufacturing clusters | Long term (≥ 4 years) |
| Connected device interoperability gaps | -0.10% | North America; Europe; developed Asia-Pacific | Medium term (2–4 years) |
Opportunities
Clinically measured weight-management bundles offer a route beyond ordinary premium-food substitution by combining portion control, feeding tools, and documented progress. Figures from the FDA educational summary show estimated excess weight affected 59% of U.S. dogs and 61% of cats. The May 2024 update described a veterinary planning tool supporting a 12-week program. Those figures establish clinical need rather than commercial conversion, making veterinary participation and sustained adherence central to investment quality.
An illustrative execution model assumes conversion of 5% of an eligible unserved cohort and 10% higher annual product spending per converted customer. The resulting 0.5% cohort-level uplift precedes substitution and rollout effects, so it cannot directly represent market growth. Pilot targets include 5 to 8% lower acquisition costs and 1 to 2 percentage points higher program margins. Early movers should validate those assumptions before expanding clinic partnerships or committing manufacturing resources.
| Opportunity | (~) % Potential CAGR Upside | Geographic Relevance | Execution Window |
|---|---|---|---|
| Clinically measured weight-management product bundles | +0.35% | North America; Europe; developed Asia-Pacific | Medium term (2–4 years) |
| Locally manufactured tropical parasite solutions | +0.25% | South Asia; Southeast Asia; Latin America; Africa | Medium term (2–4 years) |
| Species-specific small-pet nutrition portfolios | +0.20% | Europe; North America; selected Asian markets | Medium term (2–4 years) |
| Repairable accessory refurbishment networks | +0.15% | Europe; North America | Long term (≥ 4 years) |
| Specialty-brand manufacturing consolidation | +0.10% | Fragmented regional manufacturing markets | Medium term (2–4 years) |
Key Company Insights
Blue Buffalo Co., Ltd.
Blue Buffalo’s investment case requires separating brand performance from its parent’s broader reporting segment because portfolio changes can affect reported comparisons. According to General Mills’ annual report, North America Pet net sales increased 4% in fiscal 2025, covering multiple brands. That segment result cannot establish standalone Blue Buffalo growth or customer retention. Investors should assess brand-level repeat purchasing and mix before assigning the broader segment’s performance entirely to Blue Buffalo.
Blue Buffalo’s refrigerated-food entry expands the brand’s product choices while adding execution questions around freshness, handling, and retained customer spending. As reported by General Mills, Love Made Fresh launched nationally in October 2025 through two formats, Scoop & Serve tubs and Slice & Serve rolls. Chicken and beef options provide different purchase choices within that launch. Investors should test incremental household spending because switching existing customers between formats does not automatically create additional revenue.
Nestlé Purina PetCare
Nestlé Purina’s commercial scale supports a broad investment program, but reported sales still require careful interpretation across currencies and reporting categories. Data from Nestlé’s annual reporting shows PetCare generated CHF 18,406 Million in sales during 2025, distinct from total group revenue. That category scale provides context for manufacturing and portfolio decisions rather than a direct measure of market share. Investors should evaluate organic performance separately from currency movements and reported totals.
Nestlé Purina’s manufacturing strategy includes upgrading established locations, which can connect existing distribution relationships with more competitive production assets. Nestlé indicates that it announced more than GBP 150 Million for its Wisbech factory in September 2024, equivalent to CHF 167 Million. That announced commitment represents capital deployment rather than proof of completed returns. Investors should monitor execution, utilization, and product economics before assuming modernization will translate directly into improved cash generation.
Key Players
- Ancol Pet Products Limited
- Blue Buffalo Co., Ltd
- Champion Petfoods LP
- Hill’s Pet Nutrition, Inc.
- Mars, Incorporated
- Nestle Purina PetCare
- Petmate Holdings Co
- Saturn Petcare GmbH
- Tail Blazers
- The Hartz Mountain Corporation
- Other Key Players
Recent Developments
2026
- September 2026: Nestlé Purina announced investment exceeding CHF 157 Million to expand Rayong pet food and treat manufacturing in Thailand, supporting regional production. According to Nestlé, the expansion covers several established pet nutrition brands.
- August 2026: Nestlé Purina opened its Batavia, Ohio, manufacturing facility following investment exceeding USD 550 Million, expanding its domestic production footprint. As reported by the Nestlé Purina News Center, the opening marked completion of a major manufacturing commitment.
- August 2026: Elanco completed a 25,000 square foot Elwood manufacturing expansion supported by USD 120 Million in investment, increasing capacity more than fourfold. Data from Elanco’s announcement also identifies a further USD 30 Million planned through 2028.
- July 2026: Nestlé Purina announced a CHF 520 Million integrated pet food plant and logistics platform in Mantova, Italy. Nestlé indicates that production is expected to begin in 2029, making execution timing important to capacity planning.
- June 2026: Mars opened its A$112.6 Million Wodonga cat food pouch facility, designed to produce 290 million pouches annually. Figures from Mars Australia show a concrete addition to local production capacity rather than a forecast of realized sales.
- May 2026: Mars Petcare and Big Idea Ventures launched their pet food innovation partnership, offering USD 15,000 to selected companies alongside technical support. According to Mars, the program seeks commercially relevant ingredient and nutrition innovation.
- March 2026: Nestlé Purina opened its Vargeão wet food factory following BRL 2.5 Billion in investment, equivalent to CHF 370 Million. As reported by Nestlé, full operation is expected to nearly double its Brazilian wet food capacity.
2025
- May 2025: Mars opened its USD 450 Million Royal Canin facility in Lewisburg, Ohio, covering 450,000 square feet. Data from Mars shows the factory was designed to feed approximately 4 million pets annually, connecting investment scale with planned production reach.
Geopolitical Impact Analysis
Red Sea disruption has made shipping distance and route reliability material planning variables for pet-product manufacturers importing ingredients, packaging, or finished goods. UNCTAD found that Suez Canal tonnage remained approximately 70% below 2023 levels by May 2025, indicating persistent disruption rather than normal routing. Global seaborne ton-miles increased 5.9% in 2024, showing how longer journeys expanded transport work beyond changes in cargo volumes. Longer routes can extend replenishment cycles for fishmeal, animal-protein ingredients, cans, pouches, and imported accessories, tying up inventory before manufacturers collect sales revenue. Buyers should compare suppliers using delivered cost and replenishment reliability, while manufacturers should test stock buffers against ingredient shelf life and working-capital constraints.
Freight costs and shipping emissions create separate pressures for pet-care supply chains because transport expense and environmental exposure affect different commercial decisions. Based on UNCTAD data, the Shanghai Containerized Freight Index averaged 2,496 points in 2024, providing a global indicator of container-cost conditions. Shipping greenhouse-gas emissions increased approximately 5% during the same year, adding environmental pressure alongside the operational effects of disrupted routes. Heavy litter, canned food, and bulky accessories can face difficult delivered-cost tradeoffs, while packaging and ingredient buyers must consider both transport distance and availability. Distributors should examine freight clauses, sourcing concentration, and shipment density because neither global index movements nor emissions changes establish a measured pet-sector price increase.
Report Scope
| Report Features | Description |
|---|---|
| Market Value (2025) | USD 233.4 Billion |
| Forecast Revenue (2035) | USD 422.7 Billion |
| CAGR (2026-2035) | 6.1% |
| Base Year for Estimation | 2025 |
| Historic Period | 2021-2025 |
| Forecast Period | 2026-2035 |
| Report Coverage | Revenue Forecast, Market Dynamics, Market Opportunity Analysis, Technology and Innovation Landscape, Competitive Landscape, Recent Developments |
| Segments Covered | Product Type: Pet Food, Pet Healthcare, Pet Grooming Products, Fashion, Toys, and Accessories, Pet Litter. Pet Type: Dog, Horse, Cat, Others. Distribution Channel: Offline, Online. |
| Regional Analysis | North America (US and Canada), Europe (Germany, France, The UK, Spain, Italy, and Rest of Europe), Asia Pacific (China, Japan, South Korea, India, Australia, and Rest of APAC), Latin America (Brazil, Mexico, and Rest of Latin America), Middle East and Africa (GCC, South Africa, and Rest of MEA) |
| Competitive Landscape | Ancol Pet Products Limited; Blue Buffalo Co., Ltd; Champion Petfoods LP; Hill’s Pet Nutrition, Inc.; Mars, Incorporated; Nestle Purina PetCare; Petmate Holdings Co; Saturn Petcare GmbH; Tail Blazers; The Hartz Mountain Corporation; Other Key Players. |
| Customization Scope | Customization for segments, region / country-level will be provided. Additional customization can be done based on requirements. |
| Purchase Options | We have three licenses to opt for: Single User License | Multi-User License (Up to 5 Users) | Corporate Use License (Unlimited User and Printable PDF) |





































