Report Overview
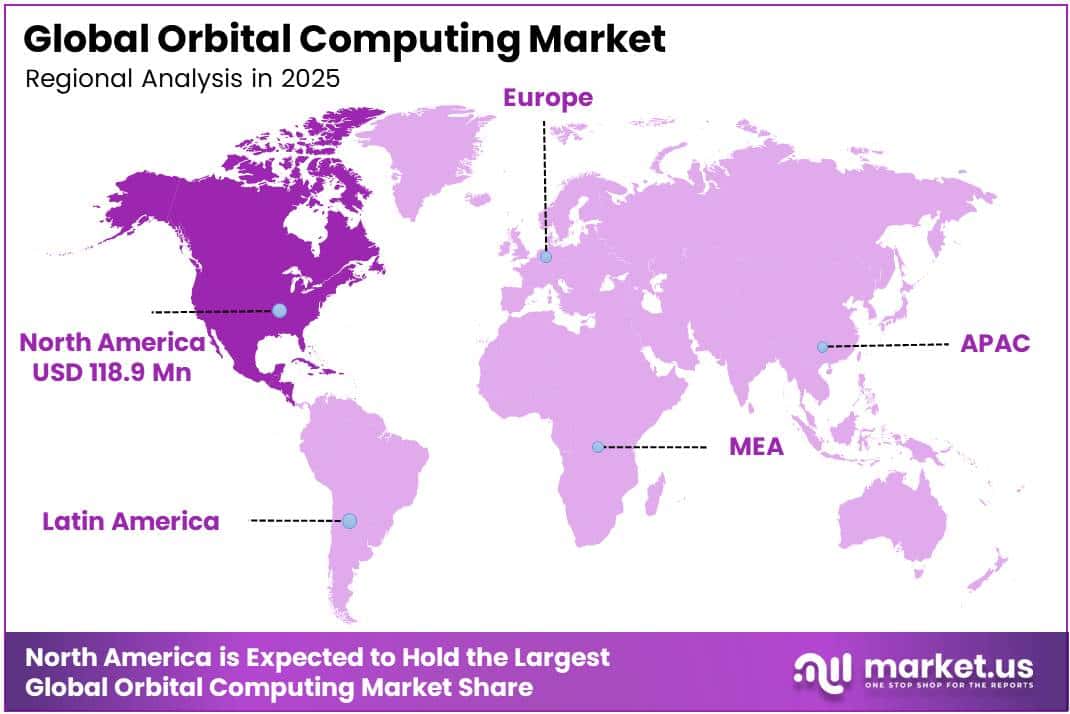
In 2025, the Global Orbital Computing Market was valued at USD 254.5 million. The market is projected to grow at a CAGR of 11.0% during 2026–2035, reaching approximately USD 724.6 million by 2035. North America dominated the global market in 2025, accounting for more than 46.7% of the total market share and generating approximately USD 118.9 million in revenue.
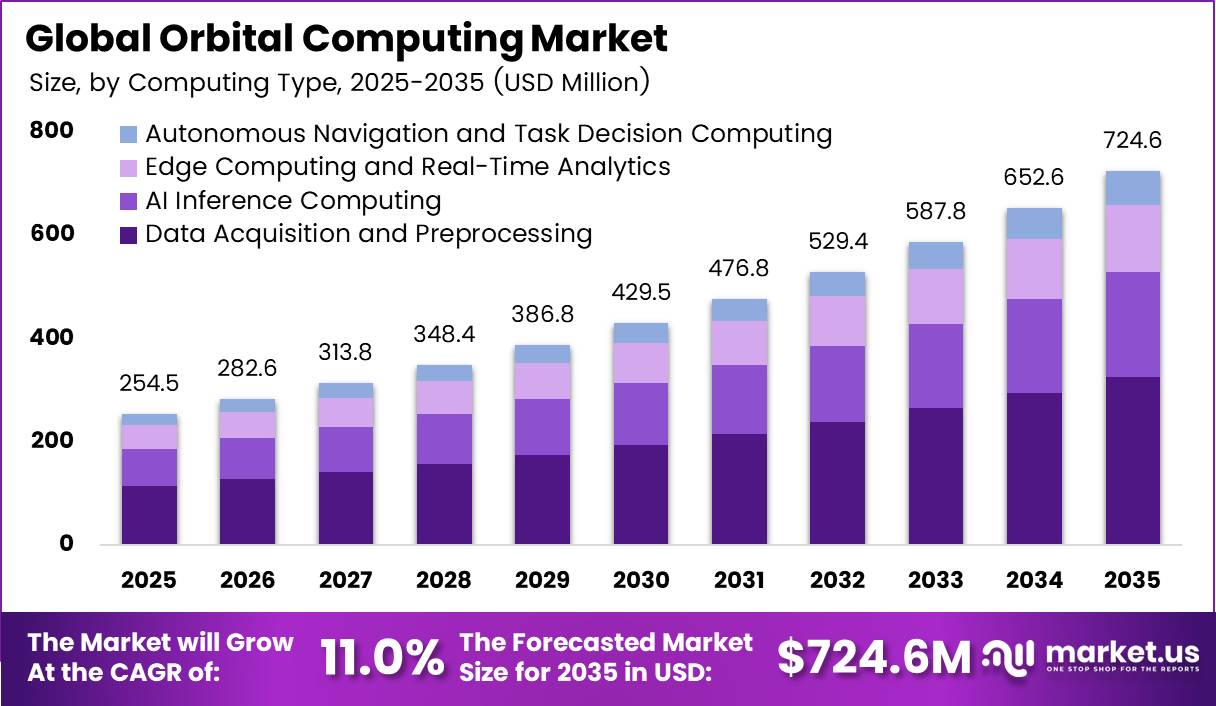
Growth stems from a sharp rise in space budgets and demand for satellite data. The U.S. Space Force requested USD 5.9 billion for operations and maintenance in FY2026, a USD 653 million increase over the FY2025 enacted level.
The European Space Agency secured EUR 22.3 billion at its 2025 Ministerial, up from EUR 16.9 billion in the prior cycle. Satellites now collect far more data than ground links can move. Operators therefore process and filter data in orbit, which drives demand for onboard processors, AI chips, and edge software.
The North America region leads because it combines the largest defense space budget with deep private capital. The Department of the Air Force proposed USD 71.1 billion for the Space Force in its FY2027 request. That request rose 124% from FY2026, the largest percentage increase for any service since 1952.
Key Takeaways
- The Orbital Computing Market reached USD 254.5 million in 2025 and will hit USD 724.6 million by 2035. at a CAGR of 11.0% from 2026 to 2035.
- By computing type, Data Acquisition and Preprocessing leads with a 46.7% share.
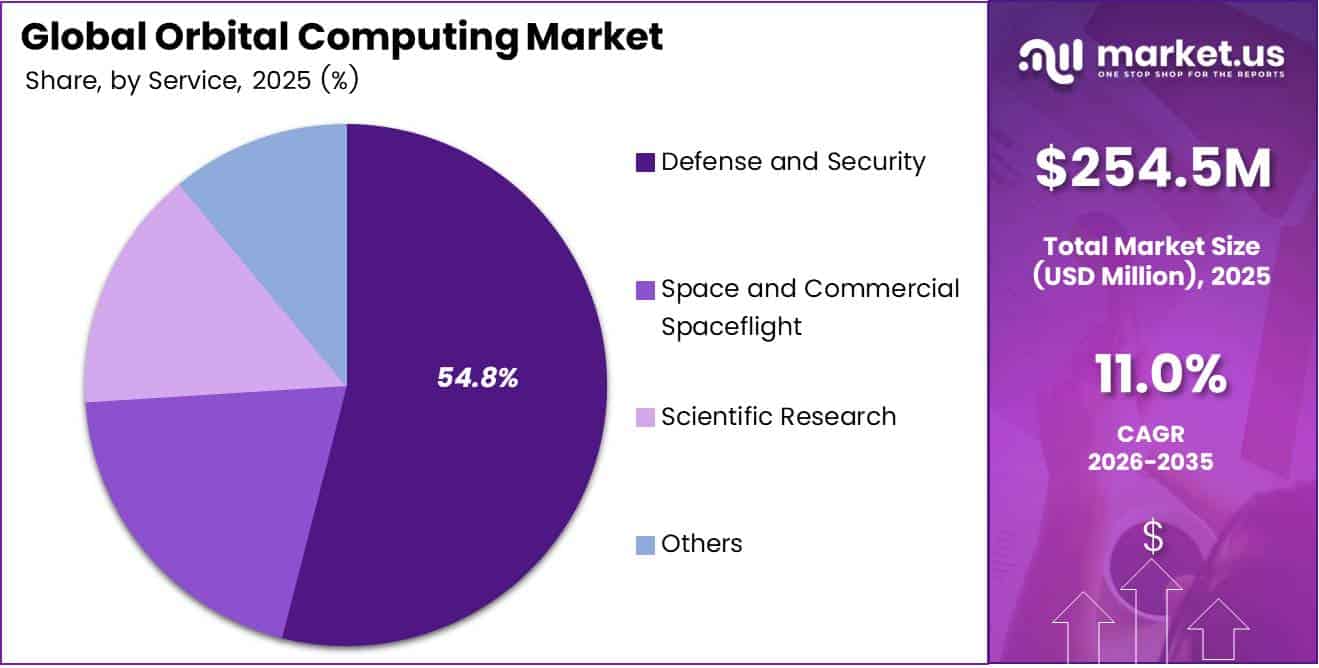
- By service, Defense and Security leads with a 54.8% share and is also the fastest-growing segment.
- North America leads with a 46.7% share, worth USD 118.9 million in 2025.
By Computing Type
Data Acquisition and Preprocessing dominates with 46.7% due to rising raw satellite data volumes.
Data Acquisition and Preprocessing holds the top spot because every satellite mission must first collect and clean raw data before any other task can begin. NASA Earthdata already hosts more than 178 petabytes of Earth science data, and NASA expects its archive to pass 500 petabytes. NASA turns raw data into usable products within 8 to 40 hours, so operators want to cut that delay in orbit.
Onboard preprocessing also eases tight downlink limits. AI-tuned compression tools, such as Block Adaptive Quantisation, shrink data by up to about 100 times without losing key details. This lets operators send only useful files to the ground.
Edge Computing and Real-Time Analytics is growing fastest because missions now need instant answers in space. HPE’s Spaceborne Computer-2 processed 1.8 GB of DNA data on the ISS in 6 minutes and sent a 92 KB result to Earth in 2 seconds. That is a 20,000-times speed-up over a 12.2-hour raw download. NASA JPL tests on a Snapdragon chip aboard the ISS also showed a 75-times speed-up over older flight hardware.
By Service
Defense and Security dominates with 54.8% due to record military space budget growth.
Defense and Security leads the market because armed forces now treat orbit as a front line and need fast data from space. The Congressional Research Service reports that the U.S. Space Force requested $71.3 billion for FY2027. That is 123% more than the FY2026 enacted total of $31.9 billion. Of the discretionary request, the service set aside $38.4 billion, or 65%, for research and development.
Large satellite networks turn this money into steady demand for orbital computers. The Space Development Agency plans a Tranche 1 fleet of 154 operational satellites. The GAO says the full architecture will reach 300 to 500 satellites, at a cost of nearly $35 billion through FY2029.
Defense and Security is also the fastest-growing sub-segment, because commanders want satellites that can think for themselves. The Space Force budget asks for $21.6 billion for Space Control, a 158% jump, and $6.8 billion for missile warning and tracking. SDA’s Tranche 4 request for information now asks for next-generation compute, processing, and data fusion on board.
Key Market Segments
By Computing Type
- Data Acquisition and Preprocessing
- AI Inference Computing
- Edge Computing and Real-Time Analytics
- Autonomous Navigation and Task Decision Computing
- Others
By Service
- Defense and Security
- Space and Commercial Spaceflight
- Scientific Research
- Others
Geopolitical Impact Analysis
Trade tensions now shape the cost of every orbital computer. China limited exports of gallium and germanium from 2023 and banned shipments to the U.S. in December 2024, according to WTO trade monitoring. Space-grade chips, solar cells, and radio parts use these metals, so builders pay more for them and wait longer to get them.
Shipping problems add more delay. UNCTAD reported that Suez Canal tonnage stayed 70% below the 2023 average in early May 2025. Ships now reroute around the Cape of Good Hope, which adds about 10 to 14 days to each Asia-to-Europe trip. UNCTAD also found that seaborne ton-miles grew 5.9% in 2024 while trade volume grew only 2.2%. Satellite parts and test gear from Asian suppliers take this longer route.
Energy risk also affects costs. The Strait of Hormuz carries 11% of maritime trade and over one-third of seaborne oil, according to UNCTAD. Iran and Israel clashed in June 2025, which pushed up fuel and freight risk premiums. Higher energy prices raise the cost of chip fabs, rocket propellant, and clean rooms.
U.S. tariff policy adds more pressure. Section 301 duties on Chinese semiconductors rose to 50% in 2025, according to WTO tariff notifications. Orbital computing firms now favor U.S., Japanese, and European suppliers, even at higher prices. This shift supports Defense and Security buyers, who need trusted supply chains. It also slows commercial buyers who want the lowest cost per unit of compute.
Regional Analysis
North America dominates the Orbital Computing Market, holding a 46.7% share and generating USD 118.9 million in revenue. The U.S. drives this lead through defense spending, launch access, and venture funding. The Department of the Air Force proposed a total budget of USD 338.8 billion for the Air Force and Space Force, a rise of USD 92.5 billion over the current year.
A large part of this money supports space awareness, missile warning, and fast data links. All of these missions need onboard processing. Private capital also flows quickly. U.S. startups have raised hundreds of millions of dollars for orbital data centers in under a year. NASA backs this trend with commercial space station programs that need computing in orbit.
Asia Pacific is the fastest-growing region in the Orbital Computing Market. India allocated about INR 13,416 crore to its Department of Space for FY2026 and opened space to private firms through IN-SPACe. Japan set up a JPY 1 trillion space strategy fund through JAXA to back commercial missions.
Key Regions and Countries
North America
- US
- Canada
Europe
- Germany
- France
- The UK
- Spain
- Italy
- Rest of Europe
Asia Pacific
- China
- Japan
- South Korea
- India
- Australia
- Rest of APAC
Latin America
- Brazil
- Mexico
- Rest of Latin America
Middle East and Africa
- GCC
- South Africa
- Rest of MEA
Market Dynamics
Drivers
| Driver | (~) % Impact on CAGR Forecast | Geographic Relevance | Impact Timeline |
|---|---|---|---|
| Hyperscaler and GPU-Vendor Entry into In-Orbit AI Compute | +1.6% | North America, Global | Short term (2 years or less) |
| Earth Observation Data Overload and Downlink Cost Avoidance | +1.2% | North America, Europe, Asia Pacific | Short term (2 years or less) |
| Defense Demand for Low-Latency Edge Intelligence | +1.0% | North America, Europe, Asia Pacific | Short term (2 years or less) |
| State-Backed Chinese Computing Constellations | +0.8% | Asia Pacific (China) | Medium term (2 to 4 years) |
| Rideshare Launch Cadence and Lower Cost per Kilogram | +0.6% | Global | Medium term (2 to 4 years) |
Hyperscaler and GPU-Vendor Entry into In-Orbit AI Compute
NVIDIA’s space computing program describes orbital compute as GPU-accelerated processing aboard LEO satellites, built on Jetson Orin, IGX Thor and the Space-1 Vera Rubin module. NVIDIA says that module delivers up to 25x more AI compute per GPU for orbital inference.
The milestones before the baseline year turned this into a hardware cycle that can be counted. Per Starcloud’s company disclosures, Starcloud-1 put the first data-center-class H100 into orbit in November 2025. NVIDIA said the satellite carried 100x more GPU compute than any previous spacecraft, and in December 2025 it became the first to train an LLM in orbit.
Google’s Project Suncatcher prototype launched on October 1, 2026, with 4 TPUs and up to 1 kW of power. Per company statements, it can run one TPU for only about 20 minutes at a time, and 2 more satellites are planned for 2027.
Restraints
| Restraint | (~) % Impact on CAGR Forecast | Geographic Relevance | Impact Timeline |
|---|---|---|---|
| Dependence on Unproven Super-Heavy Reusable Launch | -1.4% | Global | Medium term (2 to 4 years) |
| High Unit Cost Versus Terrestrial Data Centers | -1.0% | Global | Short term (2 years or less) |
| Spectrum and Constellation Licensing Backlogs | -0.6% | North America, Europe | Short term (2 years or less) |
| Export Controls on Advanced AI Accelerators | -0.5% | Asia Pacific, Middle East | Short term (2 years or less) |
| Elevated Cost of Capital for Pre-Revenue Ventures | -0.4% | North America, Europe | Short term (2 years or less) |
Dependence on Unproven Super-Heavy Reusable Launch
The root cause is mass to orbit. Megawatt-class orbital data centers need very large solar arrays, radiators, and rack-scale payloads, and none of the current operational launchers can deliver that mass economically. Both leading orbital data center programs need Starship to be fully and rapidly reusable before they can scale.
The bottleneck shows up in the size of the vehicles involved. Per Cowboy Space Corporation’s company disclosures, its Big Iron vehicle is designed to carry more than 15,000 kg to sun-synchronous orbit. Its deployed upper stage would span 132 m by 73 m and hold 5 Vera Rubin racks. Per its FCC filing, Orbital’s plan for 100,000 satellites delivering 10 GW also depends on Starship arriving toward the end of the decade.
Challenges
| Challenge | (~) % CAGR Friction Drag | Geographic Relevance | Mitigation Horizon |
|---|---|---|---|
| Thermal and Power Duty-Cycle Limits | -0.9% | Global | Medium term (2 to 4 years) |
| Radiation-Induced Chip Degradation | -0.7% | Global | Medium term (2 to 4 years) |
| Orbital Debris and Congestion Risk | -0.5% | Global | Long term (4 years or more) |
| Space-Qualified Engineering Talent Gap | -0.4% | North America, Europe, India | Medium term (2 to 4 years) |
| Optical Inter-Satellite Link Maturity | -0.3% | Global | Medium term (2 to 4 years) |
Thermal and Power Duty-Cycle Limits
The structural weakness is that in vacuum, heat can only leave by radiation. Every watt of accelerator compute therefore needs radiator area and solar generation sized for the full load. Google’s Suncatcher disclosures show the satellite can power one TPU for only about 20 minutes at a time on a 1 kW power budget.
The friction is the gap between installed compute and compute that is actually used. On an 800 km dawn-dusk polar orbit, solar panels can collect 5 to 8 times more energy than ground arrays. Even so, per ESA ASCEND study work and operator telemetry, duty cycles well below full utilization reduce effective revenue per kilogram launched.
Opportunities
| Opportunity | (~) % Potential CAGR Upside | Geographic Relevance | Execution Window |
|---|---|---|---|
| Orbital Compute-as-a-Service for Third-Party AI Training | +1.5% | North America, Europe, Middle East | Long term (4 years or more) |
| Sovereign In-Orbit Data Hosting | +1.0% | Europe, Middle East, India | Medium term (2 to 4 years) |
| Space-Based Solar and Power-Beaming Integration | +0.7% | North America, Asia Pacific | Long term (4 years or more) |
| Lunar and Cislunar Edge Compute Nodes | +0.5% | North America, Asia Pacific | Long term (4 years or more) |
| Startup Consolidation and Payload Platform Roll-Ups | +0.4% | North America, Europe | Medium term (2 to 4 years) |
Orbital Compute-as-a-Service for Third-Party AI Training
This is still untapped white space. Current revenue comes almost entirely from edge inference on data the satellite collects itself, while large-scale training for terrestrial AI customers has not yet been sold commercially. Starcloud filed for up to 88,000 satellites and Blue Origin for 50,000 satellites for orbital data center systems.
Radiative cooling also removes the water and chiller overhead behind terrestrial PUE figures of about 1.1 to 1.5, per Uptime Institute operator surveys. That could lower energy cost per GPU-hour by about 30% to 50% once cost per kilogram drops below roughly $200.
Capturing this requires deliberate action: building inter-satellite optical meshes, offering multi-tenant scheduling, and signing anchor contracts. China’s Zhejiang Lab and ADA Space plan 2,800 computing satellites, including 400 for training. Western operators that move first could expand gross margins by about 10 to 15 percentage points over hardware-and-data models.
Key Players Analysis
Tier 1 leaders include SpaceX, Planet, and Axiom Space. SpaceX controls most launch capacity and filed with the FCC for up to 1,000,000 orbital data center satellites in January 2026. Planet reported Q2 FY2027 revenue of USD 116.1 million, up 58% year over year, with a backlog of about USD 815 million. Planet guides full-year FY2027 revenue at USD 430 million to USD 441 million.
Planet invests heavily in AI-enabled Pelican satellites. It expects FY2027 CapEx of USD 100 million to USD 115 million and spent about USD 29 million in Q2 alone. It also raised about USD 120 million through its at-the-market equity program in Q2. Axiom Space has raised more than USD 1 billion company-wide, including a round above USD 525 million in 2026. In January 2026, it launched 2 free-flying orbital data center nodes.
Tier 2 challengers include Starcloud, D-Orbit, Aetherflux, Aethero, and OrbitsEdge. Starcloud raised a USD 170 million Series A at a USD 1.1 billion valuation, then a USD 250 million extension at a USD 2.3 billion valuation. Its total funding now stands near USD 450 million. Nvidia invested USD 25 million in that round.
D-Orbit raised EUR 150 million in its Series C to grow in-orbit logistics and hosted payloads. Aetherflux closed a USD 50 million Series A for its power beaming and compute plan. Aethero has run 2 in-orbit demonstrations, including a 157 TOPS edge computer, on about USD 8.4 million in disclosed funding.
Top Key Players in the Market
- Aetherflux
- Aethero
- Axiom Space
- D-Orbit
- OrbitsEdge
- Planet
- SpaceX
- Starcloud
Recent Developments
- In November 2025, Starcloud launched Starcloud-1, the first satellite to carry 1 Nvidia H100 data center GPU into orbit, and ran AI inference in space.
- In January 2026, Axiom Space launched 2 orbital data center nodes on Kepler Communications’ optical relay satellites.
- In August 2026, Starcloud closed a USD 250 million Series A extension at a USD 2.3 billion valuation to build a 100,000-square-foot factory in Woodinville, Washington.
Report Scope
| Report Features | Description |
|---|---|
| Market Value (2025) | USD 254.5 Million |
| Forecast Revenue (2035) | USD 724.6 Million |
| CAGR (2026-2035) | 11.0% |
| Base Year for Estimation | 2025 |
| Historic Period | 2020-2024 |
| Forecast Period | 2026-2035 |
| Report Coverage | Revenue Forecast, Market Dynamics, Competitive Landscape, Recent Developments |
| Segments Covered | By Computing Type (Data Acquisition and Preprocessing, AI Inference Computing, Edge Computing and Real-Time Analytics, Autonomous Navigation and Task Decision Computing, Others); By Service (Defense and Security, Space and Commercial Spaceflight, Scientific Research, Others) |
| Regional Analysis | North America – US, Canada; Europe – Germany, France, The UK, Spain, Italy, Rest of Europe; Asia Pacific – China, Japan, South Korea, India, Australia, Singapore, Rest of APAC; Latin America – Brazil, Mexico, Rest of Latin America; Middle East & Africa – GCC, South Africa, Rest of MEA |
| Competitive Landscape | Aetherflux, Aethero, Axiom Space, D-Orbit, OrbitsEdge, Planet, SpaceX, Starcloud |
| Customization Scope | Customization for segments and region/country-level will be provided. Moreover, additional customization can be done based on the requirements. |
| Purchase Options | We have three licenses to opt for: Single User License, Multi-User License (Up to 5 Users), Corporate Use License (Unlimited Users and Printable PDF) |