
North America Visual Computing Market Size, Share Analysis Report Market By Component (Hardware (GPUs, Cameras, Sensors, Processors, Display Panel, Others), Software (On-Premise, Cloud-Based, Services)), By Display Platform (Interactive Kiosk, Interactive Video Wall, Interactive Monitor, Interactive Whiteboard, Interactive Table, Others), By Technology (Machine Learning/Deep Learning, 3D Rendering, Augmented Reality (AR)/Virtual Reality (VR), Computer Vision, Others), By End-Use Industry (Consumer Electronics/Individual, Automotive, Healthcare, Retail & E-commerce, Defense & Aerospace, Media & Entertainment, IT & Telecom, Others), Companies - Industry Segment Outlook, Market Assessment, Competition Scenario, Trends and Forecast 2025-2034
- Published date: March 2025
- Report ID: 143340
- Number of Pages: 322
- Format:
-
keyboard_arrow_up
Quick Navigation
- Report Overview
- Key Takeaways
- Analysts’ Viewpoint
- US Visual Computing Market
- Component Analysis
- Display Platform Analysis
- Technology Analysis
- End-Use Industry Analysis
- Report Segmentation
- Driver
- Restraint
- Opportunity
- Challenge
- Growth Factors
- Emerging Trends
- Business Benefits
- Key Player Analysis
- Recent Developments
- Report Scope
Report Overview
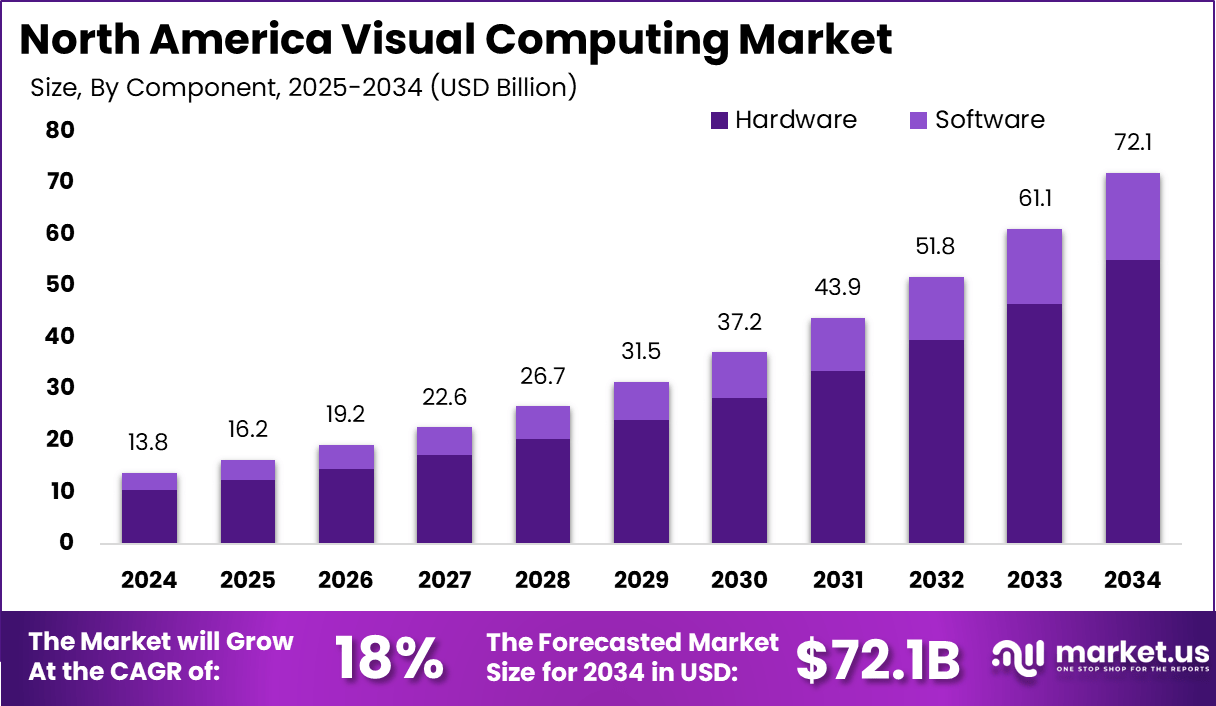
The North America Visual Computing Market size is expected to be worth around USD 72.1 Billion By 2034, from USD 13.8 billion in 2024, growing at a CAGR of 18% during the forecast period from 2025 to 2034. The US Visual Computing Market Size was exhibited at USD 12.76 Billion in 2024 with CAGR of 17.8%.
Visual computing refers to the integration of computer graphics, image processing, visualization, and human-computer interaction technologies that enable the creation and management of visual data. In North America, the visual computing market leverages these technologies across various sectors such as entertainment, healthcare, automotive, and defense to enhance digital experiences and operational efficiencies.
The North America visual computing market is experiencing substantial growth driven by the increasing demand for enhanced visual displays and interactive technologies. With a strong presence of key industry players and a robust technological infrastructure, the market is poised to expand as applications in virtual reality, augmented reality, and artificial intelligence continue to evolve.
The expansion of the visual computing market is significantly driven by escalating internet penetration, which enhances connectivity and fosters advancements in computer vision technologies. This growth facilitates a plethora of applications across diverse sectors including online connectivity, digital services, and AR, thereby enhancing user experiences and broadening digital capabilities
The demand in the North American visual computing market is characterized by a strong preference for high-performance computing solutions and real-time visual processing capabilities. Industries such as gaming, automotive, and entertainment are key demand drivers, with a growing emphasis on user experience and interactive interfaces.
According to Market.us, The global visual computing market is expected to expand significantly, reaching USD 182.1 billion by 2033, up from USD 27.3 billion in 2023, driven by a CAGR of 20.9% from 2024 to 2033. In 2023, North America accounted for 36% of the market, benefiting from strong technological infrastructure and rising demand for advanced computing solutions.
Businesses in North America leverage visual computing technologies to enhance decision-making, improve customer engagement, and optimize operational processes. The use of visual data in training machine learning models and in simulations provides businesses with competitive advantages in terms of efficiency and accuracy.
Key Takeaways
- The North America visual computing market is poised for substantial expansion over the next decade. The market, valued at USD 13.8 billion in 2024, is projected to reach approximately USD 72.1 billion by 2034, growing at a CAGR of 18% during the forecast period from 2025 to 2034.
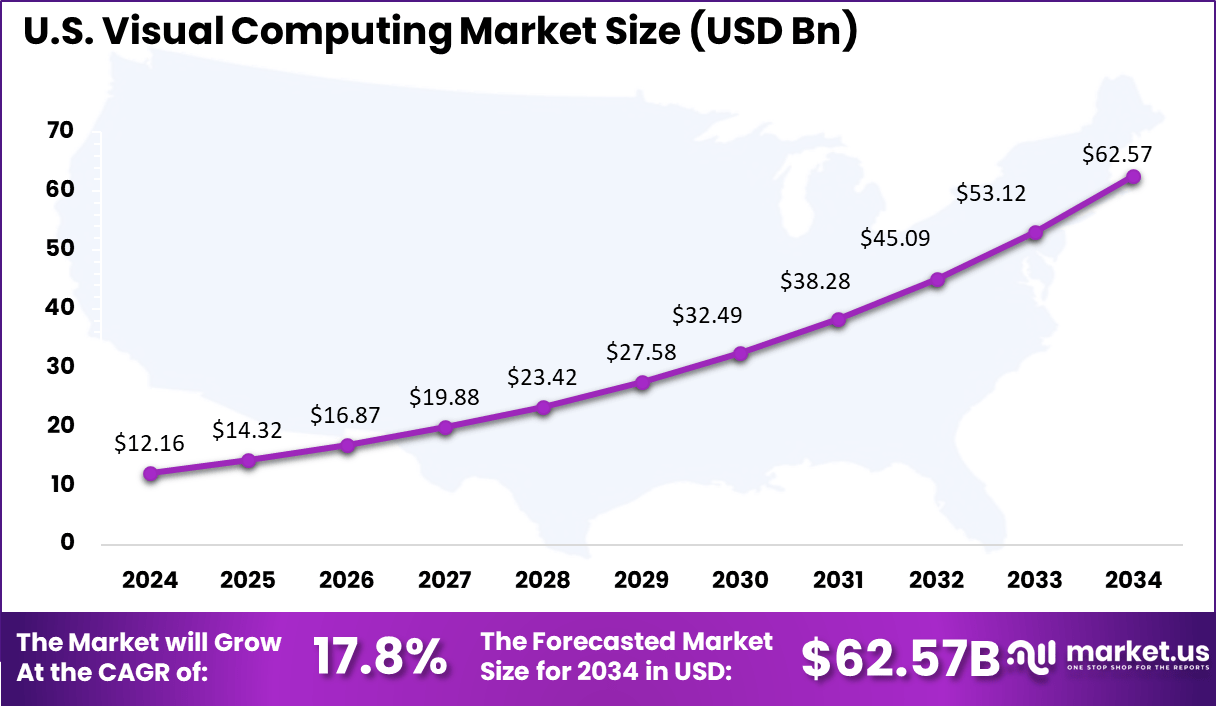
- The United States remains the dominant force in the North American visual computing industry. In 2024, the U.S. market was valued at USD 12.16 billion and is set for remarkable growth.
- Projections indicate that the market will expand from USD 14.32 billion in 2025 to around USD 62.57 billion by 2034, recording a CAGR of 17.8% from 2025 to 2034.
- In 2024, the hardware segment held a commanding position, accounting for more than 76.4% of the total market share.
- Interactive kiosks have gained significant traction across industries. In 2024, this segment captured more than a 50% share of the North American visual computing market, reflecting strong adoption in retail, healthcare, and banking sectors.
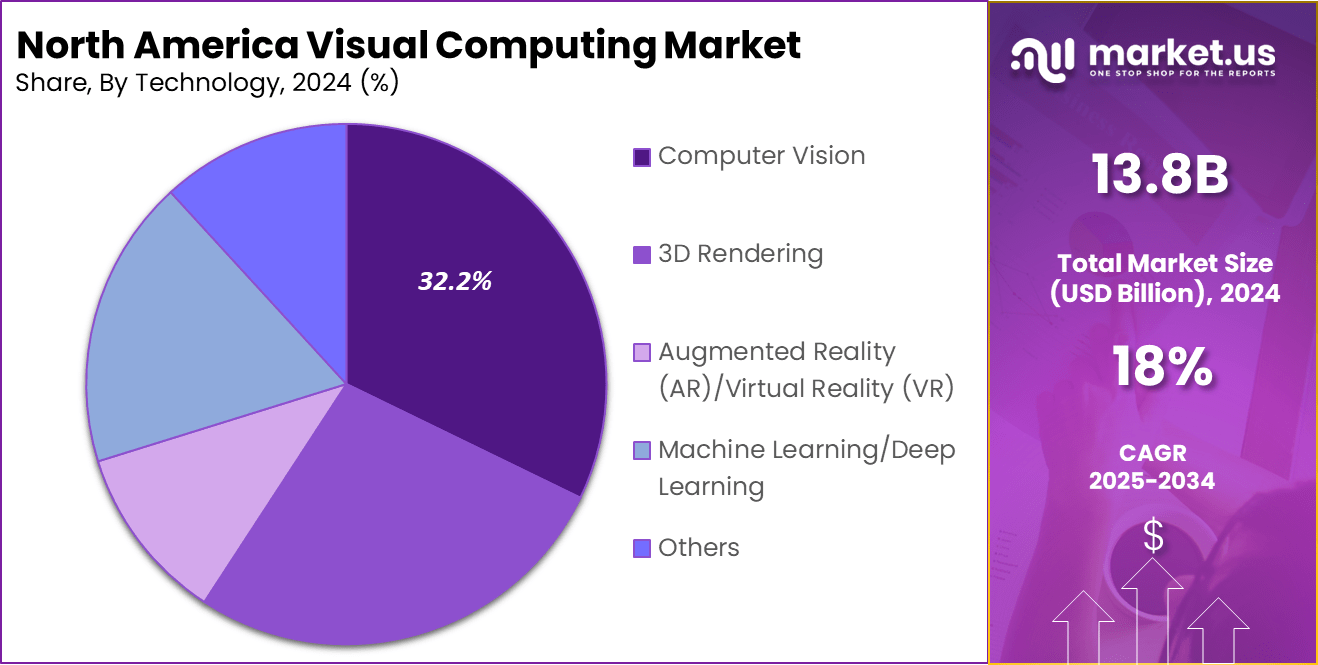
- The computer vision segment accounted for over 32.2% of the total market share in 2024.
- Among end-user industries, IT & Telecom held a leading position, capturing more than 37.5% of the market share in 2024.
- GPUs and Processors are experiencing growth, increasing from 13.6% to 15.4% and 17.3% to 18.2%, respectively.
- Display Panels are slowly declining, reducing from 37.2% in 2019 to 35.7% in 2024.
- Software’s market share is slightly decreasing, moving from 14.6% to 14.0%.
- Cloud-Based solutions are growing, increasing from 20.5% to 21.3%, indicating a shift towards cloud adoption.
- Services are expanding gradually, growing from 8.9% in 2019 to 9.6% in 2024.
Analysts’ Viewpoint
Investment opportunities in the visual computing sector of North America are huge, particularly in areas involving augmented and virtual reality technologies. Investors are also showing keen interest in startups that are innovating in AI-driven graphics and visualization tools, offering substantial returns on investment due to the scalable nature of visual computing applications.
Recent technological advancements in the visual computing market include the development of more efficient graphic processing units (GPUs), enhanced virtual and augmented reality applications, and the integration of AI for smarter image processing. These advancements are setting new standards for visual quality and interactive experiences.
The regulatory environment for visual computing in North America is primarily concerned with data privacy and the ethical use of AI technologies. Regulations and standards are being developed to ensure that visual computing technologies are used responsibly, particularly in sensitive sectors such as healthcare and public security.
US Visual Computing Market
The U.S. Visual Computing Market was valued at USD 12.16 billion in 2024 and is set for substantial growth in the coming years. The market is projected to expand from USD 14.32 billion in 2025 to approximately USD 62.57 billion by 2034, registering a CAGR of 17.8% from 2025 to 2034.
This growth is driven by increasing demand for AI-powered graphics, real-time rendering, and advanced visualization technologies across industries such as gaming, healthcare, automotive, and digital content creation.
The rising adoption of AR/VR, deep learning, and 3D imaging solutions is accelerating the market’s expansion, with companies investing heavily in high-performance GPUs and AI-driven visual computing applications. As industries continue to integrate advanced computing for simulations, automation, and immersive experiences, the market is expected to witness strong momentum.
Component Analysis
In 2024, the hardware segment of the North America visual computing market held a dominant position, capturing more than 76.4% of the market share. This leadership can be attributed to several key factors that underscore the essential role of hardware in visual computing applications.
Firstly, the demand for high-performance computing solutions, particularly in graphics processing units (GPUs), has been a significant driver. GPUs are crucial for rendering complex graphics and enhancing the performance of visual computing applications, from gaming and entertainment to professional design and simulation.
The continuous advancements in GPU technology, along with innovations in other hardware components like vision processing units (VPUs), field-programmable gate arrays (FPGAs), and advanced sensors, collectively propel the hardware segment’s growth.
North America Visual Computing Market, By Component Analysis, 2019-2024 (%)
By Component 2019 2020 2021 2022 2023 2024 Hardware 76.5% 76.5% 76.4% 76.4% 76.4% 76.4% GPUs 13.6% 13.9% 14.3% 14.7% 15.0% 15.4% Cameras 7.5% 7.5% 7.4% 7.4% 7.4% 7.4% Sensors 9.7% 9.8% 9.8% 9.9% 9.9% 10.0% Processors 17.3% 17.4% 17.6% 17.8% 18.0% 18.2% Display Panel 37.2% 36.9% 36.6% 36.3% 36.0% 35.7% Others 14.8% 14.5% 14.2% 13.9% 13.6% 13.4% Software 14.6% 14.5% 14.3% 14.2% 14.1% 14.0% On-Premise 79.5% 79.4% 79.2% 79.1% 78.9% 78.7% Cloud-Based 20.5% 20.6% 20.8% 20.9% 21.1% 21.3% Services 8.9% 9.1% 9.2% 9.4% 9.5% 9.6% Furthermore, the integration of artificial intelligence (AI) in hardware to improve the capabilities of visual computing systems has been pivotal. AI-driven hardware is increasingly used in various applications, such as AI-enhanced image processing, which optimizes and automates tasks including object detection and image recognition.
This integration enhances the accuracy, speed, and scalability of visual computing systems, making hardware an indispensable component of the visual computing ecosystem. Moreover, the adoption of immersive technologies like augmented reality (AR) and virtual reality (VR), which rely heavily on robust hardware for seamless and engaging user experiences, has expanded the scope and demand for advanced hardware solutions.
Display Platform Analysis
In 2024, the interactive kiosk segment in the North America visual computing market held a commanding position, capturing more than a 50% share. This dominant market share is largely due to the kiosk’s ability to enhance user experience by integrating various visual computing technologies such as touchscreens, gesture recognition, facial recognition, augmented reality (AR), and virtual reality (VR).
These technologies not only improve customer engagement but also streamline operations and deliver personalized services across diverse sectors including retail, hospitality, healthcare, and transportation. The expansion of the interactive kiosk market is further propelled by its adoption in a wide array of applications.
In retail settings, for instance, interactive kiosks provide self-service options that reduce wait times and improve customer satisfaction by allowing for quick checkouts and easy product searches. This utility is extending into other areas like financial services and travel, where kiosks handle tasks ranging from ticketing to financial transactions, significantly improving service delivery and operational efficiency.
North America Visual Computing Market, By Display Platform Analysis, 2019-2024 (%)
By Display Platform 2019 2020 2021 2022 2023 2024 Interactive Kiosk 51.4% 51.1% 50.8% 50.5% 50.3% 50.0% Interactive Video Wall 19.9% 20.1% 20.3% 20.6% 20.8% 21.1% Interactive Monitor 2.7% 2.7% 2.7% 2.6% 2.6% 2.6% Interactive Whiteboard 4.2% 4.3% 4.4% 4.4% 4.5% 4.6% Interactive Table 2.5% 2.4% 2.4% 2.3% 2.3% 2.3% Others 19.4% 19.4% 19.4% 19.4% 19.5% 19.5% Moreover, the technological infrastructure in North America, coupled with high consumer demand for self-service solutions, supports the widespread adoption of interactive kiosks. This is complemented by substantial investments in smart city projects across the region, which integrate these kiosks into public spaces for information dissemination and public service delivery, thereby driving further growth in this market segment.
Technology Analysis
In 2024, the Computer Vision segment in the North America visual computing market held a dominant position, capturing more than a 32.2% share. This leadership is primarily driven by the segment’s critical role in enhancing automated technologies across various industries, including manufacturing, healthcare, and retail.
The integration of artificial intelligence (AI) with computer vision technologies has significantly boosted the capabilities of systems to perform complex tasks such as image recognition, quality control, and real-time decision-making, which are essential for the automation and efficiency of industrial operations.
The growth of the Computer Vision segment is further propelled by its extensive application in quality assurance and inspection processes across manufacturing and other sectors. These applications benefit from computer vision’s ability to perform detailed inspections and measurements at high speeds, improving productivity and compliance with quality standards.
North America Visual Computing Market, By Technology Analysis, 2019-2024 (%)
By Technology 2019 2020 2021 2022 2023 2024 Machine Learning/Deep Learning 17.2% 17.5% 17.8% 18.1% 18.4% 18.7% 3D Rendering 15.9% 15.7% 15.6% 15.4% 15.2% 15.0% Augmented Reality (AR)/Virtual Reality (VR) 24.8% 24.8% 24.7% 24.7% 24.7% 24.7% Computer Vision 31.4% 31.6% 31.7% 31.9% 32.0% 32.2% Others 10.7% 10.4% 10.2% 9.9% 9.7% 9.5% Additionally, the rise of AI and machine learning technologies has enabled more sophisticated image and video analysis capabilities, making computer vision systems even more integral to modern industrial and non-industrial applications.
Moreover, the adaptation of computer vision in the healthcare sector for medical diagnostics and surgical assistance, as well as in retail for enhancing customer experiences through cashier-less checkout systems and personalized shopping recommendations, underscores its broad utility and impact.
End-Use Industry Analysis
In 2024, the IT & Telecom segment held a dominant market position in the North America visual computing market, capturing more than a 37.5% share. This leading position can be attributed to several key factors that underscore the vital role of visual computing in IT and telecommunications.
Firstly, the rapid adoption of advanced AI and cloud computing technologies across North America has been a significant driver. These technologies enhance data processing capabilities and network management, essential for the growing demands of IT infrastructure and services.
Additionally, the ongoing digital transformation across various industries fuels the need for robust computing solutions that can handle vast amounts of visual data efficiently and effectively. Moreover, visual computing plays a crucial role in optimizing network operations and improving customer service within the telecom sector.
North America Visual Computing Market, By End-Use Industry Analysis, 2019-2024 (%)
By End-Use Industry 2019 2020 2021 2022 2023 2024 Consumer Electronics/Individual 4.7% 4.7% 4.7% 4.7% 4.7% 4.7% Automotive 5.4% 5.4% 5.3% 5.3% 5.2% 5.1% Healthcare 9.2% 9.0% 8.9% 8.7% 8.6% 8.5% Retail & E-commerce 15.5% 15.8% 16.0% 16.3% 16.6% 16.9% Defense & Aerospace 4.0% 3.9% 3.8% 3.7% 3.6% 3.5% Media & Entertainment 12.5% 12.6% 12.6% 12.7% 12.8% 12.9% IT & Telecom 38.5% 38.3% 38.1% 37.9% 37.7% 37.5% Others 10.3% 10.4% 10.6% 10.7% 10.8% 10.9% Advanced visualization tools help in monitoring network performance and managing traffic, which is critical for maintaining system integrity and enhancing user experiences. The integration of AI with visual computing also allows for predictive maintenance and real-time problem-solving, further boosting operational efficiency.
Report Segmentation
By Component
- Hardware
- GPUs
- Cameras
- Sensors
- Processors
- Display Panel
- Others
- Software
- On-Premise
- Cloud-Based
- Services
By Display Platform
- Interactive Kiosk
- Interactive Video Wall
- Interactive Monitor
- Interactive Whiteboard
- Interactive Table
- Others
By Technology
- Machine Learning/Deep Learning
- 3D Rendering
- Augmented Reality (AR)/Virtual Reality (VR)
- Computer Vision
- Others
By End-Use Industry
- Consumer Electronics/Individual
- Automotive
- Healthcare
- Retail & E-commerce
- Defense & Aerospace
- Media & Entertainment
- IT & Telecom
- Others
Driver
Expansion of AI and Machine Learning
The growth of the visual computing market in North America is primarily driven by the extensive integration of artificial intelligence (AI) and machine learning (ML) technologies across various industries. These technologies enhance the capabilities of visual computing systems, enabling more sophisticated image and video analysis applications.
The automation of complex processes such as object detection, image recognition, and real-time video analysis not only boosts efficiency but also improves the accuracy and speed of data processing tasks. This technological advancement supports a wide array of applications from automotive ADAS systems to interactive consumer services and healthcare diagnostics, fostering significant market growth.
Restraint
High Cost of Advanced Visual Computing Technologies
One major restraint in the visual computing market is the high cost associated with advanced technologies. The development and implementation of cutting-edge visual computing systems require substantial investment in high-performance computing hardware, sophisticated software, and skilled personnel.
These costs can be prohibitively high, especially for small and medium-sized enterprises (SMEs) or sectors with limited budgets. Additionally, the ongoing maintenance and necessary upgrades to keep up with technological advancements add further financial burden, potentially slowing the adoption rate of new visual computing technologies across less affluent markets.
Opportunity
Growing Demand for Enhanced Consumer Experience
The increasing consumer demand for enhanced interactive experiences presents significant opportunities in the visual computing market. As users seek more immersive and personalized interactions, industries such as retail, entertainment, and tourism are leveraging visual computing technologies to meet these expectations.
For instance, augmented reality (AR) and virtual reality (VR) are being used to create engaging shopping experiences and interactive entertainment options. This trend not only helps businesses attract and retain customers but also opens up new avenues for revenue through innovative service offerings.
Challenge
Ethical and Privacy Concerns
A considerable challenge facing the visual computing market is addressing the ethical and privacy issues associated with the deployment of these technologies. As visual computing often involves the processing of personal data, particularly in applications like surveillance and personalized advertising, there are significant concerns about data security and user privacy.
Ensuring compliance with stringent data protection regulations and managing public perception about privacy intrusions are critical for businesses. These challenges require careful navigation and the implementation of robust security measures to maintain consumer trust and market stability.
Growth Factors
The North America visual computing market is experiencing significant growth due to several key factors. Primarily, the integration of artificial intelligence (AI) and machine learning (ML) technologies is revolutionizing the capabilities of visual computing systems.
These technologies enhance the accuracy, speed, and efficiency of image and video processing, which is crucial across various applications from automotive to healthcare. This trend is supported by the increasing computational power and advancements in GPUs and dedicated visual processing units, which are essential for handling complex visual data in real-time.
Additionally, the demand for immersive user experiences in sectors such as gaming, media, and entertainment is driving the need for sophisticated visual computing solutions. As consumers seek more engaging and realistic interactions, industries are leveraging visual computing to create detailed and interactive environments. This is not only enhancing user engagement but also opening new avenues for content delivery and interaction.
Emerging Trends
Emerging trends in the visual computing sector include the growing adoption of cloud-based visual computing services, which offer scalable resources for complex visual processing tasks. This shift is enabling businesses to handle larger datasets and more sophisticated simulations without the need for extensive on-premise hardware.
Furthermore, advancements in AR and VR technologies are pushing the boundaries of how visual content is integrated and interacted with in various fields, from real estate to virtual training environments. The rise of edge computing is also playing a significant role by facilitating faster processing times and reducing latency, which is crucial for applications requiring instant data processing, such as in autonomous vehicles or real-time medical diagnostics.
Business Benefits
The adoption of visual computing technologies offers substantial business benefits, enhancing operational efficiency and creating new market opportunities. For instance, in healthcare, visual computing aids in the detailed analysis of medical imaging, improving diagnostic accuracy and patient outcomes.
In the automotive sector, it supports the development of ADAS systems, enhancing vehicle safety and driving the progression towards fully autonomous vehicles. In retail and ecommerce, visual computing enables the creation of virtual showrooms and fitting rooms, enhancing customer experience and satisfaction by allowing consumers to try products virtually before purchasing.
Key Player Analysis
In the dynamic landscape of the North America Visual Computing market, key players have been actively shaping their competitive edge through strategic acquisitions, new product launches, and mergers.
Companies like Nvidia, Intel, and Advanced Micro Devices (AMD) have maintained their dominance not only through continuous innovation in graphics processing units (GPUs) and AI technologies but also through strategic market maneuvers that enhance their offerings and market reach.
For instance, Nvidia has leveraged acquisitions to broaden its capabilities in AI and deepen its market penetration across various industries. This strategy ensures they stay at the forefront of technological advancements while expanding their customer base. Similarly, Intel has focused on expanding its product line and entering new markets, aiming to diversify its portfolio and strengthen its presence in the visual computing sphere.
Moreover, these companies are not just expanding through acquisitions but also pushing the envelope with new product developments. Innovations in AI-driven visual processing and advanced hardware like ray-tracing GPUs are regularly introduced, catering to the growing demand for high-performance computing across sectors such as gaming, automotive, and healthcare.
Top Key Players in the Market
- Samsung
- SONY
- LG
- Microsoft
- NVIDIA Corporation
- BenQ
- AMD
- Arm
- Shenzhen Horion Intelligent Technology Co., Ltd
- Smart Technologies ULC
- Boxlight
- Others
Recent Developments
- Samsung has increased its stake in NVIDIA, investing $181 million in early 2025. This move underscores Samsung’s commitment to strengthening its position in the visual computing sector and enhancing its technological capabilities.
- In 2024, Cisco completed its acquisition of Splunk, a significant deal in the tech industry that could enhance Cisco’s capabilities in data analytics and security, potentially impacting visual computing applications.
Report Scope
Report Features Description Market Value (2024) USD 13.8 Bn
Forecast Revenue (2034) USD 72.1 Bn CAGR (2025-2034) 18% Base Year for Estimation 2024 Historic Period 2020-2023 Forecast Period 2025-2034 Report Coverage Revenue forecast, AI impact on market trends, Share Insights, Company ranking, competitive landscape, Recent Developments, Market Dynamics and Emerging Trends Segments Covered By Component (Hardware (GPUs, Cameras, Sensors, Processors, Display Panel, Others), Software (On-Premise, Cloud-Based, Services)), By Display Platform (Interactive Kiosk, Interactive Video Wall, Interactive Monitor, Interactive Whiteboard, Interactive Table, Others), By Technology (Machine Learning/Deep Learning, 3D Rendering, Augmented Reality (AR)/Virtual Reality (VR), Computer Vision, Others), By End-Use Industry (Consumer Electronics/Individual, Automotive, Healthcare, Retail & E-commerce, Defense & Aerospace, Media & Entertainment, IT & Telecom, Others) Competitive Landscape Samsung, SONY, LG, Microsoft, NVIDIA Corporation, BenQ, AMD, Arm, Shenzhen Horion Intelligent Technology Co., Ltd, Smart Technologies ULC, Boxlight, Others Customization Scope Customization for segments, region/country-level will be provided. Moreover, additional customization can be done based on the requirements. Purchase Options We have three license to opt for: Single User License, Multi-User License (Up to 5 Users), Corporate Use License (Unlimited User and Printable PDF)  North America Visual Computing MarketPublished date: March 2025add_shopping_cartBuy Now get_appDownload Sample
 -
-
- Samsung
- SONY
- LG
- Microsoft
- NVIDIA Corporation
- BenQ
- AMD
- Arm
- Shenzhen Horion Intelligent Technology Co., Ltd
- Smart Technologies ULC
- Boxlight
- Others
Our Clients
- 143340
- March 2025


