


Report Overview
In 2025, the Global Mobile AI Agent Market was valued at USD 2.5 billion. The market is projected to grow at a CAGR of 46.0% during 2026–2035, reaching approximately USD 110.0 billion by 2035. North America dominated the global market in 2025, accounting for more than 40.3% of the total market share and generating approximately USD 1.01 billion in revenue.
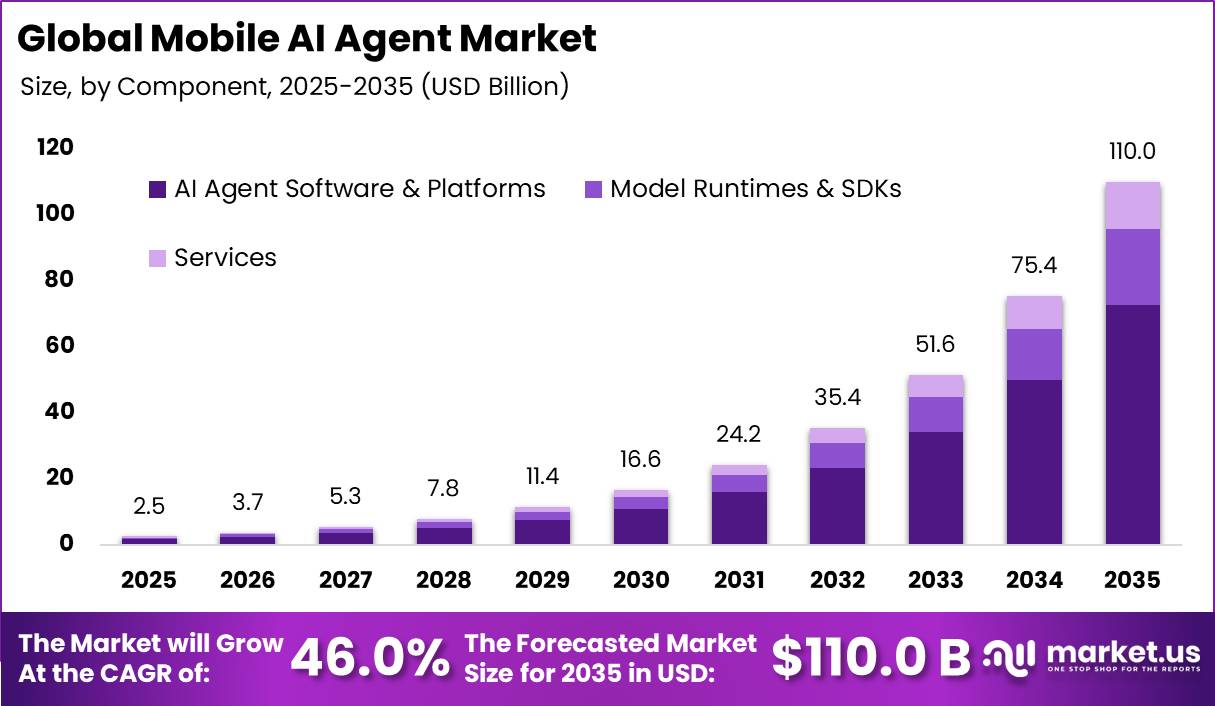
Market growth is supported by the rapid increase in smartphone use and mobile internet access, which provide the main platform for AI agents. Global mobile-cellular subscriptions reached 9.1 billion in 2024, exceeding the world population by 12.1%. Mobile broadband subscriptions have also increased by an average of 5% annually over the past five years, nearly five times faster than basic mobile subscriptions.
In addition, 5.5 billion people, or 68% of the global population, were online, up from 65% one year earlier. This expanding connected population increases the potential user base for mobile AI agents used in scheduling, shopping, customer support, and other daily activities. The broader digital economy is also creating strong demand for mobile AI solutions.
According to the World Bank, the digital economy contributes more than 15% of global GDP, equal to nearly USD 16 trillion of the USD 108 trillion global economy in 2024, and has grown 2.5 times faster than the physical economy over the past decade. IT services value added increased by 8% annually between 2000 and 2022, nearly twice the global economic growth rate, while employment grew at six times the global average.
Key Takeaway
- The Mobile AI Agent Market was valued at USD 2.5 billion in 2025 and is projected to reach USD 110.0 billion by 2035, growing at a CAGR of 46.0%.
- AI Agent Software and Platforms dominated the Component segment with a 66.1% share in 2025.
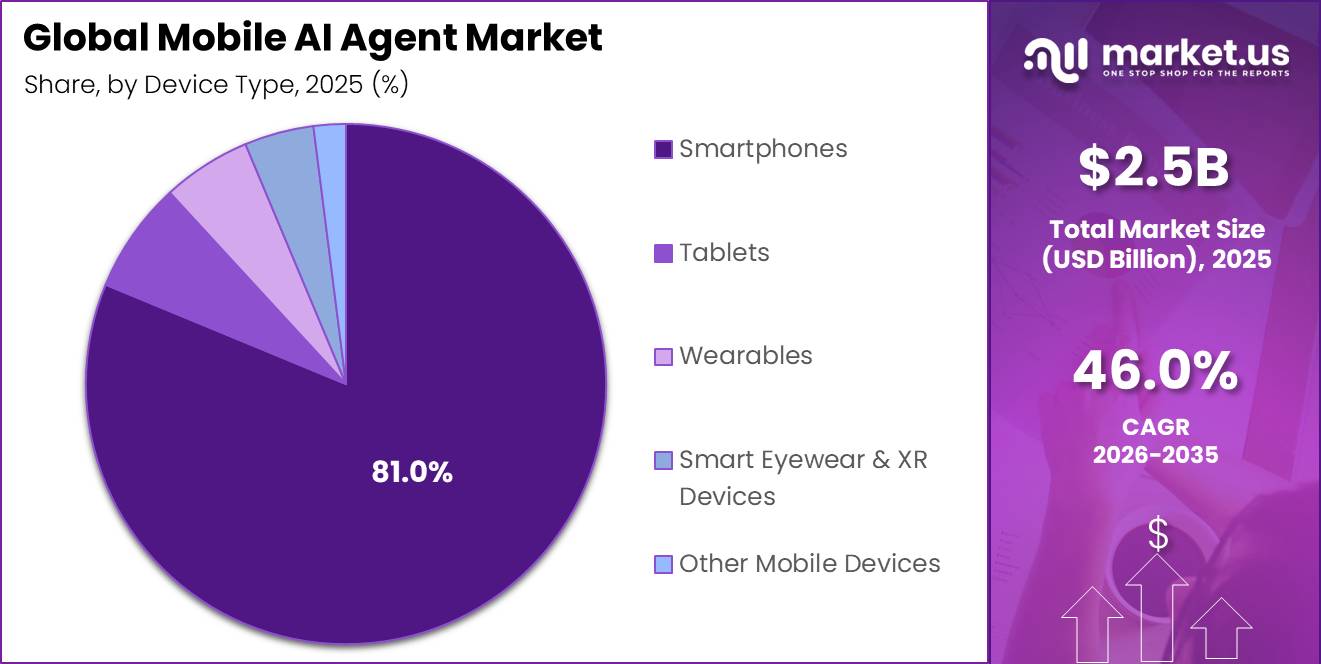
- Smartphones led the Device Type segment with more than 81% share, supported by processing power, sensors, and connectivity.
- The Hybrid Device-Cloud model held more than 60.5% share of the Deployment Model segment.
- Personal and Productivity Agents dominated the Agent Type segment with more than 36.0% share.
- Small and Compact Language Models led the Model Type segment with more than 41.0% share due to device power and battery constraints.
- Multimodal AI Agents captured more than 46.1% share of the Modality segment.
- Android led the Operating System segment with more than 62.1% share, supported by a global user base exceeding 3.9 billion active users.
- Personal Productivity led the Application segment with more than 31.25% share.
- Consumers dominated the End User segment with more than 68.1% share.
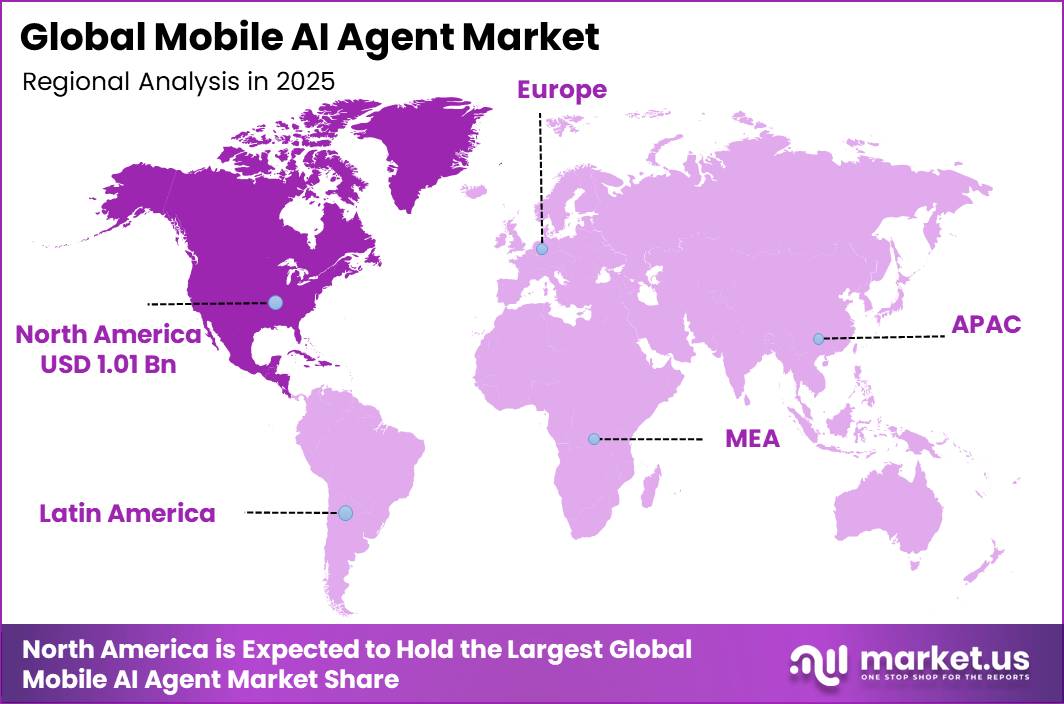
- North America led the market in 2025 with more than 40.3% share and approximately USD 1.01 billion in revenue.
Market Statistics and Data Insights
- ITU estimated that around 6.0 billion people were using the internet in 2025, up by more than 240 million in one year from 5.8 billion in 2024. Around 2.2 billion people remained offline.
- Around 3 billion 5G subscriptions were active worldwide in 2025, representing roughly one-third of all mobile-broadband subscriptions. 5G networks covered 55% of the world’s population.
- The 5G access gap remains large: coverage reached 84% of people in high-income economies but only 4% in low-income economies. A typical high-income user also generated nearly 8 times as much mobile data as a low-income user.
- Samsung reported in January 2026 that Galaxy AI was available on more than 400 million devices worldwide. Around 80% of users had tried Galaxy AI features and more than two-thirds were using them regularly.
- Samsung’s 2026 U.S. survey of 2,000 adults found that 90% of Americans were already using AI features on their phones, but only 38% realized they were doing so.
- Common AI-enabled smartphone activities reported by U.S. consumers included weather alerts at 42%, call screening at 35%, autocorrect at 34%, voice assistants at 26%, and automatic screen brightness at 25%. AI-powered Night Mode was regularly used by 19%, while 20% used automatically generated photo slideshows.
- Google’s Gemini app exceeded 1 billion monthly active users by August 2026. Around 63% of users interacted directly with Gemini through voice, while more than 100 million active Gemini users were on iOS.
- Around 1 in 5 Gemini Live interactions involved more than voice, with people using live camera feeds or screen sharing. Gemini could also automate actions across more than 40 popular Android apps as of August 2026.
- More than one-third of individuals across OECD economies used generative AI tools in 2025. Usage reached roughly 75% among students aged 16 and older, 41.1% among employed people, and 36.7% among unemployed people.
- The ICT industry had the highest AI adoption rate across available OECD economies at 57.3% in 2025, followed by professional and scientific services at 36.8%.
- Apple’s 2025 on-device foundation model contains approximately 3 billion parameters and is designed specifically for Apple silicon. Apple also operates a larger server model through Private Cloud Compute, demonstrating the hybrid device-cloud architecture being adopted for mobile AI.
- Qualcomm’s Snapdragon 8 Gen 5 Hexagon NPU provides up to 46.0% higher AI performance. The platform also delivers 36% higher CPU performance and up to 13% overall power savings, directly supporting more AI processing on smartphones rather than fully in the cloud.
- World Bank Findex data show that 86% of adults worldwide owned a mobile phone in 2024 and 68% owned a smartphone. About 900 million adults without financial accounts nevertheless owned a mobile phone, including 530 million who owned smartphones.
By Component
In 2025, the AI Agent Software and Platforms segment held a dominant market position, capturing a 66.1% share. Software platforms form the main operating layer of mobile AI agents, allowing them to understand user requests, process information, learn context, and complete tasks. Hardware and support services mainly provide the infrastructure needed to deliver these capabilities.
The continued expansion of the global digital-services economy further supports this segment. Digitally delivered services accounted for around 25% of total global services trade by 2020, reflecting the growing use of cloud platforms and software-based business solutions. Software demand has also remained strong across major developed economies.
U.S. computer-services exports increased at an average annual rate of 14.3% between 2010 and 2017, indicating sustained investment in digital and software infrastructure. In the European Union, other business and digital-services exports reached approximately EUR 385 billion in 2024, highlighting the large economic value generated through connected service platforms.
| By Component | Segment Shares |
|---|---|
| AI Agent Software and Platforms | 66.1% |
| Model Runtimes and SDKs | 20.9% |
| Services | 13.2% |
By Device Type
In 2025, Smartphones held a dominant position in the Device Type segment, capturing more than an 81.1% share. Smartphones remain the main device for mobile AI agents because they combine strong processing power, built-in sensors, mobile applications, and continuous internet access. Global smartphone shipments reached 1,223.1 million units in 2024, increasing 7.1% from 1,141.9 million units in 2023, marking the strongest shipment growth since 2021.
| By Device Type | Segment Shares |
|---|---|
| Smartphones | 81.1% |
| Tablets | 6.9% |
| Wearables | 5.5% |
| Smart Eyewear and XR Devices | 4.3% |
| Other Mobile Devices | 2.0% |
Mobile ownership also continues to expand, with four out of five people worldwide aged 10 and above now owning a mobile phone. At the same time, global 5G connections were expected to reach 2 billion by the end of 2024, representing nearly one-quarter of all mobile connections. The expansion of 5G-supported smartphones provides faster connectivity and stronger computing capabilities for AI applications.
By Deployment Model
In 2025, the Hybrid Device-Cloud model held a dominant market position, capturing more than a 60.5% share. This model is gaining preference because it balances the limited processing capacity of mobile devices with the high computing power available in cloud infrastructure. According to the IEA, global data centre investment nearly doubled since 2022 and reached around USD 500 billion in 2024.
Data centre electricity consumption also increased to about 415 TWh, representing nearly 1.5% of global electricity use, while power demand from data centres has grown by around 12% annually since 2017. These infrastructure and energy pressures make fully cloud-based AI processing more expensive and resource-intensive.
Stronger 5G coverage also supports this model. Around 55% of the global population is covered by 5G networks, compared with only 40% of rural populations. This uneven network availability makes hybrid architecture more practical, as mobile AI agents can continue basic functions on-device and use cloud processing when reliable high-speed connectivity is available.
| By Deployment Model | Segment Shares |
|---|---|
| Fully On-Device/Local | 24.8% |
| Hybrid Device-Cloud | 60.5% |
| Cloud-Connected | 14.7% |
By Agent Type
In 2025, Personal and Productivity Agents held a dominant market position, capturing more than a 36.0% share. Their strong position is supported by the large amount of time people spend on work, communication, scheduling, and routine administrative tasks. According to the ILO, average global weekly working time reached approximately 42 hours per employed person in 2024, while the global labour force increased to around 3.7 billion people.
In the United States, full-time employees spent an average of 8.4 hours working on weekdays, according to the 2024 American Time Use Survey. This creates regular demand for tools that can manage calendars, prepare drafts, organize tasks, send reminders, and support daily communication. Hybrid working patterns are also increasing the need for digital productivity tools, with around 38% of U.S. firms operating structured hybrid work models.
| By Agent Type | Segment Shares |
|---|---|
| Personal and Productivity Agents | 36.0% |
| Search and Knowledge Agents | 14.9% |
| Communication Agents | 12.0% |
| Commerce and Transaction Agents | 10.5% |
| Content and Creative Agents | 9.5% |
| Device Automation Agents | 9.0% |
| Other Agents | 8.1% |
By Model Type
In 2025, Small and Compact Language Models held a dominant market position, capturing more than a 41.0% share. Their strong position is supported by the limited processing power, battery capacity, and energy availability of smartphones. Most smartphone batteries typically have capacities of around 4,000–5,000 mAh, while annual smartphone electricity consumption in the EU is estimated at only about 4 kWh per device.
These limits make smaller and more efficient AI models better suited for continuous mobile use than large language models. Energy constraints are also becoming important for cloud-based AI processing. Global data-centre electricity consumption reached approximately 415 TWh in 2024, equal to around 1.5% of worldwide electricity use.
The IEA has also indicated that grid connection delays for new data-centre capacity can extend from four to eight years. At the same time, semiconductor companies operating within the USD 611 billion industry in 2024 continue to focus on smaller and more energy-efficient chips. These hardware, battery, and power limitations support the wider adoption of compact language models for mobile AI agents.
| By Model Type | Segment Shares |
|---|---|
| Small and Compact Language Models | 41.0% |
| Small Multimodal Models | 18.5% |
| Vision-Language Models | 16.0% |
| Specialized/Domain Models | 13.5% |
| Other Models | 11.0% |
By Modality
In 2025, Multimodal AI Agents held a dominant market position, capturing more than a 46.1% share. Their strong position is supported by the way smartphone users interact through text, voice, cameras, and touch within the same device. Multimodal agents can process several types of information together, making them more useful than systems limited to a single input method.
According to WIPO, generative AI patent families related to image and video technologies reached nearly 18,000 between 2014 and 2023, expanding at an average annual rate of around 45%, the fastest growth among major GenAI categories. This rapid patent activity reflects continued improvements in combining visual understanding with language processing. Smartphones also account for approximately 92.5% of all photographs taken worldwide.
Around 1.8 trillion images are captured annually, equal to nearly 5 billion images every day. This large volume of visual content increases the need for AI agents that can understand images alongside text and voice. As smartphone users increasingly combine cameras, microphones, touchscreens, and messaging, multimodal AI agents are expected to maintain their leading market position.
| By Modality | Segment Shares |
|---|---|
| Text | 17.5% |
| Voice and Audio | 21.0% |
| Image/Vision | 15.4% |
| Multimodal | 46.1% |
By Operating System
In 2025, Android held a dominant position in the Operating System segment, capturing more than a 62.1% share. Its strong position is mainly supported by an open licensing model that allows smartphone manufacturers to offer Android devices across different price ranges. According to StatCounter, Android accounted for around 67.61% of global mobile operating system usage as of August 2026.
The platform has more than 3.9 billion active users worldwide, compared with approximately 1.56 billion iPhone users. Android is particularly strong in major emerging smartphone markets, holding around 90–91% share in India and approximately 58–69% in China during 2024–2026. Google has also reported activating more than 1 billion new Android devices within a single year, equal to roughly one in eight people worldwide.
| By Operating System | Segment Shares |
|---|---|
| Android | 62.1% |
| iOS/iPadOS | 31.5% |
| Other Mobile Operating Systems | 6.4% |
By Application
In 2025, Personal Productivity held a dominant position in the Application segment, capturing more than a 31.25% share. Its strong position is supported by the rapid growth of digital transactions, online business activity, and workplace communication. According to UNCTAD, business e-commerce sales across 45 economies reached around USD 28 trillion in 2024, up from approximately USD 17 trillion in 2016.
These economies represented nearly three-quarters of global GDP, showing the large scale of digital transactions that require scheduling, tracking, ordering, and follow-up activities. Digital communication is also creating a heavy daily workload. Around 361.6 billion emails were sent and received worldwide every day in 2024, across approximately 4.48 billion users.
At the same time, OECD data shows that demand for digital skills in AI-exposed occupations increased by around 15% over the past decade. As workers manage more transactions, messages, meetings, and digital tasks, productivity-focused AI agents can automate routine activities and reduce administrative effort.
| By Application | Segment Shares |
|---|---|
| Personal Productivity | 31.2% |
| Search and Discovery | 15.10% |
| Messaging and Communication | 11.0% |
| Shopping and Commerce | 10.1% |
| Travel and Mobility | 9.1% |
| Content Creation | 8.0% |
| Device Control and Automation | 7.3% |
| Other Applications | 8.2% |
By End User
In 2025, Consumers held a dominant position in the End User segment, capturing more than a 68.1% share. Their leadership is supported by the large global population using smartphones, mobile applications, and online services for everyday activities. According to the UN World Population Prospects 2024, the global population reached around 8.16 billion, while approximately 5.5 billion people were online.
This creates a much larger potential user base for consumer-focused mobile AI agents than for enterprise-only applications. Digital spending is also expanding quickly. UNCTAD reported that business e-commerce sales across 43 economies reached nearly USD 27 trillion in 2022, rising from around USD 17 trillion in 2016. A significant share of this activity is supported by consumer-facing digital platforms and mobile transactions.
| By End User | Segment Shares |
|---|---|
| Consumers | 68.1% |
| Enterprises | 15.0% |
| Developers and Professionals | 10.6% |
| Other End Users | 6.3% |
Key Market Segments
By Component
- AI Agent Software and Platforms
- Model Runtimes and SDKs
- Services
By Device Type
- Smartphones
- Tablets
- Wearables
- Smart Eyewear and XR Devices
- Other Mobile Devices
By Deployment Model
- Fully On-Device/Local
- Hybrid Device-Cloud
- Cloud-Connected
By Agent Type
- Personal and Productivity Agents
- Search and Knowledge Agents
- Communication Agents
- Commerce and Transaction Agents
- Content and Creative Agents
- Device Automation Agents
- Other Agents
By Model Type
- Small and Compact Language Models
- Small Multimodal Models
- Vision-Language Models
- Specialized/Domain Models
- Other Models
By Modality
- Text
- Voice and Audio
- Image/Vision
- Multimodal
By Operating System
- Android
- iOS/iPadOS
- Other Mobile Operating Systems
By Application
- Personal Productivity
- Search and Discovery
- Messaging and Communication
- Shopping and Commerce
- Travel and Mobility
- Content Creation
- Device Control and Automation
- Other Applications
By End User
- Consumers
- Enterprises
- Developers and Professionals
- Other End Users
Geopolitical Impact Analysis
Geopolitical tensions are increasingly affecting semiconductor supply chains, which are essential for mobile AI agent hardware. The United States increased Section 301 tariffs on Chinese semiconductors from 25% to 50%, effective January 1, 2025. Broader U.S.-China average tariffs also reached nearly 164% and 146%, respectively, by mid-April 2025, before a 90-day trade truce reduced both sides to 10% in May 2025.
U.S. export controls have also expanded restrictions on high-bandwidth memory and DRAM since December 2024, limiting access to advanced components required for on-device AI processing. Despite these pressures, global trade in AI-related goods, including semiconductors, servers, and telecom equipment, increased 20% year-on-year to USD 4.18 trillion in 2025.
These products generated around 42% of total global trade growth while representing only about one-sixth of world trade volume. Shipping disruptions are adding further pressure. Suez Canal transits fell by more than 40%, while Panama Canal transits dropped nearly 50% below peak levels, forcing longer shipping routes for components moving from Asian manufacturing hubs.
The WTO also lowered its 2026 merchandise trade growth forecast to 0.5%, down from 1.8%. For Mobile AI Agent manufacturers, semiconductor tariffs above 50%, export restrictions, and longer shipping routes can raise component costs, extend lead times, and delay product launches despite continued growth in AI hardware demand.
Regional Analysis
In 2025, North America held a dominant position in the Mobile AI Agent Market, capturing more than a 40.3% share and generating approximately USD 1.01 billion in revenue. The region benefits from a large digital economy, strong software infrastructure, and a deep technology workforce. The U.S. digital economy reached around USD 4.9 trillion in 2024, accounting for nearly 18% of national GDP and supporting about 28.4 million jobs.
| By Region | Region Shares |
|---|---|
| North America | 40.3% |
| Asia Pacific | 26.0% |
| Europe | 20.1% |
| Latin America | 8.0% |
| Middle East and Africa | 5.6% |
Talent availability also strengthens regional growth. U.S. employment of data scientists is projected to increase by 33.5% between 2024 and 2034, while software developer employment is expected to rise by 15.8%, adding more than 267,000 new positions. Software alone contributed around USD 607 billion to the wider U.S. digital economy in 2022, supporting continued development of AI-based mobile platforms.
Asia Pacific emerged as the fastest-growing regional market, holding around a 26.0% share. Growth is supported by its large population and expanding internet access. Internet adoption reached approximately 70% in the Arab States and 66% across Asia-Pacific, compared with around 87–92% across Europe and the Americas.
Key Regions and Countries
North America
- US
- Canada
Europe
- Germany
- France
- The UK
- Spain
- Italy
- Rest of Europe
Asia Pacific
- China
- Japan
- South Korea
- India
- Australia
- Rest of APAC
Latin America
- Brazil
- Mexico
- Rest of Latin America
Middle East and Africa
- GCC
- South Africa
- Rest of MEA
Market Dynamics
Drivers
| Driver | (~) % CAGR | Geographic Relevance | Impact Timeline |
|---|---|---|---|
| Platform-level OS integration of agentic assistants | +9.5% | Global, led by North America and East Asia | Short term (2 years or less) |
| Rising 5G and edge compute penetration | +6.0% | North America, Europe, East Asia | Short term (2 years or less) |
| Enterprise productivity licensing shift to per-seat AI add-ons | +5.0% | North America, Western Europe | Medium term (2 to 4 years) |
| Consumer smartphone replacement cycle skewing toward AI-capable chipsets | +4.5% | Global, concentrated in Asia Pacific | Short term (2 years or less) |
| Declining per-token inference cost from compact model architectures | +3.5% | Global | Medium term (2 to 4 years) |
Platform-Level OS Integration of Agentic Assistants
A major market driver is the direct integration of AI agents into smartphone operating systems instead of offering them only as downloadable applications. This approach can reduce customer acquisition costs to nearly zero compared with the standalone app model widely used through 2024.
More than 80% of flagship smartphones shipped in 2025 included a pre-installed generative AI assistant, compared with less than 35% in 2023. Built-in distribution also allows device makers to introduce paid AI features during each smartphone upgrade cycle rather than depending only on long subscription funnels.
Competitive pressure around default AI assistants is also increasing technology investment, with RandD-to-revenue ratios for major device manufacturers rising above 18% as companies strengthen their mobile AI ecosystems.
Restraints
| Restraint | (~) % CAGR | Geographic Relevance | Impact Timeline |
|---|---|---|---|
| Cross-border data residency and AI-specific regulatory bans | -4.0% | European Union, China | Short term (2 years or less) |
| Semiconductor export control restrictions on advanced AI chips | -3.0% | China, select Asia Pacific markets | Short term (2 years or less) |
| Elevated cost of capital constraining smaller device OEM AI CapEx | -2.0% | Emerging markets, Latin America, Africa | Medium term (2 to 4 years) |
Cross-Border Data Residency and AI-Specific Regulatory Bans
A major restraint is the growing use of legal restrictions and data-localization rules for cloud-dependent mobile AI agents. Under the European Commission’s AI Act timeline, high-risk AI obligations taking effect in August 2026 can require compliance and conformity processes lasting around 6–9 months before deployment. This can delay access to the EU market of roughly 450 million consumers.
China also requires generative AI services to complete algorithm filing and registration before commercial deployment. These requirements can restrict unregistered foreign AI agents from reaching a market with more than 1.1 billion mobile subscribers.
To remain active in regulated markets, global providers may need region-specific AI architectures and compliance systems, adding an estimated 200–400 basis points to operating costs as a share of regional revenue, or otherwise delaying market entry until approvals are completed.
Challenges
| Challenge | (~) % CAGR | Geographic Relevance | Mitigation Horizon |
|---|---|---|---|
| AI infrastructure power grid capacity strain | -2.8% | North America, East Asia | Long term (4 years or more) |
| Specialized AI engineering talent shortage | -2.2% | Global, acute in North America and Europe | Medium term (2 to 4 years) |
| On-device battery and thermal constraint limits | -1.5% | Global | Medium term (2 to 4 years) |
| Fragmented device-cloud latency inconsistency | -1.0% | Emerging markets, rural connectivity zones | Medium term (2 to 4 years) |
AI Infrastructure Power Grid Capacity Strain
A major structural challenge is the growing gap between data center electricity demand and available grid capacity. Global data center electricity use reached about 415 TWh in 2024 and is projected to rise toward 945 TWh by 2030. At the same time, new large-load grid connections in major North American markets can face waiting periods of around 4–8 years, delaying hyperscale capacity needed for cloud-based AI agent processing.
This pressure is forcing cloud providers to spend more on dedicated power infrastructure and long-term energy contracts. Capital expenditure guidance from a major hyperscaler exceeded USD 190 billion in 2026, while additional power arrangements can increase the effective cost of cloud-based AI workloads by around 150–300 basis points. These higher costs are encouraging providers to shift more inference workloads toward on-device compact AI models.
Opportunities
| Opportunity | (~) % CAGR | Geographic Relevance | Execution Window |
|---|---|---|---|
| Agentic commerce and autonomous transaction monetization | +4.0% | Global, early mover advantage in North America | Medium term (2 to 4 years) |
| Underpenetrated rural and second-tier city user base in Asia Pacific | +2.8% | India, Southeast Asia, Sub-Saharan Africa | Medium term (2 to 4 years) |
| Cross-industry embedded agent licensing into automotive and healthcare devices | +2.0% | Global | Long term (4 years or more) |
| Enterprise workflow orchestration white space beyond consumer scheduling | +1.5% | North America, Western Europe | Medium term (2 to 4 years) |
Agentic Commerce and Autonomous Transaction Monetization
A major untapped opportunity lies in AI agents completing purchases and payments independently for users. Digitally initiated retail payments have grown at more than 12% annually since 2022, yet autonomous agent-initiated transactions account for less than 3% of total volume. This leaves significant room for AI agents to move beyond scheduling and information retrieval into revenue-generating commerce.
This opportunity could support transaction-based commission models instead of relying mainly on subscriptions or licensing fees. Payment-industry disclosures suggest agent-brokered commerce could improve platform margins by around 300–500 basis points because transaction revenue carries lower servicing costs. However, wider adoption will depend on regulatory clarity, as rules covering liability for autonomous payments remain under development in many markets as of 2026.
Key Players Analysis
The Mobile AI Agent Market shows a clear Tier-1 and Tier-2 competitive structure based on technology investment, platform reach, and financial strength. Tier-1 companies such as Apple, Alphabet, Microsoft, and Meta lead through large RandD budgets and control over major digital ecosystems. Apple generated USD 416.16 billion in FY2025 revenue and spent USD 34.5 billion on RandD, supporting deeper AI integration across iOS devices.
Alphabet reported USD 402.8 billion in FY2025 revenue, USD 61.09 billion in RandD spending, and USD 91.45 billion in capital expenditure, strengthening Gemini across Android and cloud infrastructure. Microsoft recorded USD 331.8 billion in FY2026 revenue, with USD 35.5 billion in RandD and USD 115.9 billion in capital expenditure, supporting wider Copilot deployment.
Meta is another strong Tier-1 competitor, with USD 200.97 billion in FY2025 revenue, USD 57.37 billion in RandD spending, and USD 69.6 billion in capital expenditure, supporting AI features across WhatsApp, Instagram, and Messenger.
Tier-2 companies such as Samsung, Huawei, Xiaomi, and Alibaba compete mainly through device scale and regional strength. Samsung uses Bixby and Galaxy AI, while Huawei and Xiaomi strengthen their positions in China. Alibaba supports agent adoption through Qwen and cloud services. OpenAI operates mainly as a model and AI infrastructure provider rather than a device-focused competitor.
Top Key Players in the Market
- Samsung Electronics Co., Ltd.
- Google LLC
- OpenAI
- Microsoft Corporation
- Meta Platforms, Inc.
- Huawei Technologies Co., Ltd.
- Xiaomi Corporation
- Alibaba Group Holding Limited
- Apple Inc.
Recent Developments
- In 2025, Microsoft and OpenAI signed a new definitive agreement that supported OpenAI’s transition to a Public Benefit Corporation. Following the recapitalization, Microsoft’s OpenAI investment was valued at approximately USD 135 billion, representing around a 27% stake. OpenAI also committed to purchasing an additional USD 250 billion of Azure services, strengthening the cloud infrastructure supporting AI models, applications, and agent-based services.
- In 2026, Apple and Google announced a multi-year partnership under which the next generation of Apple Foundation Models will use Google’s Gemini models and cloud technology. The agreement gives Gemini access to Apple’s ecosystem of more than 2 billion active devices, significantly expanding the potential reach of AI-powered mobile assistants.
Report Scope
| Report Features | Description |
|---|---|
| Market Value (2025) | USD 2.5 Billion |
| Forecast Revenue (2035) | USD 110.0 Billion |
| CAGR (2026-2035) | 46.0% |
| Base Year for Estimation | 2025 |
| Historic Period | 2020-2024 |
| Forecast Period | 2026-2035 |
| Report Coverage | Revenue Forecast, Market Dynamics, Competitive Landscape, Recent Developments |
| Segments Covered | By Component (AI Agent Software and Platforms, Model Runtimes and SDKs, Services); By Device Type (Smartphones, Tablets, Wearables, Smart Eyewear and XR Devices, Other Mobile Devices); By Deployment Model (Fully On-Device/Local, Hybrid Device-Cloud, Cloud-Connected); By Agent Type (Personal and Productivity Agents, Search and Knowledge Agents, Communication Agents, Commerce and Transaction Agents, Content and Creative Agents, Device Automation Agents, Other Agents); By Model Type (Small and Compact Language Models, Small Multimodal Models, Vision-Language Models, Specialized/Domain Models, Other Models); By Modality (Text, Voice and Audio, Image/Vision, Multimodal); By Operating System (Android, iOS/iPadOS, Other Mobile Operating Systems); By Application (Personal Productivity, Search and Discovery, Messaging and Communication, Shopping and Commerce, Travel and Mobility, Content Creation, Device Control and Automation, Other Applications); By End User (Consumers, Enterprises, Developers and Professionals, Other End Users) |
| Regional Analysis | North America – US, Canada; Europe – Germany, France, The UK, Spain, Italy, Rest of Europe; Asia Pacific – China, Japan, South Korea, India, Australia, Singapore, Rest of APAC; Latin America – Brazil, Mexico, Rest of Latin America; Middle East and Africa – GCC, South Africa, Rest of MEA |
| Competitive Landscape | Samsung Electronics Co., Ltd., Google LLC, OpenAI, Microsoft Corporation, Meta Platforms, Inc., Huawei Technologies Co., Ltd., Xiaomi Corporation, Alibaba Group Holding Limited, Apple Inc. |
| Customization Scope | Customization for segments, region/country-level will be provided. Moreover, additional customization can be done based on the requirements. |
| Purchase Options | We have three licenses to opt for: Single User License, Multi-User License (Up to 5 Users), Corporate Use License (Unlimited Users and Printable PDF) |





























