
Quick Navigation
Report Overview
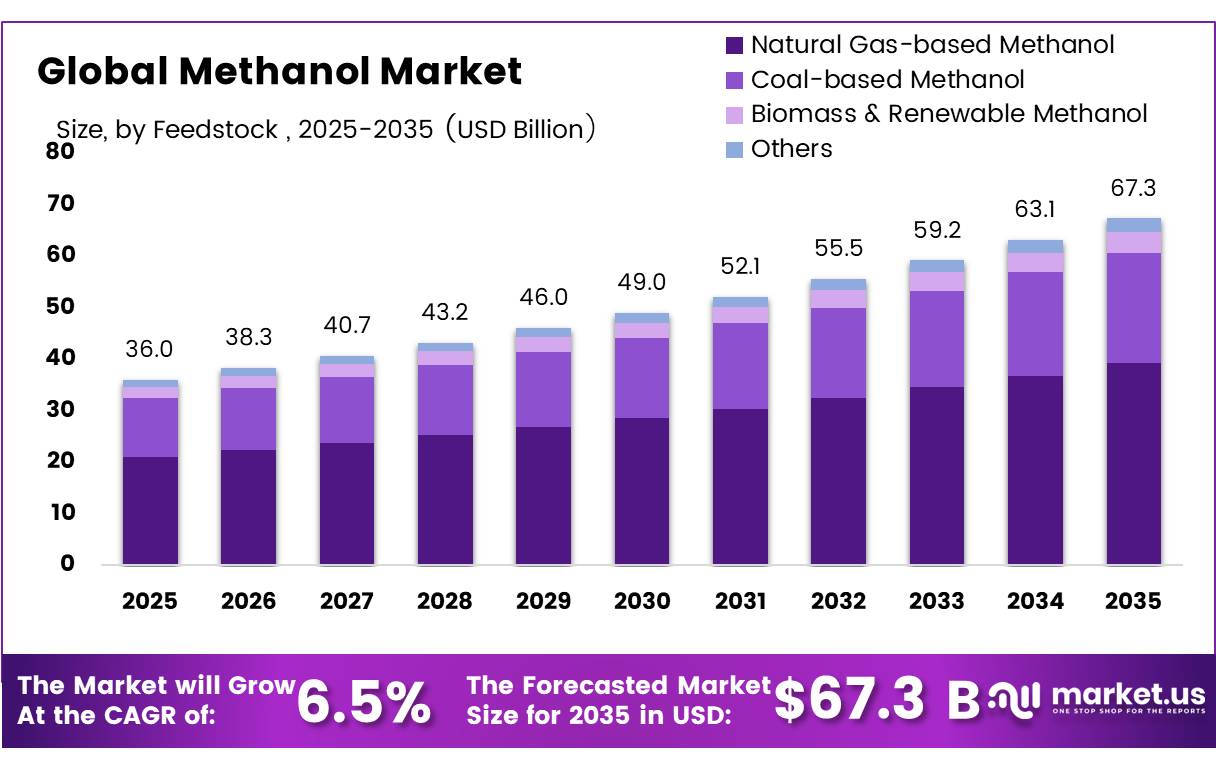
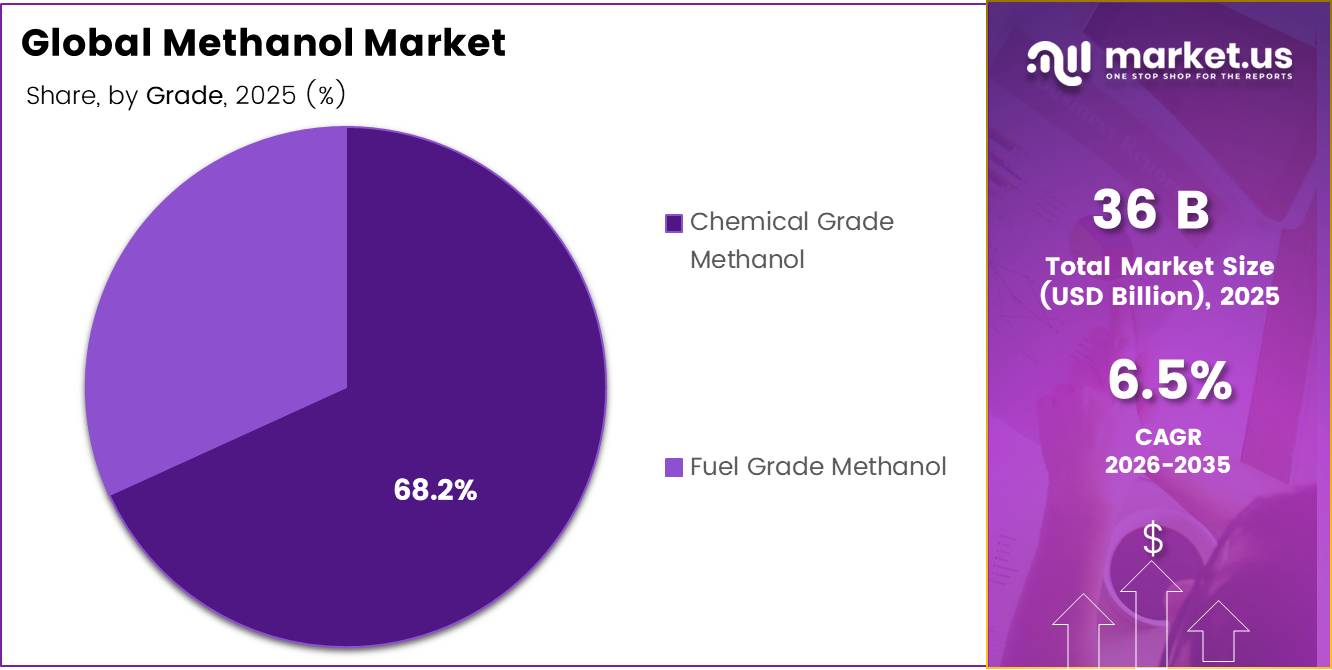
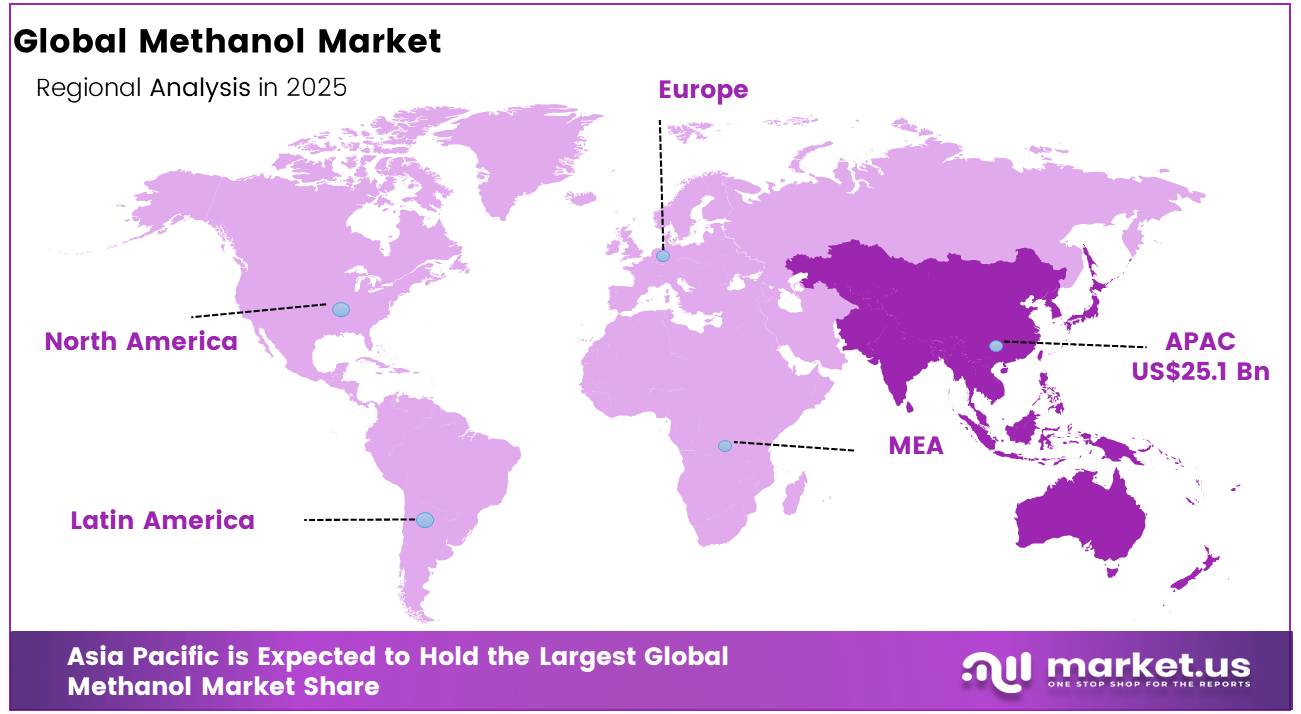
In 2025, the global Methanol Market was valued at USD 36 billion, and between 2026 and 2035, this market is estimated to register a CAGR of 6.5%, reaching about USD 67.3 billion by 2035. Asia Pacific held a dominant market position, capturing more than a 45.2% share, holding USD 1.54 billion in revenue.
The methanol market forms the building block of the global chemical and energy supply chain. It provides critical input for formaldehyde, acetic acid, fuels, and intermediates, while concurrently emerging as an environmentally friendly fuel. Demand is linked to the development of the chemical and petrochemical markets, fast-growing implementation of methanol to olefins (MTO), and the transition to low-carbon fuels worldwide.
- According to International Agency global methanol demand has been expanding at 6.5% per year during the past ten years. Moreover, the growth rate stood at 2.4% in 2022. Within the major chemical producers, methanol emits about 28% of all gases, making it the second most significant polluting chemical after ammonia at 45%. In the optimal case, CO₂-based technologies can lower the carbon footprint of methanol production from 74% to 93% compared to standard processes.
Key Takeaways
- The Global Methanol Market was valued at USD 36 billion in 2025.
- The Global Methanol Market is projected to grow at a CAGR of 6.5% and is estimated to reach USD 67.3 billion by 2035.
- On the Feedstock, Natural Gas-based Methanol dominated the global methanol market, constituting 58.4% of the total market share.
- Based on the Derivative, Formaldehyde dominated market, with a substantial market share of around 29.8%.
- Based on the grade, Chemical Grade Methanol led the market, comprising 68.2% of the total market.
- Among the end-uses, Chemicals & Petrochemicals held a major share in Global Methanol Market, 44.8% of the market share.
- In 2025, the Asia Pacific was the most dominant region in the methanol market, accounting for 69.8% of the total global consumption.
The use of renewable methanol can occur at the industrial level through cost-effective manufacturing at levels close to other renewable fuels when adequate sources are available. Policy convergence towards decarbonization and the deployment of low-carbon production technologies are diversifying the application area of methanol and increasing its demand worldwide.
Methanol Market Segments
Feedstock Analysis
Natural Gas-based Methanol represents dominant Segment in the Market.
Natural gas-based methanol led the global methanol market, capturing 58.4% of the market share in terms of production. Natural gas continues to be the most widely used feedstock in methanol production because it provides the basic ingredient input for chemicals as well as fuels. The low cost and established technology along with relatively low greenhouse gas emissions than coal-based processes make it the feedstock leader in major producer countries. The annual growth rate for industrial uses of natural gas for chemicals, like methanol, is projected to be 3.4%.
Additionally, the biomass and renewable methanol represents the fastest-growing feedstock category. Methanol produced using CO₂ emissions and renewable processes can decrease methanol emissions by 74% to 93%, making them crucial for decarbonization efforts.
Derivative Analysis
Formaldehyde a significant type.
Formaldehyde emerged as the dominant player within the global methanol derivatives market, with a market share of 29.8%. This derivative application of methanol acts as the leading end-use derivative product of methanol across the globe and plays an important role as an intermediate in producing high-quality resins and plastics for the construction and automotive industries. The continuous growth and stability of demand for this product arise from the steady growth in the urea-formaldehyde and phenol-formaldehyde resin systems.
Furthermore, MTO/MTP, is the fastest-growing segment among all derivative applications. The demand for methanol has increased by 6.5% year-on-year in the last decade owing to its importance as a feedstock for producing high-end products. Investments made in large-scale MTO facilities, especially in China, have resulted in an increase in methanol’s significance within the olefin chain. As such, MTO/MTP emerges as the most structurally-growing segment among the various derivative applications.
Grade Analysis
Chemical Grade Methanol Are the Most Widely Used.
Chemical grade methanol was the major player in the worldwide methanol market, commanding an impressive 68.2% market share. As reported by International Energy Agency (IEA), demand for methanol for use in the chemical industry increased at a compounded annual growth rate of 6.5% per year in the past decade Fuel grade methanol’s future growth is assured by its high penetration in resins, plastics, and chemical industries as a critical component in manufacturing that must adhere to standard purity levels in all downstream operations.
Fuel grade methanol is the fastest growing segment in the market. Under the Net Zero scenario, low carbon fuels such as methanol are anticipated to account for nearly 15% of the total demand for ship bunkering in 2030 compared to less than 1% currently. Methanol has a wide array of uses ranging from passenger cars, light and heavy duty transport vehicles to ships, with low-level blends posing no modifications to the existing fuel infrastructure, making it highly adoptable.
End Use Analysis
Methanol is Mostly Utilized in the Chemicals & Petrochemicals.
Chemicals & petrochemicals led the global methanol market with a share of 44.8%. Methanol consumption in the chemical industry has been expanding at 6.5% per annum during the last decade due to the utilization of methanol as raw material to manufacture formaldehyde, usage as fuel, and as intermediaries for manufacturing high-valued chemicals. According to the International Energy Agency (IEA) petrochemicals will comprise over 1/3 of the increase in worldwide oil demand to 2030 and close to half to 2050, highlighting methanol’s vital importance as a basic component for the chemical industry.
Marine & shipping is the fastest-growing end-use category. In previous years, oil products have made up over 99% of total energy consumption in shipping across the world. However, lower-carbon fuels such as methanol will make up almost 15% of the total demand for shipping energy by 2030 in the Net Zero Scenario.
Key Market Segments
By Feedstock
- Natural Gas-based Methanol
- Coal-based Methanol
- Biomass & Renewable Methanol
- Others
By Derivative
- Formaldehyde
- Acetic Acid
- MTO/MTP (Methanol-to-Olefins/Propylene)
- MTBE (Methyl Tertiary Butyl Ether)
- Dimethyl Ether (DME)
- Gasoline Blending
- Biodiesel
- Solvents
- Others
By Grade
- Chemical Grade Methanol
- Fuel Grade Methanol
By End Use
- Chemicals & Petrochemicals
- Automotive & Transportation
- Construction & Infrastructure
- Marine & Shipping
- Electronics
- Pharmaceuticals
- Energy & Power
- Others
Driver Analysis
Shipping fuel shift under IMO and EU rules
The single most important new demand catalyst is maritime regulation. The IMO approved a net-zero framework in April 2025 that combines a global marine fuel standard with emissions pricing, with formal adoption scheduled in October 2025, implementation guidelines in spring 2026, and expected entry into force in 2027 for ships above 5,000 gross tonnage that account for about 85% of international shipping CO2 emissions.
In parallel, the EU’s FuelEU Maritime regulation has applied since 1 January 2025 and requires progressive lifecycle GHG-intensity reduction from a 2020 baseline, beginning with a 2% cut in 2025 and rising to 6% by 2030, directly improving the economic case for methanol-capable vessels and compliant fuel procurement. Strategically, this changes methanol from a marginal fuel option into a compliance-linked marine molecule: owners can justify dual-fuel engine investments, traders can build term offtake structures, and producers can shift part of their portfolio away from purely chemical markets toward bunker fuel contracts with higher policy certainty.
Drivers Impact Analysis
| Driver | (~) % Impact on CAGR Forecast | Geographic Relevance | Impact Timeline |
|---|---|---|---|
| Shipping fuel shift under IMO and EU rules | +1.4% | EU core, North America export hubs, Singapore/UAE bunkering corridors, East Asia shipbuilding | Medium term (2-4 years) |
| Gas-backed cost competitiveness in major producing regions | +1.0% | North America core, Middle East core, Trinidad spill-over, China import-linked | Short term (≤ 2 years) |
| India methanol economy and fuel-blending push | +0.8% | India core, South Asia spill-over | Medium term (2-4 years) |
| Low-carbon methanol policy support and project bankability | +1.2% | EU core, US core, India emerging, Nordic corridors | Medium term (2-4 years) |
| Chemical chain resilience from formaldehyde/MTO-linked demand | +0.9% | China core, wider APAC, US Gulf, Middle East downstream clusters | Short term (≤ 2 years) |
| Port and fuel infrastructure build-out improving adoption economics | +0.6% | EU ports, East Asia, Singapore, select North American marine hubs | Long term (≥ 4 years) |
Restraint Analysis
Toxicity and safety compliance
Methanol’s toxicological profile remains a real commercial barrier, not merely a handling footnote, because EU REACH restrictions require worker exposure controls below Derived No-Effect Levels of 14.4 mg/m3 for inhalation and 4.8 mg/kg/day for dermal exposure for concentrations at or above 0.3%, while product safety classifications continue to include acute toxicity by ingestion, skin contact, and inhalation as well as high flammability.
In marine fuel applications, the UK Maritime and Coastguard Agency states that methanol-fueled vessels above 500 GT must proceed through IMO interim guidelines, IGF Code-linked alternative design arrangements, and survey/certification pathways, while new basic methanol fuel training is only being introduced into the UK curriculum from September 2025. The restraint therefore shows up as longer engineering approval cycles, higher capex for double-walled piping, leak detection, shutdown systems, crew training and fire-risk controls, and slower fleet or terminal conversion because every missing procedural approval pushes revenue generation to the right even where fuel demand is theoretically present.
Restraint Impact Analysis
| Restraint | (~) % Impact on CAGR Forecast | Geographic Relevance | Impact Timeline |
|---|---|---|---|
| Gas price volatility | -1.4% | North America core, EU core, Northeast Asia import-linked | Short term (≤ 2 years) |
| Carbon cost exposure | -1.1% | EU core, MENA exporters to EU, APAC exporters | Medium term (2-4 years) |
| Toxicity and safety compliance | -0.8% | EU ports, UK, Singapore, East Asia shipyards | Medium term (2-4 years) |
| Trade and tariff disruption | -0.7% | US-linked trade lanes, EU border markets, China spill-over | Short term (≤ 2 years) |
| Green methanol cost gap | -1.6% | EU core, North America pilots, Nordic projects, India emerging | Medium term (2-4 years) |
| Infrastructure bottlenecks | -0.9% | EU ports, Asia bunkering hubs, Latin America spill-over | Long term (≥ 4 years) |
Opportunity Analysis
Carbon-to-methanol project clustering
This qualifies as an opportunity because most markets are still valuing carbon capture, renewable hydrogen, and methanol synthesis as separate projects, while the larger upside sits in clustering them into shared industrial hubs that monetize carbon twice, first through avoided emissions and second through saleable methanol output. India’s notified green methanol standard now allows CO2 feedstock from biogenic sources, direct air capture, or existing industrial sources and caps non-biogenic lifecycle emissions at 0.44 kg CO2 equivalent per kg of methanol, effectively creating a regulatory specification for low-carbon product qualification.
In the U.S., federal carbon-management programs opened a second wave of funding in late 2024 covering Regional DAC Hubs and carbon capture demonstrations with a combined funding envelope referenced at nearly $7 billion, which improves the economics of hub-based carbon sourcing even if project execution remains uneven. The strategic upside is substantial because shared CO2, hydrogen, power, and export infrastructure lowers unit capex per ton, improves electrolyzer utilization, and expands the addressable market from chemicals alone into certified maritime fuels, allowing developers to shift from single-asset risk to corridor-scale platform economics.
Opportunity Impact Analysis
| Opportunity | (~) % Potential CAGR Upside | Geographic Relevance | Execution Window |
|---|---|---|---|
| Green marine fuel offtake platforms | +1.8% | EU core, Singapore, UAE, North America export hubs | Medium term (2-4 years) |
| India DME-LPG substitution scale-up | +1.3% | India core, South Asia spill-over | Medium term (2-4 years) |
| Carbon-to-methanol project clustering | +1.5% | US Gulf, Nordics, EU industrial clusters, India emerging | Long term (≥ 4 years) |
| Port-side methanol bunkering networks | +1.1% | EU ports, East Asia corridors, Middle East hubs | Medium term (2-4 years) |
| Distributed power and backup fuel cells | +0.9% | India, Southeast Asia, Africa emerging, remote industrial sites | Long term (≥ 4 years) |
| M&A roll-up in downstream fuel applications | +0.7% | North America, India, EU niche fleets, APAC equipment makers | Short term (≤ 2 years) |
Challenges Analysis
Volatile gas input costs
Methanol producers face a persistent challenge from natural gas price volatility that complicates long-term offtake pricing and capital allocation rather than acting as an outright restraint, because EIA’s June 2026 Short‑Term Energy Outlook anticipates U.S. marketed gas production still growing 3.3% in 2026 and 2.5% in 2027 even as Henry Hub prices oscillate around a relatively flat annual average driven by LNG exports, weather, and storage levels, implying a trading range where quarter‑to‑quarter price swings of 30–40% remain plausible.
Historical volatility for front‑month Henry Hub futures had only recently fallen from around 81% in late 2024 to roughly 69% by mid‑2025, which is still high by commodity standards and translates into multi‑dollar/MMBtu intrayear moves that can compress methanol cash margins by double‑digit percentages for several months at a time, especially for non‑integrated plants. This friction does not shut plants today, but it forces companies to run higher working‑capital buffers, rely more heavily on shorter‑tenor contracts or formula pricing, and hedge aggressively, which in turn raises transaction costs, depresses risk‑adjusted returns on new gas‑based projects, and slows investment decisions that would otherwise lift global methanol capacity at a smoother pace.
Challenges Impact Analysis
| Challenge | (~) % CAGR Friction Drag | Geographic Relevance | Mitigation Horizon |
|---|---|---|---|
| Volatile gas input costs | -1.0% | North America core, EU hubs, APAC importers | Medium term (2-4 years) |
| Port congestion and logistics | -0.9% | EU regulatory hubs, APAC corridors, US Gulf | Long term (≥ 4 years) |
| Electrolyzer and H2 scale bottlenecks | -1.2% | EU, US, China, Middle East corridors | Long term (≥ 4 years) |
| R&D and talent depth gaps | -0.8% | India, emerging APAC, Latin America | Medium term (2-4 years) |
| Project pipeline execution risk | -0.9% | Global, with China/EU/US clusters | Long term (≥ 4 years) |
| Policy and compliance complexity | -0.7% | EU regulatory hubs, exporters to EU | Medium term (2-4 years) |
Geopolitical Impact Analysis
Geopolitical Realignment and Supply Chain Fragmentation Reshaping Methanol Manufacturing.
The Iran-Israel conflict directly affected methanol supplies in the first half of 2025. There have been many unforeseen interruptions at methanol plants in Iran in June 2025 due to Iran-Israel tensions, causing uncertainties in the supply. The overall quantity of methanol imports into China decreased by 925,300 tons or 14.7% from last year’s figures to become 5.377 million tons for the first half of 2025. However, despite the instability, Iran remained China’s top source of methanol supply.
Another geopolitical challenge to methanol import into China was caused by the US Department of Treasury (OFAC) sanctions imposed in July 2025 against six Indian companies dealing in Iranian methanol and petrochemicals worth more than $22 million. According to the U.S. government’s Executive Order 13846, any entity engaging in Iranian petrochemical trade has to change its methanol supplies.
Furthermore, tariff retaliation between the U.S. and China increased supply chain costs. There was a 34% tariff imposed by the United States on Chinese goods; China responded with a reciprocal tariff increase by 34%. However, according to China Customs data, direct methanol trade between the two countries is negligible less than 1% of total Chinese imports.
Regional Analysis
Asia Pacific Held the Largest Share of the Global Methanol tor Market.
The Asia Pacific region represents the dominant market share of 45.2% methanol in the world, due to industrial consumption in China. Methanol imports into China were 5.377 million tons during H1 2025, and methanol imports from Malaysia were increased by 153% on a yearly basis after the completion of a 1.8 million-ton methanol plant in December 2024. Growth in the Asia-Pacific region is confirmed by the ADB, which states that GDP growth is continuing in the region, with 5.1% in Indonesia and 6.0% in the Philippines during 2024.
The Latin America region accounts for the fastest growth rate in the methanol industry. Brazil has launched a groundbreaking policy mandating an increase in ethanol in gasoline from 27% to 30% in August 2025, which is expected to boost ethanol demand by 1.3 to 1.5 billion liters annually. The Brazilian National Supply Corporation (Conab) forecasts corn production to touch 128 million tons in 2025, which is a year-on-year increase of 13 million tons.
Key Regions and Countries Covered
- North America
- The US
- Canada
- Europe
- Germany
- France
- The UK
- Spain
- Italy
- Russia & CIS
- Rest of Europe
- APAC
- China
- Japan
- South Korea
- India
- ASEAN
- Rest of APAC
- Latin America
- Brazil
- Mexico
- Rest of Latin America
- Middle East & Africa
- GCC
- South Africa
- Rest of MEA
Key Players Analysis
Methanol manufacturers the ability to adapt their regional supply chain to local needs, especially in Asia Pacific (69.8% market share). Chinese methanol imports from Malaysia rose by 153% compared to the same period last year during the first half of 2025 due to new capacity, showing that they align themselves with high demand for methanol in downstream chemical and energy applications.
Manufacturers also make investments in low-carbon manufacturing technology, such as carbon capture solutions. According to the U.S. Department of Energy, there is a 35% decrease in the cost of carbon capture from 2010 levels, allowing methanol manufacturers to produce blue methanol, which is now economical on a commercial scale. One emerging market for methanol application includes Latin America (7% market share currently, highest growth rate at 6.2% CAGR), driven by Brazil’s mandatory ethanol blending percentage rise to 30%.
The integration of manufacturers’ natural gas suppliers and chemical buyers also allows them to ensure stable input sources despite increasing energy prices. Expansion of their capacity in the Asia Pacific region will allow manufacturers to align themselves with demand centers from the olefins, formaldehyde, and energy storage chains.
Major Players In The Industry
- BASF SE
- Mitsui & Co. Ltd.
- Celanese Corporation
- Petroliam Nasional Berhad (PETRONAS)
- SABIC
- Methanex Corporation
- Mitsubishi Gas Chemical Co., Inc.
- QAFAC (Qatar Fuel Additives Company Limited)
- Qualcomm Technologies, Inc.
- Zagros Petrochemical Company
- Other Key Players
Key Development
- In June 2025, Methanex Corporation successfully took over the global methanol operations of OCI Global for USD 1.2 billion in cash, acquiring assets that would make it even more dominant in the global methanol supply chain as the world’s largest methanol manufacturer
- In July 2025, Brazilian National Energy Policy Council (CNPE) mandated a rise in ethanol blending from 27% to 30%, which came into effect from August 2025. Due to this regulatory change, ethanol consumption would grow between 1.3 and 1.5 billion liters per year in Brazil. Since methanol is an essential ingredient used in biodiesel and biofuels production.
Report Scope
| Report Features | Description |
|---|---|
| Market Value (2025) | US$36.6 Bn |
| Forecast Revenue (2035) | US$67.3 Bn |
| CAGR (2026-2035) | 6.5% |
| Base Year for Estimation | 2025 |
| Historic Period | 2020-2024 |
| Forecast Period | 2026-2035 |
| Report Coverage | Revenue Forecast, Market Dynamics, Competitive Landscape, Recent Developments |
| Segments Covered | By Feedstock (Natural Gas-based Methanol, Coal-based Methanol, Biomass & Renewable Methanol, Others), By Derivative (Formaldehyde, Acetic Acid, MTO/MTP (Methanol-to-Olefins/Propylene), MTBE (Methyl Tertiary Butyl Ether),Dimethyl Ether (DME),Gasoline Blending, Biodiesel, Solvents, Others), By Grade (Chemical Grade Methanol, Fuel Grade Methanol) |
| Regional Analysis | North America – The US & Canada; Europe – Germany, France, The UK, Spain, Italy, Russia & CIS, Rest of Europe; APAC– China, Japan, South Korea, India, ASEAN & Rest of APAC; Latin America– Brazil, Mexico & Rest of Latin America; Middle East & Africa– GCC, South Africa, & Rest of MEA |
| Competitive Landscape | BASF SE, Mitsui & Co. Ltd., Celanese Corporation, Petroliam Nasional Berhad (PETRONAS), SABIC, Methanex Corporation, Mitsubishi Gas Chemical Co., Inc., QAFAC (Qatar Fuel Additives Company Limited), Qualcomm Technologies, Inc., Zagros Petrochemical Company, Other Key Players |
| Customization Scope | Customization for segments, region/country-level will be provided. Moreover, additional customization can be done based on the requirements. |
| Purchase Options | We have three licenses to opt for: Single User License, Multi-User License (Up to 5 Users), Corporate Use License (Unlimited Users and Printable PDF) |


