
Quick Navigation
Report Overview
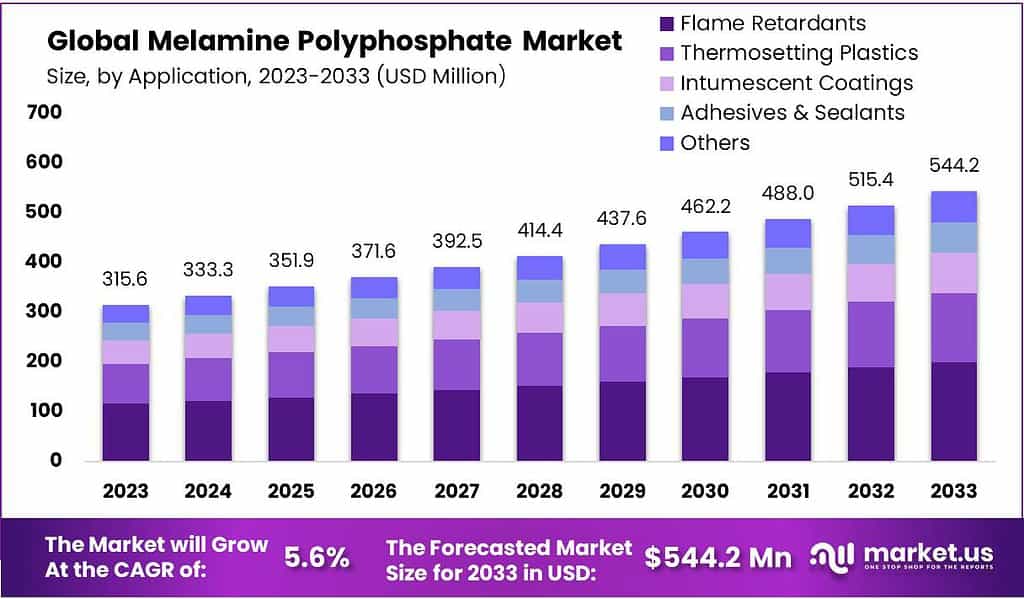
The global Melamine Polyphosphate Market size is expected to be worth around USD 544.2 Million by 2033, from USD 315.6 Million in 2023, growing at a CAGR of 5.6% during the forecast period from 2023 to 2033.
The Melamine Polyphosphate market involves making, selling, and using a substance called melamine polyphosphate. This substance helps make things resistant to catching fire without making them weaker. It’s a mix of melamine and polyphosphoric acid.
Many industries, like electronics, cars, buildings, and clothes, want materials that don’t catch fire easily. Melamine polyphosphate is great for this because it keeps materials strong while making them fire-resistant. It’s especially useful in things like electrical devices, car parts, building stuff, and things in our homes.
The melamine polyphosphate market is growing because safety rules are getting stricter worldwide. More industries need materials that don’t catch fire easily. Also, new technologies are making flame-resistant stuff better. People like melamine polyphosphate because it’s better for the environment than other flame retardants that can be harmful.
Key Takeaways
- Market Growth: Melamine Polyphosphate market value is Projected to USD 544.2 million by 2033, with a CAGR of 5.6%.
- Application Dominance: Flame Retardants hold over 36.7% market share, driven by global fire safety standards.
- Form Preference: Solid Melamine Polyphosphate captures 72.6% market share due to its ease of handling.
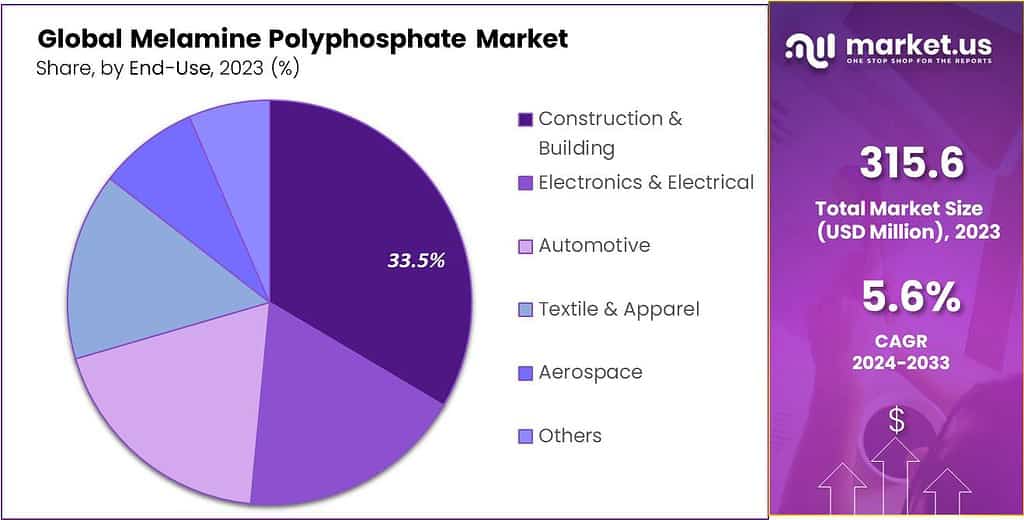
- Sector Influence: Construction & Building sector leads with over 33.5% market share in 2023.
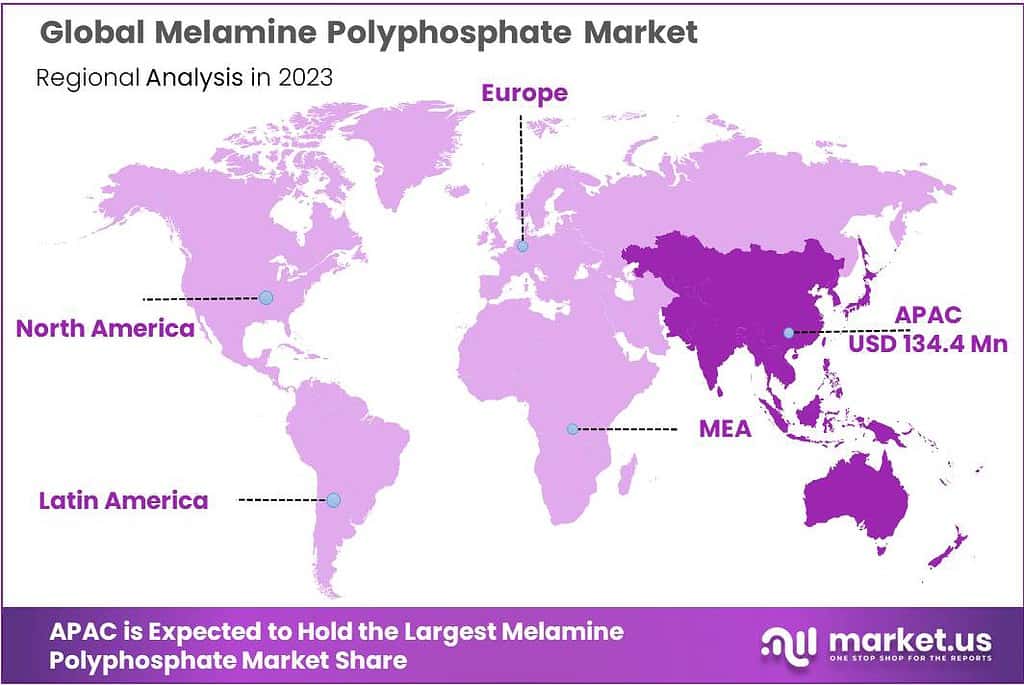
- Regional Dynamics: Asia-Pacific holds over 42.6% market share in 2023, reflecting substantial growth.
- The average particle size of MPP ranges from 5 to 20 micrometers, depending on the manufacturing process and intended application
- China is the largest producer and consumer of MPP, accounting for approximately 60% of the global production capacity.
By Form
In 2023, the Melamine Polyphosphate market exhibited distinctive segmentation based on its physical forms, primarily categorized as Solid and Liquid. Among these, the Solid form emerged as the dominant segment, holding a substantial market position by capturing more than a 72.6% share. The preference for solid Melamine Polyphosphate can be attributed to its ease of handling, storage, and application in various industries.
Solid Melamine Polyphosphate is characterized by its stable and convenient form, making it a preferred choice for manufacturers and end-users. The solid form offers advantages such as easy transportability, reduced spillage risks, and simplified incorporation into production processes. Additionally, its effectiveness in enhancing flame retardancy in diverse materials, including thermoplastics and thermoset polymers, has contributed to its significant market share.
The robust market position of the Solid segment is further driven by its widespread use in critical applications across industries requiring stringent fire safety standards. Products like electrical appliances, automotive components, construction materials, and household items benefit from the fire-resistant properties of solid Melamine Polyphosphate while maintaining the structural integrity and performance of the materials.
By Application
In 2023, the Melamine Polyphosphate market demonstrated notable segmentation based on its diverse applications, including Flame Retardants, Thermosetting Plastics, Intumescent Coatings, Adhesives & Sealants, and Others. Among these applications, Flame Retardants asserted a dominant market position, capturing more than a 36.7% share. This significant market share can be attributed to the critical role played by Melamine Polyphosphate in enhancing fire resistance across various industries.
Flame Retardants, as a primary application segment, witnessed robust demand owing to the increasing emphasis on fire safety standards across multiple sectors. Melamine Polyphosphate, when used as a flame retardant, effectively reduces the flammability of materials without compromising their structural integrity. This makes it an indispensable component in products requiring stringent fire safety compliance, including electrical appliances, automotive components, construction materials, and household items.
The dominance of Flame Retardants is further underscored by the growing awareness of safety regulations globally and the rising need for fire-resistant materials in diverse industries. The effectiveness of Melamine Polyphosphate in mitigating fire hazards, coupled with its environmentally friendly profile, has contributed to its substantial market share within this application segment.
As industries continue to prioritize safety measures, the Flame Retardants segment is poised for sustained growth, with Melamine Polyphosphate playing a pivotal role in meeting the escalating demand for reliable and efficient flame retardant solutions. This underscores the strategic significance of the Flame Retardants application segment in shaping the overall market landscape and driving advancements in fire safety technology.
By End-Use
In 2023, the Melamine Polyphosphate market showcased distinctive segmentation based on end-use applications, encompassing Construction & Building, Electronics & Electrical, Automotive, Textile & Apparel, Aerospace, and Others. Among these end-use segments, Construction & Building emerged as the dominant market player, capturing more than a 33.5% share. This commanding market position is indicative of the pivotal role that Melamine Polyphosphate plays in enhancing fire safety within the construction and building sector.
The Construction & Building segment experienced robust demand for Melamine Polyphosphate due to the increasing emphasis on incorporating fire-retardant materials in construction materials. Melamine Polyphosphate’s efficacy in providing flame retardancy without compromising the structural integrity of materials makes it a vital component in various construction applications. This includes the production of fire-resistant coatings, insulation materials, and other products essential for meeting stringent safety standards in the construction industry.
The dominant market position of Construction & Building is further bolstered by the rising awareness of fire safety regulations and the growing need for durable and fire-resistant structures. Melamine Polyphosphate’s contribution to preventing and mitigating fire hazards in construction materials has positioned it as a preferred choice for architects, builders, and manufacturers in this segment.
As the demand for fire-resistant solutions continues to escalate in the construction and building industry, the Construction & Building segment is anticipated to maintain its dominance. The strategic significance of Melamine Polyphosphate in this sector underscores its role in shaping the overall market landscape and fostering advancements in fire safety technology within the construction and building domain.
Key Маrkеt Ѕеgmеntѕ
By Form
- Solid
- Liquid
By Application
- Flame Retardants
- Thermosetting Plastics
- Intumescent Coatings
- Adhesives & Sealants
- Others
By End-Use
- Construction & Building
- Electronics & Electrical
- Automotive
- Textile & Apparel
- Aerospace
- Others
Market Drivers
Increasing Awareness About Fire Safety Regulations Propel the Growth of the Market
The market for a special fire-stopping ingredient called melamine polyphosphate is growing fast, thanks to more people paying attention to fire safety rules. Governments and important groups are making these rules tougher, saying we need to use materials that can resist flames in lots of different things. This is making more people want to use melamine polyphosphate, especially during this time when the market is expected to get bigger.
Rising Stringency of Fire Safety Regulations Fueling Melamine Polyphosphate Demand
As these fire safety rules get stricter all over the world, the demand for melamine polyphosphate is going up. This is noticeable in building projects, electronics, and cars. For example, in Europe, there’s a rule that says you have to use materials that can stop fires in buildings.
For instance, in the European Union, the Construction Products Regulation (CPR) mandates the use of fire-retardant materials in construction projects. Similarly, the U.S. Consumer Product Safety Commission (CPSC) enforces flammability standards for various consumer goods. These regulations often specify acceptable flame retardancy levels, pushing manufacturers towards incorporating efficient fire retardants like MPP.
Expansion of the Construction Industry Augment the Demand for Chemical
On top of that, with more buildings going up because cities are growing, there’s a big need for materials that don’t burn easily. This need is helping the market for melamine polyphosphate grow even more. So, with all these changes, like tougher safety rules and more construction, the demand for this important chemical is expected to rise.
Restraints
Fluctuating Price of Raw Material Can Hamper the Market Expansion
The market could face some problems because the prices of the materials used to make Melamine Polyphosphate keep going up and down. This can be a challenge for the companies that make Melamine Polyphosphate because it affects how much it costs them to produce it and how much money they make from selling it. Also, not many people know about the good things that Melamine Polyphosphate can do, so not many people are using it yet
Technical Limitations and the Threat of New Technologies:
Although MPP boasts excellent fire retardancy and thermal stability, it might not be the ideal solution for all applications. In some cases, technical limitations like incompatibility with specific polymers or the need for even higher flame retardancy levels might necessitate alternative flame retardants. Additionally, research and development efforts are constantly evolving. The emergence of even more efficient and eco-friendly flame retardant solutions in the future could pose a threat to MPP’s market share.
Limited Awareness and Knowledge Gaps:
Despite its growing popularity, awareness about MPP, particularly in developing regions with high growth potential, might be limited. This lack of awareness can hinder market penetration and adoption by potential users in these regions. Furthermore, knowledge gaps regarding the optimal use of MPP in various applications might exist. Addressing these knowledge gaps through targeted educational initiatives and knowledge sharing becomes crucial for fostering wider market adoption.
Market Opportunities
Focus on Eco-friendly Flame Retardants
More people are caring about the environment and health, so we’re seeing a change in the kind of stuff we use to prevent fires. MPP, a flame retardant, is becoming popular because it’s more eco-friendly. Governments, like the European Union, are also supporting this by putting rules in place that limit harmful substances, making room for safer options like MPP.
Evolving Applications and Rising Demand
MPP isn’t just for construction and cars anymore; it’s being used in more things like electronics, clothes, and furniture because it stops fires and dripping. Electric vehicles (EVs) are on the rise, and MPP could help make them safer by preventing fires in their battery packs.
Technological Advancements and Market Expansion:
People are working to make MPP even better through research. They’re trying new things like mixing it with other flame retardants or making tiny combinations (nanocomposites) to improve how well it works. This focus on making MPP better, along with more people learning about its advantages in different parts of the world, is helping it become more popular.
Market Trends
Growing Focus on Developing Regions
As more cities grow and industries expand, places like Asia Pacific need things that can resist fires. This is a big chance for MPP to become even more popular. People are starting to know more about how MPP helps and some governments might even make rules to make things safer from fires.
Stringent Fire Safety Regulations
Countries all around the world are making stricter rules about fire safety, especially in building things, making electronics, and building cars. In Europe, there’s a rule called Construction Products Regulation (CPR), and in the U.S., there’s another rule from the Consumer Product Safety Commission (CPSC) about how things should not catch fire easily. These rules make companies use fire-resistant materials, and MPP is a good choice for that
Regional Analysis
In 2023, the Asia-Pacific (APAC) region emerged as a powerhouse in the Melamine Polyphosphate market, capturing a commanding market share of over 42.6%. The market value reached USD 134.4 billion, reflecting substantial growth fueled by the region’s strong demand for Melamine Polyphosphate.
This leading position highlights the widespread use and significance of Melamine Polyphosphate across various sectors in the APAC region. The thriving industrial landscape, particularly in areas like construction, electronics, and textiles, was crucial in driving the demand for Melamine Polyphosphate, significantly contributing to the market’s growth.
The region’s economic growth, alongside major infrastructural developments and an increase in manufacturing activities, boosted the consumption of Melamine Polyphosphate. Moreover, the growing population and the rising middle class further amplified the need for construction materials, electronics, and textiles, all of which heavily rely on Melamine Polyphosphate for their flame-retardant properties.
Key Regions and Countries
- North America
- US
- Canada
- Mexico
- Europe
- Germany
- UK
- France
- Italy
- Russia
- Spain
- Rest of Europe
- APAC
- China
- Japan
- South Korea
- India
- Rest of Asia-Pacific
- South America
- Brazil
- Argentina
- Rest of South America
- MEA
- GCC
- South Africa
- Israel
- Rest of MEA
Key Players Analysis
In the dynamic landscape of the Melamine Polyphosphate market, several key players have emerged as influential forces shaping the industry’s trajectory. These companies, through their innovative product offerings, extensive distribution networks, and strategic partnerships, play a critical role in meeting the rising global demand for flame-retardant materials.
Notable among these are chemical giants that have established a strong foothold in various regions, leveraging advanced technology and research capabilities to enhance the performance and environmental profile of their melamine polyphosphate products. These industry leaders are not just focused on production but also on the development of sustainable and efficient solutions that address the stringent fire safety regulations across sectors like construction, electronics, and automotive.
Top Key Рlауеrѕ
- BASF SE
- Clariant AG
- Israel Chemicals Ltd.
- Huber Engineered Materials
- Italmatch Chemicals S.p.A.
- Nutrien Ltd.
- Jiangsu Yoke Technology Co., Ltd.
- Sanwa Flame Retardant Technology Co., Ltd.
- Zhejiang Wansheng Co., Ltd.
- Beijing Dongke United Technologies Co., Ltd.
- AmFine Chemical Corporation
- Nippon Carbide Industries Co., Inc.
- Zhejiang Longyou GD Chemical Industry Co., Ltd.
- Shandong Shouguang Jianyuanchun Co., Ltd.
- Zibo Tianheng New Nanomaterials Technology Co., Ltd.
Recent Developments
- BASF announced plans to expand its MPP production capacity in China in 2023 to meet the growing demand in the region
- 2023 Clariant has emphasized its commitment to developing more sustainable MPP production processes, potentially reducing environmental impact.
Report Scope
| Report Features | Description |
|---|---|
| Market Value (2023) | USD 315.6 Mn |
| Forecast Revenue (2033) | USD 544.2 Mn |
| CAGR (2024-2033) | 5.6% |
| Base Year for Estimation | 2023 |
| Historic Period | 2020-2022 |
| Forecast Period | 2024-2033 |
| Report Coverage | Revenue Forecast, Market Dynamics, COVID-19 Impact, Competitive Landscape, Recent Developments |
| Segments Covered | By Form(Solid, Liquid), By Application(Flame Retardants, Thermosetting Plastics, Intumescent Coatings, Adhesives & Sealants, Others), By End-Use(Construction & Building, Electronics & Electrical, Automotive, Textile & Apparel, Aerospace, Others) |
| Regional Analysis | North America – The US & Canada; Europe – Germany, France, The UK, Spain, Italy, Russia & CIS, Rest of Europe; APAC– China, Japan, South Korea, India, ASEAN & Rest of APAC; Latin America– Brazil, Mexico & Rest of Latin America; Middle East & Africa– GCC, South Africa, & Rest of MEA |
| Competitive Landscape | BASF SE, Clariant AG, Israel Chemicals Ltd., Huber Engineered Materials, Italmatch Chemicals S.p.A., Nutrien Ltd., Jiangsu Yoke Technology Co., Ltd., Sanwa Flame Retardant Technology Co., Ltd., Zhejiang Wansheng Co., Ltd., Beijing Dongke United Technologies Co., Ltd., AmFine Chemical Corporation, Nippon Carbide Industries Co., Inc., Zhejiang Longyou GD Chemical Industry Co., Ltd., Shandong Shouguang Jianyuanchun Co., Ltd., Zibo Tianheng New Nanomaterials Technology Co., Ltd. |
| Customization Scope | Customization for segments, region/country-level will be provided. Moreover, additional customization can be done based on the requirements. |
| Purchase Options | We have three licenses to opt for: Single User License, Multi-User License (Up to 5 Users), Corporate Use License (Unlimited User and Printable PDF) |
Frequently Asked Questions (FAQ)
Melamine Polyphosphate Market size is expected to be worth around USD 544.2 Million by 2033, from USD 315.6 Million in 2023
BASF SE, Clariant AG, Israel Chemicals Ltd., Huber Engineered Materials, Italmatch Chemicals S.p.A., Nutrien Ltd., Jiangsu Yoke Technology Co., Ltd., Sanwa Flame Retardant Technology Co., Ltd., Zhejiang Wansheng Co., Ltd., Beijing Dongke United Technologies Co., Ltd., AmFine Chemical Corporation, Nippon Carbide Industries Co., Inc., Zhejiang Longyou GD Chemical Industry Co., Ltd., Shandong Shouguang Jianyuanchun Co., Ltd., Zibo Tianheng New Nanomaterials Technology Co., Ltd.


