
Quick Navigation
Report Overview
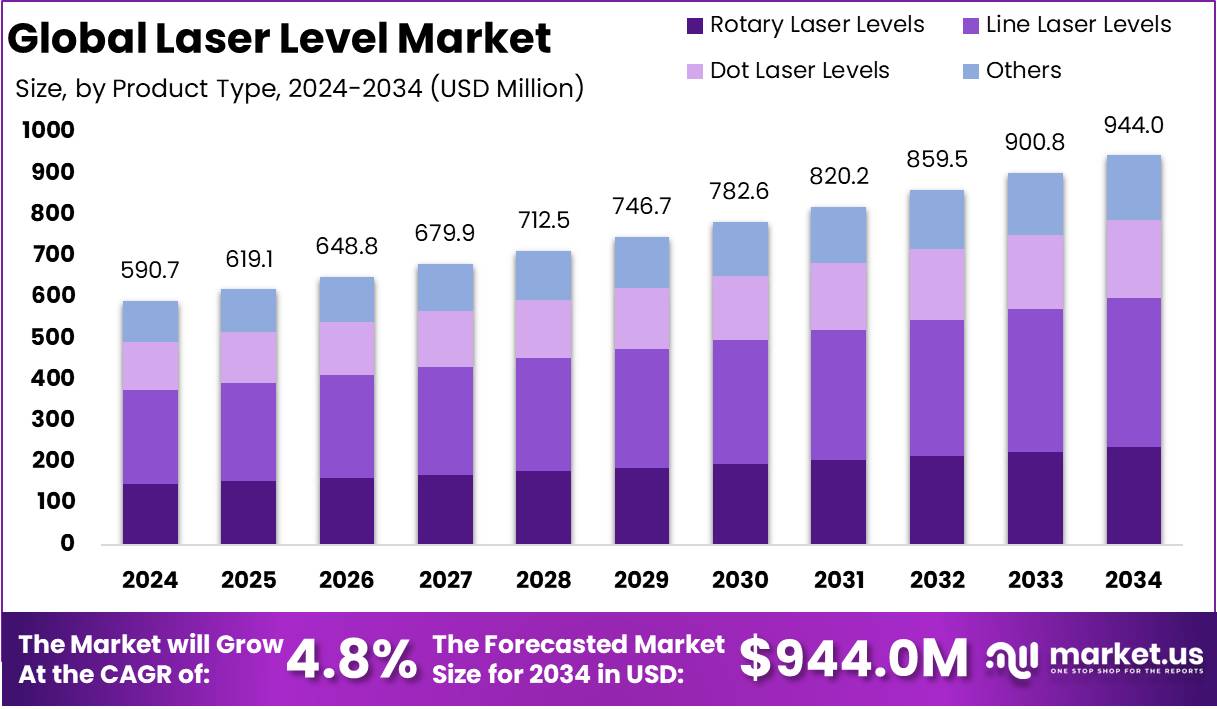
The Global Laser Level Market size is expected to be worth around USD 944.0 Million by 2034 from USD 590.7 Million in 2024, growing at a CAGR of 4.8% during the forecast period from 2025 to 2034.
A laser level is a precision tool used in construction, surveying, and interior design to project a visible laser beam along a horizontal, vertical, or cross line reference. It allows for highly accurate leveling and alignment over various surfaces and distances, significantly improving work efficiency and accuracy. Laser levels are typically powered by batteries and come in several variants including rotary, line, and dot lasers, depending on the intended application. Their integration with digital components and smart technologies has further enhanced operational capabilities, making them a critical instrument in both residential and commercial projects.
The laser level market comprises the global production, distribution, and sale of laser-based leveling instruments used across multiple industries such as construction, infrastructure development, interior decoration, and industrial manufacturing. This market encompasses various product types including rotary lasers, line lasers, and combination lasers, each tailored to specific end-use scenarios.
It also includes associated software and accessories that support enhanced functionality. The market is driven by the rising demand for automation and accuracy in leveling applications, alongside growing construction activities worldwide. Both professional-grade and consumer-grade segments contribute to the overall market structure, reflecting diverse usage patterns.
The growth of the laser level market can be attributed to the expanding global construction sector, driven by rapid urbanization, infrastructure modernization, and increased residential and commercial building projects.
Demand for laser levels is witnessing an upward trajectory, particularly from construction professionals and interior designers who rely on accurate alignment tools for quality assurance. The increasing complexity of construction projects, where precision directly influences project timelines and costs, has intensified the adoption of these tools.
Significant opportunities exist in the laser level market due to the rising penetration of smart technologies and automation in the construction and manufacturing sectors. Innovations in battery life, self-leveling capabilities, and multi-surface adaptability are creating new product differentiation strategies.
According to Xcimer Energy Inc., $100 million was secured in Series A financing from top firms like Hedosophia and Breakthrough Energy Ventures. The investment will fund a Denver facility to build a prototype laser system featuring the largest nonlinear optical pulse compression setup. This marks major progress in laser-based fusion technology. Such advancements will positively influence the laser level market, improving precision, power, and integration across industrial applications.
According to TANNER RESOURCES, the Laser Level Market is witnessing rising demand driven by high-precision needs in indoor and large-scale construction tasks. Line lasers deliver ±1/8-inch accuracy across 33 feet, enhancing cabinet installations and wall alignment. Rotary laser levels offer 360-degree coverage and reach up to 2,000 feet with 1/16-inch precision per 100 feet.
Key Takeaways
- The global laser level market is projected to reach approximately USD 944.0 million by 2034, up from USD 590.7 million in 2024, expanding at a compound annual growth rate (CAGR) of 4.8% during the forecast period from 2025 to 2034.
- Line laser levels emerged as the dominant product category in 2024, accounting for over 38.4% of the global market share.
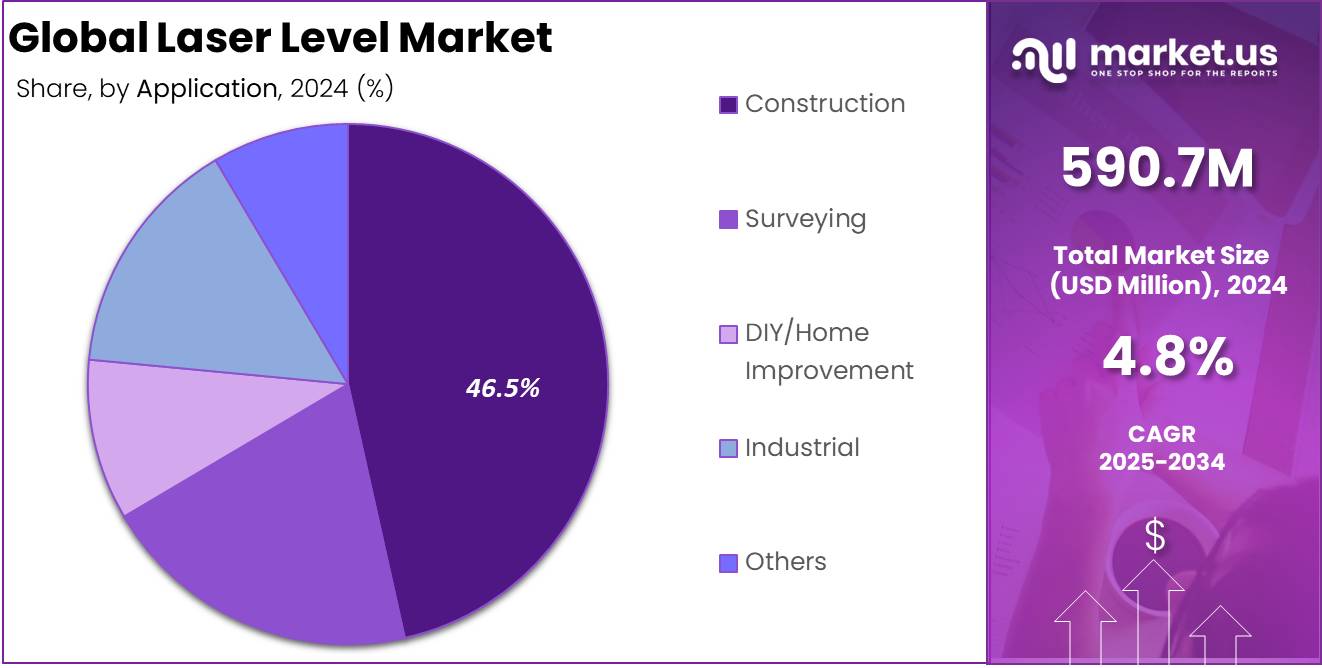
- The construction sector remained the primary application segment for laser levels, commanding a market share exceeding 46.5% in 2024.
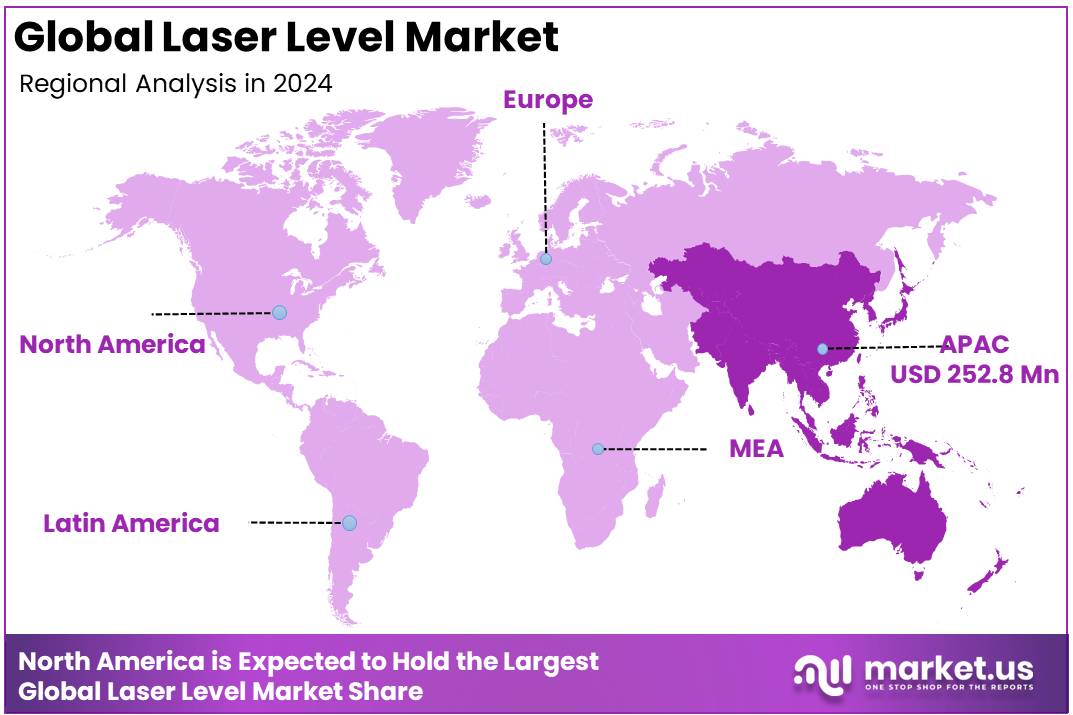
- The Asia-Pacific region led the global market, contributing a market share of 42.8% in 2024, with an estimated regional market value of approximately USD 252.8 million.
By Product Analysis
Line Laser Levels Dominated the Laser Level Market, Capturing Over 38.4% Share
In 2024, Line Laser Levels maintained a dominant market position in the By Product Type segment of the Laser Level Market, capturing more than a 38.4% share. Line laser levels are widely adopted due to their simplicity, accuracy, and suitability for both indoor and light-duty outdoor applications. These devices are extensively used in alignment, leveling, and layout tasks across construction, carpentry, and interior decorating projects.
Their user-friendly features, such as horizontal and vertical beam projection, self-leveling capabilities, and compact designs, have made them a preferred choice among professionals and DIY users. The growing demand for precise leveling tools in residential and commercial building activities has significantly contributed to the segment’s growth.
The increasing adoption of digital construction tools and the integration of smart technologies into basic instruments have further supported the expansion of the line laser level segment. The affordability of these models compared to other types, combined with their adequate range and visibility for most general tasks, has allowed them to dominate the market in terms of unit sales. As construction practices evolve toward precision and efficiency, the market share of line laser levels is expected to maintain steady growth.
Rotary laser levels are essential in large-scale construction due to their ability to offer 360-degree coverage for tasks like grading, site layout, and concrete leveling. Their durability and accuracy have made them a preferred choice for professional environments, particularly in commercial and infrastructure projects. The increasing automation in construction and advanced features, such as remote operation and dual-axis self-leveling, have further boosted their demand despite their higher cost compared to other laser tools.
Dot laser levels are used for short-distance point alignment in tasks such as plumbing and framing. Their compact design and affordability make them ideal for residential and light commercial applications. While their low cost and portability make them popular in cost-sensitive markets, their limited range restricts their use in larger or more complex projects.
The Others segment, including hybrid and cross-line laser levels, combines multiple functionalities to provide versatile solutions for complex tasks. These models are gaining traction among users seeking flexibility and precision. Technological advancements, such as smart sensors and wireless connectivity, are driving growth, especially in compact construction and smart building projects. Although smaller in market share, this segment shows strong potential for future expansion.
By Application Analysis
Construction Dominated the Laser Level Market, Capturing Over 46.5% Share
In 2024, Construction maintained a dominant position in the By Application segment of the Laser Level Market, capturing more than a 46.5% share. The construction industry is the largest end-user of laser levels, owing to the widespread use of these tools in residential, commercial, and infrastructure projects. Laser levels are crucial for tasks such as leveling, alignment, grading, and layout, providing high accuracy and efficiency in construction processes.
The growing demand for precision and time-saving tools in construction activities has significantly contributed to the rise in laser level adoption. The trend of large-scale construction projects worldwide, especially in urban development and infrastructure, is expected to continue driving the demand for laser levels in this sector.
The construction industry is further supported by technological advancements in laser levels, including self-leveling capabilities, enhanced range, and improved durability. These innovations have made laser levels more reliable and versatile, contributing to their widespread use across various construction tasks. The shift towards smart construction tools and automation is also expected to boost the demand for advanced laser levels in the coming years.
In 2024, Surveying held a significant position in the Laser Level Market within the By Application category. Surveying professionals extensively use laser levels for tasks such as land mapping, site surveying, and establishing precise reference points. These tools provide enhanced accuracy and efficiency, essential for both large and small-scale projects.
The demand for laser levels in this field is driven by global infrastructure development, urbanization, and land surveying activities. Technological advancements, like the integration of laser levels with GPS and other surveying tools, have further expanded their application and efficiency.
The DIY/Home Improvement segment has grown significantly, as laser levels are increasingly adopted for projects such as painting, shelving, and tiling. These tools offer high precision and ease of use, making them popular among DIY enthusiasts and homeowners. The growing interest in home renovation projects has boosted the demand for affordable, compact laser tools. As technological advancements make these tools more versatile, the DIY market for laser levels is expected to continue expanding.
In the Industrial sector, laser levels are primarily used for precision tasks like equipment alignment and machinery installation. These tools are crucial in environments that require reliable, accurate measurements for optimal efficiency and safety. As industrial processes become more automated, the demand for high-performance laser levels is anticipated to increase, particularly in sectors such as manufacturing and automotive, where they improve productivity and reduce downtime.
The Others segment includes specialized applications in fields like agriculture, entertainment, and Luxury interior design, where laser levels are used for tasks like land leveling and stage design. Although this segment holds a smaller share, its growth potential remains strong due to increasing awareness and advancements in laser technology. As users recognize the benefits of these tools across various industries, the adoption of laser levels in niche applications is expected to expand gradually.
Key Market Segments
By Product Type
- Rotary Laser Levels
- Line Laser Levels
- Dot Laser Levels
- Others
By Application
- Construction
- Surveying
- DIY/Home Improvement
- Industrial
- Others
Driver
Rising Demand in Precision Construction and Interior Fit-Out Applications
The increasing emphasis on precision in modern construction and interior fit-out projects has become a major driver for the growth of the global laser level market. As building designs grow more complex and client expectations for quality and accuracy continue to rise, contractors and technicians are seeking more efficient and reliable tools.
Laser levels, known for their accuracy, speed, and ease of use, have emerged as essential instruments for aligning structural components, installing fixtures, and performing layout tasks. Their ability to project consistent level lines across surfaces enhances the overall quality of work and minimizes human error, making them indispensable in both residential and commercial construction settings.
Moreover, the shift toward professional-grade construction practices across emerging and mature economies has further fueled the demand for laser leveling tools. This trend is also supported by increased renovation and remodeling activities, where laser levels help streamline complex installations such as cabinetry, tiling, and partitioning.
Interior designers and contractors increasingly rely on laser levels to maintain visual alignment and spatial balance, enhancing aesthetic appeal. As industry professionals prioritize faster execution with precise outcomes, the utility of laser levels continues to grow. This expanding reliance across diverse construction sub-sectors is contributing to the robust market demand observed in 2024.
Restraint
High Initial Costs and Limited Accessibility for Small-Scale Users
One of the primary restraints affecting the global laser level market is the high upfront cost of advanced laser level systems, which limits their adoption among small contractors, individual tradespeople, and DIY users.
High-precision devices, particularly those with rotary or multi-line functions, often require a larger initial investment, which may include additional costs for accessories such as tripods, detectors, or rechargeable power systems. These expenses can deter small-scale users from transitioning away from traditional spirit levels, which remain significantly more affordable and readily accessible in many local markets.
Another aspect limiting market penetration is the lack of awareness and product availability in underserved or price-sensitive regions. Many users are unfamiliar with the benefits and operational capabilities of laser levels, especially in areas where training resources and retail distribution channels are underdeveloped.
This results in a slower pace of adoption, as potential users may be hesitant to invest in tools they do not fully understand or trust. Without targeted efforts to enhance affordability and accessibility, this cost-related restraint may continue to hinder the broader adoption of laser level tools across market segments that could otherwise benefit from their use in improving precision and efficiency.
Opportunity
Integration of Green Laser Technology for Enhanced Visibility
The integration of green laser technology into modern leveling tools presents a significant opportunity for market expansion. Green lasers offer superior visibility under a wide range of lighting conditions, especially in well-lit indoor spaces or outdoor environments where red lasers can be difficult to see.
This enhanced visibility enables more accurate alignment and layout operations over longer distances and across reflective surfaces. As a result, green laser levels are becoming increasingly preferred in professional construction, surveying, and infrastructure projects that demand high precision under challenging conditions.
This opportunity is further strengthened by growing user awareness of the operational advantages of green laser levels. Professionals in construction, renovation, and industrial maintenance are opting for tools that enhance productivity without compromising on accuracy. Green laser levels also require fewer repositioning steps, which helps reduce labor time and increases efficiency on the job site.
As manufacturers continue to improve diode durability and reduce the cost of producing green lasers, these devices are becoming more accessible across different user segments. This ongoing shift toward more visible and effective laser technologies is expected to play a key role in driving demand for next-generation laser levels across global markets.
Trends
Proliferation of Smart and Bluetooth-Enabled Laser Levels
A key trend shaping the laser level market in 2024 is the growing integration of smart technology into leveling tools, particularly through Bluetooth connectivity and mobile app interfaces. These smart-enabled laser levels allow users to operate the device remotely, perform real-time adjustments, and synchronize data with digital project management platforms.
This level of connectivity not only enhances convenience but also aligns with the broader digitalization efforts taking place across the construction and surveying industries. Professionals can now manage measurement data, monitor battery usage, and store layout records more efficiently, all from a centralized mobile application.
The adoption of such intelligent systems is being driven by the increasing demand for workflow automation and error reduction in project execution. With connected tools, users are better able to maintain consistency, manage complex site conditions, and reduce the time spent on manual calibration. This trend is particularly relevant for large-scale infrastructure and commercial building projects, where digital collaboration and remote monitoring are becoming standard practices.
The shift toward integrated, app-based laser levels represents a significant leap in tool functionality and user control. As digital ecosystems become more prevalent in field operations, smart-enabled laser levels are expected to become a central element of the modern construction toolkit.
Regional Analysis
Asia-Pacific Leads the Laser Level Market with the Largest Market Share of 42.8% in 2024
The global laser level market demonstrates significant regional variation, with Asia-Pacific emerging as the leading region, accounting for the largest share of 42.8% in 2024. The regional market value reached approximately USD 252.8 million during the year, underpinned by robust infrastructure development, rising construction activity, and rapid industrialization across emerging economies such as China, India, and Southeast Asia. Increased government investment in smart city projects, transportation infrastructure, and residential construction has bolstered the demand for precise leveling tools, including laser levels.
Furthermore, the surge in urban development and renovation projects continues to drive adoption of these instruments, especially in commercial and civil engineering applications. The dominance of Asia-Pacific is further reinforced by the availability of a skilled workforce, cost-effective manufacturing, and favorable regulatory frameworks promoting construction safety and precision engineering.
North America remains a vital contributor to the global laser level market, driven primarily by advanced technological adoption and strong demand from both the residential and commercial construction sectors. High standards in construction accuracy, increasing automation in construction practices, and the rising trend of remodeling activities across the United States and Canada support the regional market’s expansion.
Meanwhile, Europe holds a stable position, supported by stringent construction quality standards, energy-efficient building practices, and rising investments in public infrastructure. Countries such as Germany, France, and the UK are witnessing growing utilization of laser levels, especially in large-scale civil engineering projects and high-rise construction where precision tools are critical.
The Middle East & Africa region shows progressive growth, influenced by mega construction projects in the Gulf Cooperation Council (GCC) countries and increasing urbanization. The region’s efforts to diversify economies through large-scale commercial and infrastructure developments have contributed to the rising adoption of laser leveling technologies.
Latin America, while representing a smaller share, is experiencing moderate growth, driven by residential housing programs and public infrastructure investments, particularly in countries like Brazil and Mexico. Collectively, these trends highlight a globally growing inclination toward accurate, time-efficient construction methods, with Asia-Pacific firmly positioned as the dominant region by market share and revenue.
Key Regions and Countries
- North America
- The US
- Canada
- Europe
- Germany
- France
- The UK
- Spain
- Italy
- Russia & CIS
- Rest of Europe
- APAC
- China
- Japan
- South Korea
- India
- ASEAN
- Rest of APAC
- Latin America
- Brazil
- Mexico
- Rest of Latin America
- Middle East & Africa
- GCC
- South Africa
- United Arab Emirates
Key Players Analysis
In 2024, the global laser level market is characterized by a competitive landscape featuring several established players, each contributing to market growth through innovation, strategic acquisitions, and geographical expansion. Stanley Black & Decker leads the market with its strong brand recognition and extensive distribution network, focusing on durability and precision in product development. Their investments in digital tools position them as a key player in the market.
Fortive Corporation, through its subsidiary Fluke, provides advanced measurement solutions targeted at industrial and professional users. The company’s emphasis on high-tech features and smart tools positions it well in the growing market for digital and connected devices. Hilti Corporation stands out with its focus on premium construction tools, including high-precision laser levels that cater to demanding applications in commercial construction. Their reputation for quality and performance makes them a preferred choice among professionals in the sector.
Hexagon AB and Trimble Inc. are technological giants driving the future of laser levels, particularly with their integration of positioning systems, digital construction, and automation technologies. Both companies focus on advanced features such as 3D scanning and data integration, providing added value to large-scale construction projects. Robert Bosch GmbH continues to strengthen its market position with a diverse range of laser measurement tools that appeal to both professionals and DIY enthusiasts. Their focus on ease of use, compactness, and affordable pricing makes them a strong contender in the consumer segment
Stabila, Kapro Industries Ltd., Johnson Level and Tool Mfg. Co., Inc., and Sola complement the market with specialized laser levels tailored to precise measurement and alignment needs. These companies differentiate themselves through innovation, product variety, and a strong reputation for producing high-quality, reliable tools.
Top Key Players in the Market
- Stanley Black and Decker
- Fortive Corporation
- Hilti Corporation
- Hexagon AB
- Trimble Inc
- Robert Bosch GmbH
- Stabila
- Kapro Industries Ltd
- Johnson Level and Tool Mfg. Co. Inc
- Sola etc
Recent Developments
- In 2025, Dremel introduced the Blueprint Multi-Drill, designed especially for home users handling light-duty projects. This compact tool is built for drilling holes and driving screws while offering added convenience with its built-in stud sensor and detachable laser level. The drill is developed to simplify common household tasks like installing wall mounts and shelves, ensuring better accuracy and user control.
- In 2024, Leica Geosystems, part of Hexagon, launched the Leica iCON trades solution on 11 September. This includes the iCON iCS20 and iCS50 sensors tailored for precise construction layout work. The system features the Leica vPole, which supports free movement and automatic height detection using a unique design. Together, the sensors and pole improve layout accuracy, especially in tight or complex spaces.
- In 2023, Trimble launched the Trimble X9 3D laser scanning system on May 23. The new device supports professionals in construction, surveying, and engineering by providing reliable 3D capture. It includes self-leveling, built-in calibration, and Trimble’s X-Drive technology to ensure accurate scanning under varied conditions, supporting both speed and precision on job sites.
- In 2024, Fanttik revealed its latest lineup of laser levels on April 15. The series includes models like D2, D2 Pro, D12 Pro, and the newly launched D16 Apex. Designed for professional-grade construction, the D16 Apex is equipped with self-leveling technology to help users achieve precise alignment quickly and efficiently in various building scenarios.
- In 2024, Xcimer Energy announced raising $100 million in Series A funding to support its inertial fusion energy goals. With the backing of major investors like Breakthrough Energy Ventures and Lowercarbon Capital, the company will set up a facility in Denver to develop a prototype laser system. This system aims to push forward the commercial potential of laser-driven fusion energy.
Report Scope
| Report Features | Description |
|---|---|
| Market Value (2024) | USD 590.7 Million |
| Forecast Revenue (2034) | USD 944.0 Million |
| CAGR (2025-2034) | 4.8% |
| Base Year for Estimation | 2024 |
| Historic Period | 2020-2023 |
| Forecast Period | 2025-2034 |
| Report Coverage | Revenue Forecast, Market Dynamics, Competitive Landscape, Recent Developments |
| Segments Covered | By Product Type (Rotary Laser Levels, Line Laser Levels, Dot Laser Levels, Others), By Application (Construction, Surveying, DIY/Home Improvement, Industrial, Others) |
| Regional Analysis | North America – The US, Canada, & Mexico; Western Europe – Germany, France, The UK, Spain, Italy, Portugal, Ireland, Austria, Switzerland, Benelux, Nordic, & Rest of Western Europe; Eastern Europe – Russia, Poland, The Czech Republic, Greece, & Rest of Eastern Europe; APAC – China, Japan, South Korea, India, Australia & New Zealand, Indonesia, Malaysia, Philippines, Singapore, Thailand, Vietnam, & Rest of APAC; Latin America – Brazil, Colombia, Chile, Argentina, Costa Rica, & Rest of Latin America; Middle East & Africa – Algeria, Egypt, Israel, Kuwait, Nigeria, Saudi Arabia, South Africa, Turkey, United Arab Emirates, & Rest of MEA |
| Competitive Landscape | Stanley Black and Decker, Fortive Corporation, Hilti Corporation, Hexagon AB, Trimble Inc, Robert Bosch GmbH, Stabila, Kapro Industries Ltd, Johnson Level and Tool Mfg. Co. Inc, Sola etc |
| Customization Scope | Customization for segments, region/country-level will be provided. Moreover, additional customization can be done based on the requirements. |
| Purchase Options | We have three licenses to opt for: Single User License, Multi-User License (Up to 5 Users), Corporate Use License (Unlimited User and Printable PDF) |


