
Quick Navigation
Report Overview
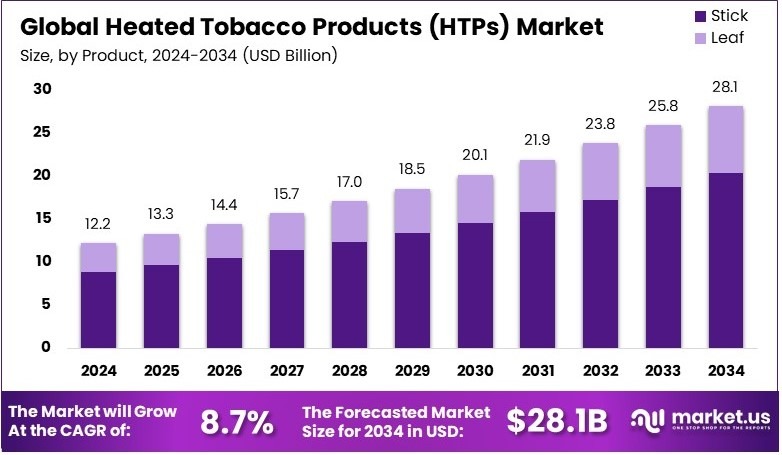
The Global Heated Tobacco Products (HTPs) Market size is expected to be worth around USD 28.1 Billion by 2034, from USD 12.2 Billion in 2024, growing at a CAGR of 8.7% during the forecast period from 2025 to 2034.
Heated Tobacco Products (HTPs) are devices that heat tobacco at controlled temperatures to generate an inhalable aerosol. They offer an alternative to traditional combustion-based smoking. HTPs are designed with modern technology to provide consistent nicotine delivery and reduced odor. They are available in various models for consumer use for reliability.
The Heated Tobacco Products Market encompasses the commercial activities related to the production, distribution, and sale of HTP devices. It includes manufacturers, distributors, and retailers operating under regulatory standards. The market is structured to ensure consistent product quality, availability, and adherence to safety guidelines across different consumer segments and regions.
Heated Tobacco Products (HTPs) are gaining traction as consumers seek alternatives to traditional smoking. Major companies like Philip Morris International (PMI) are leading this shift. In 2023, PMI reported that its shipment volumes of heated tobacco units rose to 125.3 billion units, a significant increase from 109.2 billion units in 2022. This growth highlights the rising consumer acceptance and demand for HTPs.
Additionally, the HTP market is witnessing substantial investments from tobacco companies aiming to capitalize on the shift toward reduced-risk products. Japan Tobacco International (JTI) invested approximately ¥450 billion ($3 billion) into these products, demonstrating the industry’s commitment to this emerging sector.
However, the market is nearing saturation, with numerous players competing for market share, which intensifies the need for innovation and differentiation. Government regulations also play a critical role, influencing market dynamics by enforcing standards that ensure product safety and control market entry. These factors collectively impact the local and broader market, shaping the competitive landscape and future growth trajectory of the HTP sector.
Key Takeaways
- The Heated Tobacco Products (HTPs) Market was valued at USD 12.2 billion in 2024 and is expected to reach USD 28.1 billion by 2034, with a CAGR of 8.7%.
- In 2024, Stick dominated the product segment with 72.4%, preferred for its convenience and close resemblance to traditional cigarettes.
- In 2024, Regular category led with 64.5%, as it appeals to consumers seeking a non-flavored tobacco experience.
- In 2024, Original Tobacco dominated the flavor segment with 54.4%, due to its preference among traditional smokers.
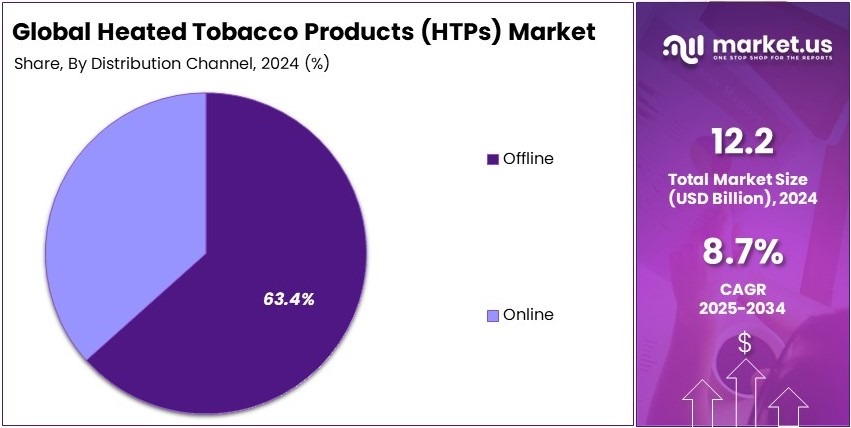
- In 2024, Offline channels led the distribution segment with 63.4%, benefiting from consumer trust and accessibility.
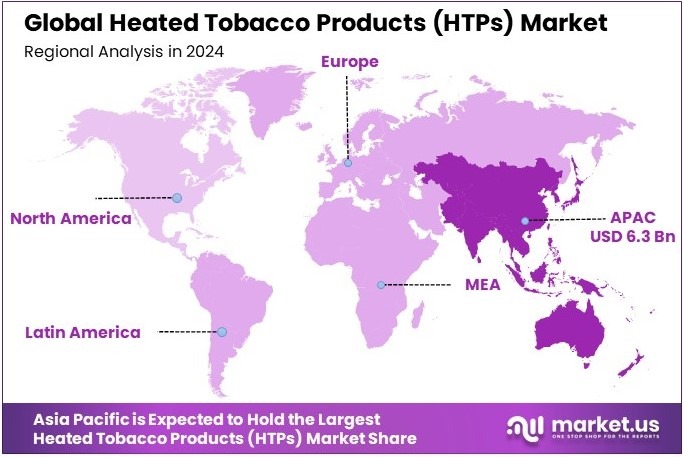
- In 2024, APAC dominated the market with 51.3% share, valued at USD 6.3 billion, driven by growing product acceptance.
Product Analysis
Stick dominates with 72.4% due to its convenience, ease of use, and strong consumer preference.
The heated tobacco products (HTPs) market is segmented into sticks and leaf products. Sticks dominate with a 72.4% market share, primarily because they offer a convenient and mess-free smoking experience. Many consumers prefer sticks over loose leaf tobacco since they are pre-portioned, require minimal handling, and work seamlessly with heating devices.
The growing adoption of HTPs among former cigarette smokers also supports the popularity of sticks, as they provide a familiar format. Additionally, leading brands focus on producing a variety of stick-based options, including different nicotine levels and flavors, increasing their appeal. The regulatory environment also plays a role, as some countries favor stick-based products due to easier control over nicotine content.
Leaf products remain a niche segment, catering to traditional tobacco users who prefer customizable smoking experiences. Some consumers enjoy the flexibility of using different blends and strengths, but the preparation process can be inconvenient. While the leaf segment is smaller, it still contributes to market growth by offering an alternative to pre-filled sticks.
Category Analysis
Regular dominates with 64.5% due to its similarity to traditional cigarettes and preference among transitioning smokers.
The category segment is divided into regular and flavored products. Regular HTPs lead with a 64.5% share as they closely mimic the taste and experience of traditional tobacco. Many consumers switching from cigarettes prefer regular heated tobacco because it delivers a familiar sensation without the strong artificial flavors found in some alternatives.
The tobacco industry has focused on marketing regular HTPs as a healthier alternative to smoking while still maintaining the core experience. Additionally, regulatory restrictions on flavored products in several markets have pushed many consumers toward regular options.
Flavored products appeal to younger and experimental users, offering a variety of tastes such as menthol, fruit, and dessert flavors. Although flavors enhance product diversity and attract new users, they face regulatory challenges in many countries. Some governments have banned flavored tobacco due to concerns over youth appeal, limiting its market share.
Flavor Analysis
Original Tobacco dominates with 54.4% due to its classic taste and strong consumer preference among smokers.
The market is segmented into original tobacco, menthol, fruity flavors, and others. Original tobacco holds a 54.4% market share because most HTP users are former cigarette smokers who prefer the natural taste of tobacco.
Companies have developed heating technologies that enhance the tobacco flavor without producing combustion byproducts, making these products more appealing to health-conscious smokers. Additionally, regulatory bodies often allow original tobacco products while restricting flavored alternatives, reinforcing their market dominance.
Menthol remains popular among users who prefer a cooling sensation, but regulatory bans in several countries have slowed its growth. Fruity flavors attract younger consumers and those looking for a unique experience, but their appeal is limited by legal restrictions. The “others” category includes specialty flavors such as coffee and vanilla, catering to niche markets.
Distribution Channel Analysis
Offline dominates with 63.4% due to consumer preference for in-person purchases and regulatory restrictions on online sales.
The market is divided into online and offline sales. Offline channels hold the largest share at 63.4% because consumers prefer to buy HTPs in physical stores where they can see product options, ask for recommendations, and verify authenticity.
Additionally, regulatory restrictions on online tobacco sales in many countries force consumers to purchase from retail stores, further supporting offline sales growth. Many leading brands invest heavily in in-store promotions, loyalty programs, and exclusive retail partnerships to drive foot traffic and boost sales.
Online sales are growing, particularly in regions with relaxed e-commerce regulations. Consumers enjoy the convenience of ordering products from home, accessing a wider selection, and receiving promotional discounts. However, strict age verification laws and shipping restrictions limit online sales in many markets.
Key Market Segments
By Product
- Stick
- Leaf
By Category
- Regular
- Flavored
By Flavor
- Original Tobacco
- Menthol
- Fruity Flavors
- Others
By Distribution Channel
- Online
- Offline
Driving Factors
Consumer Shift and Technological Advancements Drive Market Growth
The growing preference for safer alternatives to conventional cigarettes is a key factor driving the heated tobacco products (HTPs) market. Consumers are increasingly looking for reduced-risk tobacco options, and HTPs are positioned as a middle ground between traditional smoking and complete nicotine cessation. This shift is particularly strong among adult smokers who seek a less harmful experience while maintaining the ritual of smoking.
Aggressive marketing by major tobacco companies is further fueling demand. Brands are investing in high-profile campaigns, celebrity endorsements, and digital advertising to promote heated tobacco devices as modern and innovative. This strong branding strategy is helping to shape consumer perception and expand the market reach of HTPs.
Technological advancements in heated tobacco devices are also playing a significant role. Companies are continuously improving battery efficiency, heating mechanisms, and user-friendly designs to enhance consumer experience. Many devices now offer adjustable heat settings, ensuring better flavor and nicotine delivery.
Additionally, legislative changes in certain regions favor reduced-harm tobacco products. Some governments are adopting a harm-reduction approach, regulating HTPs differently from cigarettes and allowing them to be marketed as alternatives. This regulatory support is providing companies with opportunities for expansion and growth in key markets.
Restraining Factors
Regulatory Challenges and Cost Barriers Restrain Market Growth
Despite growing acceptance, heated tobacco products face ongoing debates regarding their long-term health effects. Scientific studies on HTPs are still evolving, and uncertainty remains about their actual harm reduction compared to traditional smoking. This lack of conclusive evidence affects consumer trust and regulatory decisions.
The high cost of devices and consumables also limits adoption. Unlike traditional cigarettes, HTPs require a one-time investment in a heating device, followed by recurring expenses for tobacco sticks or capsules. This pricing model makes it difficult for price-sensitive smokers to switch.
Stringent regulations in several countries further challenge market expansion. Some governments have imposed outright bans on HTPs, while others enforce strict marketing and distribution policies. These regulatory hurdles slow down adoption and restrict companies from reaching potential consumers.
Competition from other nicotine delivery systems, such as e-cigarettes and nicotine pouches, adds another layer of difficulty. Many consumers view e-cigarettes as a more affordable and customizable alternative. The presence of multiple reduced-risk products in the market forces HTP brands to differentiate themselves and justify their pricing.
Growth Opportunities
Product Innovation and Market Expansion Provide Opportunities
The development of next-generation heated tobacco products presents significant growth opportunities. Manufacturers are enhancing user experience with improved heating technology, faster charging, and longer battery life. Devices with smart features, such as Bluetooth connectivity for usage tracking, are attracting tech-savvy consumers.
Expanding into untapped markets is another key opportunity. While some regions impose strict regulations, others are gradually relaxing their stance on alternative tobacco products. Emerging markets in Asia, Latin America, and Eastern Europe are becoming potential growth areas for HTP brands.
Strategic alliances between tobacco companies and technology firms are also driving innovation. These partnerships allow for better product development, leading to improved designs and more efficient heating systems. Collaborative efforts can accelerate market penetration and increase consumer confidence in HTPs.
Additionally, increased research and development (R&D) investments are helping companies substantiate health claims. Scientific backing and transparent studies on risk reduction can strengthen consumer trust and improve regulatory approval. Brands that invest in R&D are likely to gain a competitive advantage in the evolving tobacco landscape.
Emerging Trends
Stylish Designs and Digital Marketing Are Latest Trending Factors
The launch of compact and stylish heated tobacco devices is becoming a key trend. Consumers now prefer sleek, lightweight designs that resemble high-end tech gadgets. Aesthetic appeal plays a major role in purchasing decisions, especially among younger adult smokers looking for a modern alternative.
Growing online sales channels are also shaping market trends. Many tobacco companies are shifting to direct-to-consumer marketing, selling HTPs through e-commerce platforms and official brand websites. This approach allows them to reach a wider audience while maintaining control over branding and customer engagement.
Heat-not-burn technology is gaining widespread adoption as a new standard in tobacco consumption. Unlike e-cigarettes that use liquid nicotine, HTPs offer a tobacco-based experience without combustion, appealing to smokers who prefer traditional flavors. This shift is driving further investment in product development.
Consumer demand for diverse flavor and strength options is another major trend. Many users seek customization in their smoking experience, pushing brands to introduce a variety of tobacco blends, menthol-infused sticks, and even flavor capsules. Expanding product variety helps brands retain consumer interest and drive sales growth.
Regional Analysis
APAC Dominates with 51.3% Market Share in Heated Tobacco Products Market
Asia Pacific leads the heated tobacco products (HTPs) market with a 51.3% share, amounting to USD 6.3 billion. This substantial market share is driven by strong consumer adoption in countries like Japan and South Korea, where smoking culture is prevalent and public smoking restrictions are increasing.
Key factors contributing to this dominance include technological innovation in HTPs, aggressive marketing by leading tobacco companies, and regulatory landscapes that are more receptive to these products compared to traditional cigarettes. Additionally, the cultural acceptance of smoking and the shift towards perceived safer alternatives boost HTP sales.
The future influence of APAC in the global HTPs market is expected to grow with continuous product innovation and expanding market penetration. As awareness of the potential reduced risks associated with HTPs increases, more consumers are likely to adopt these products, further cementing APAC’s leading position.
Regional Mentions:
- North America: North America is exploring the heated tobacco products market, with increasing consumer interest in alternatives to conventional smoking. Regulatory challenges persist, but gradual acceptance might see growth in market share.
- Europe: Europe shows significant interest in heated tobacco products, supported by stringent smoking regulations and high health consciousness among consumers. This region could see increased adoption driven by public health campaigns and regulatory adjustments.
- Middle East & Africa: The Middle East and Africa are slowly adapting to heated tobacco products, with market growth driven by urban consumer segments and increased availability. The region’s diverse regulatory environments will play a key role in market expansion.
- Latin America: Latin America’s market for heated tobacco products is in its nascent stages, with gradual consumer interest spurred by the global trend towards harm reduction in tobacco use. Market development will depend on regulatory frameworks and consumer education.
Key Regions and Countries Covered in the Report
- North America
- US
- Canada
- Europe
- Germany
- France
- The UK
- Spain
- Italy
- Rest of Europe
- Asia Pacific
- China
- Japan
- South Korea
- India
- Australia
- Rest of APAC
- Latin America
- Brazil
- Mexico
- Rest of Latin America
- Middle East & Africa
- South Africa
- Saudi Arabia
- UAE
- Rest of MEA
Competitive Landscape
In the rapidly evolving Heated Tobacco Products (HTPs) market, several major companies stand out due to their innovation, extensive market reach, and strong brand portfolios. The top players dominating this market include Philip Morris International Inc., British American Tobacco p.l.c., Japan Tobacco Inc, and KT&G Corporation.
Philip Morris International Inc. (PMI) is a leader in the HTPs market, primarily with its IQOS products. PMI has been at the forefront of marketing and developing HTPs, focusing on alternatives to traditional cigarettes. Their success is driven by significant investments in technology and marketing, coupled with a strong global distribution network.
British American Tobacco p.l.c. (BAT) offers a range of HTPs, including their glo brand. BAT has invested heavily in research and development to produce products that appeal to existing smokers looking for lower-risk alternatives. Their strategic focus on innovation and global brand strength has helped them secure a substantial market share.
Japan Tobacco Inc (JT) has made significant inroads into the HTPs market with its Ploom brand. JT’s strategy focuses on leveraging cutting-edge technology to develop products that provide authentic tobacco taste and high consumer satisfaction. Their strong presence in Asia, particularly in Japan, supports their competitive edge in the market.
KT&G Corporation, South Korea’s leading tobacco company, has expanded its portfolio with innovative HTPs like the lil brand. KT&G’s focus on local and international markets, coupled with its commitment to R&D, allows it to adapt quickly to consumer demands and emerging trends.
These top companies are shaping the future of the HTPs market through continuous product innovation, aggressive marketing strategies, and expansive global reach. Their efforts are not only enhancing their market position but also driving the overall growth of the industry, as they capitalize on the increasing demand for smoke-free alternatives.
Major Companies in the Market
- Philip Morris International Inc.
- British American Tobacco p.l.c.
- Imperial Brands Plc
- KT&G Corporation
- PAX Labs Inc.
- Japan Tobacco Inc.
- Altria Group
- PMFTC Inc.
- Korea Tobacco & Ginseng Corporation
- Taiwan Tobacco & Liquor Corporation
- JUUL Labs
Recent Developments
- Philip Morris International: On February 2025, Philip Morris International announced the upcoming launch of its IQOS Iluma i series in Korea. The new lineup introduces features such as a touch screen, extended usage time through additional puffs, and a temporary pause function. The devices will be available in two models—the IQOS Iluma i Prime and the standard IQOS Iluma i—and come in five different colors.
Report Scope
| Report Features | Description |
|---|---|
| Market Value (2024) | USD 12.2 Billion |
| Forecast Revenue (2034) | USD 28.1 Billion |
| CAGR (2025-2034) | 8.7% |
| Base Year for Estimation | 2024 |
| Historic Period | 2020-2023 |
| Forecast Period | 2025-2034 |
| Report Coverage | Revenue Forecast, Market Dynamics, Competitive Landscape, Recent Developments |
| Segments Covered | By Product (Stick, Leaf), By Category (Regular, Flavored), By Flavor (Original Tobacco, Menthol, Fruity Flavors, Others), By Distribution Channel (Online, Offline) |
| Regional Analysis | North America – US, Canada; Europe – Germany, France, The UK, Spain, Italy, Rest of Europe; Asia Pacific – China, Japan, South Korea, India, Australia, Singapore, Rest of APAC; Latin America – Brazil, Mexico, Rest of Latin America; Middle East & Africa – South Africa, Saudi Arabia, UAE, Rest of MEA |
| Competitive Landscape | Philip Morris International Inc., British American Tobacco p.l.c., Imperial Brands Plc, KT&G Corporation, PAX Labs Inc., Japan Tobacco Inc., Altria Group, PMFTC Inc., Korea Tobacco & Ginseng Corporation, Taiwan Tobacco & Liquor Corporation, JUUL Labs, PAX Labs |
| Customization Scope | Customization for segments, region/country-level will be provided. Moreover, additional customization can be done based on the requirements. |
| Purchase Options | We have three licenses to opt for: Single User License, Multi-User License (Up to 5 Users), Corporate Use License (Unlimited User and Printable PDF) |
 Market")


