


Report Overview
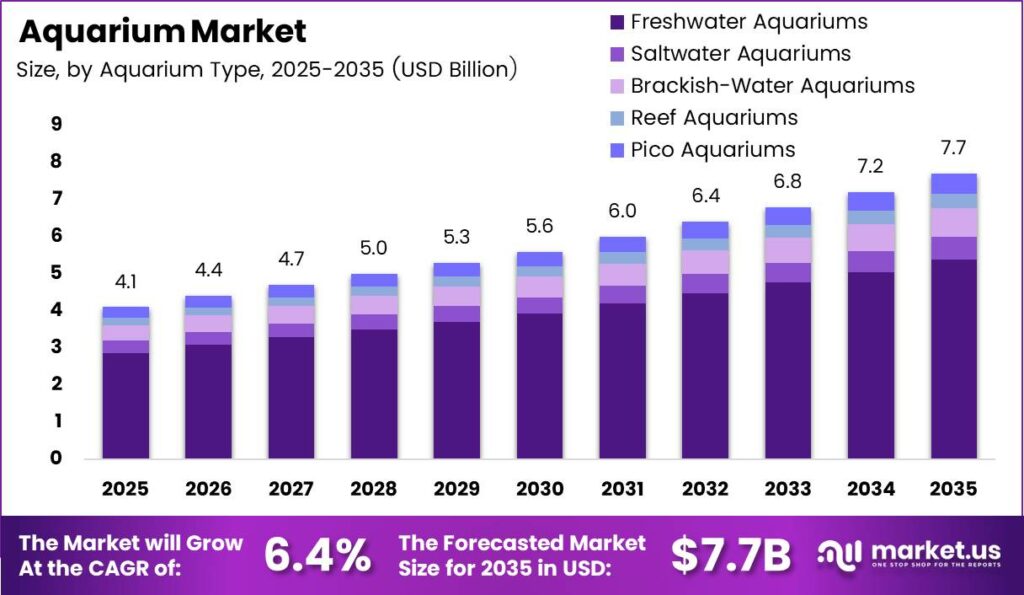
Global Aquarium Market size is expected to be worth around USD 7.7 Billion by 2035 from USD 4.1 Billion in 2025, growing at a CAGR of 6.4% during the forecast period 2026 to 2035. This trajectory reflects sustained consumer investment in home aquatics across both established and emerging markets.
The aquarium market encompasses tanks, filtration systems, temperature-control equipment, and lighting products sold to hobbyists, commercial establishments, educational institutions, and public aquariums. Products span glass and acrylic tank formats across freshwater, saltwater, brackish, reef, and pico configurations. This diversity creates multiple revenue layers for manufacturers and retailers operating across specialty, mass-market, and digital channels.
Key Takeaways
- The global aquarium market is valued at USD 4.1 Billion in 2025 and is forecast to reach USD 7.7 Billion by 2035 at a CAGR of 6.4%.
- Freshwater Aquariums dominate the By Aquarium Type segment with a 70.0% market share.
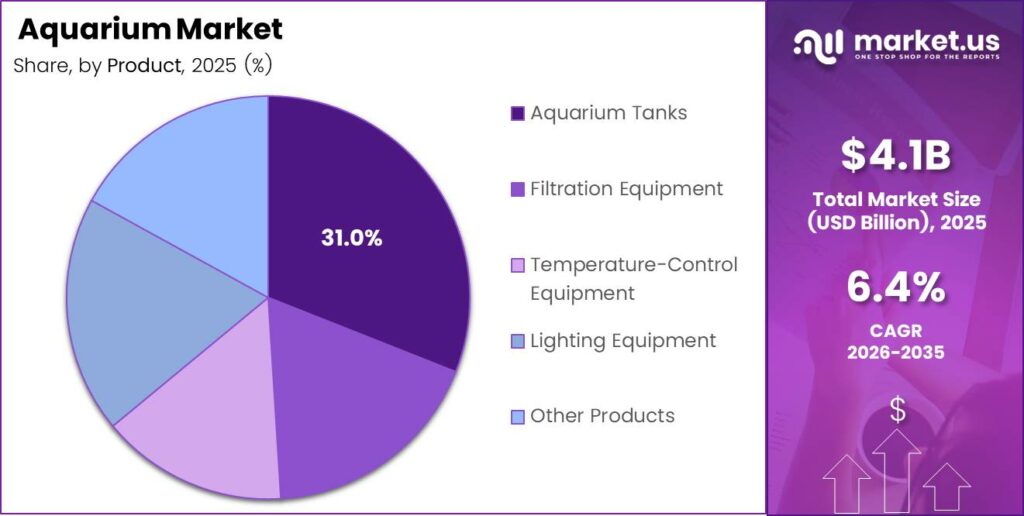
- Aquarium Tanks lead the By Product segment with a 31.0% market share.
- Glass dominates the By Material Type segment with a 60.0% market share.
- Aquarium Hobbyists lead the By End User segment with a 65.0% market share.
- Pet Specialty Stores dominate the By Distribution Channel segment with a 35.0% market share.
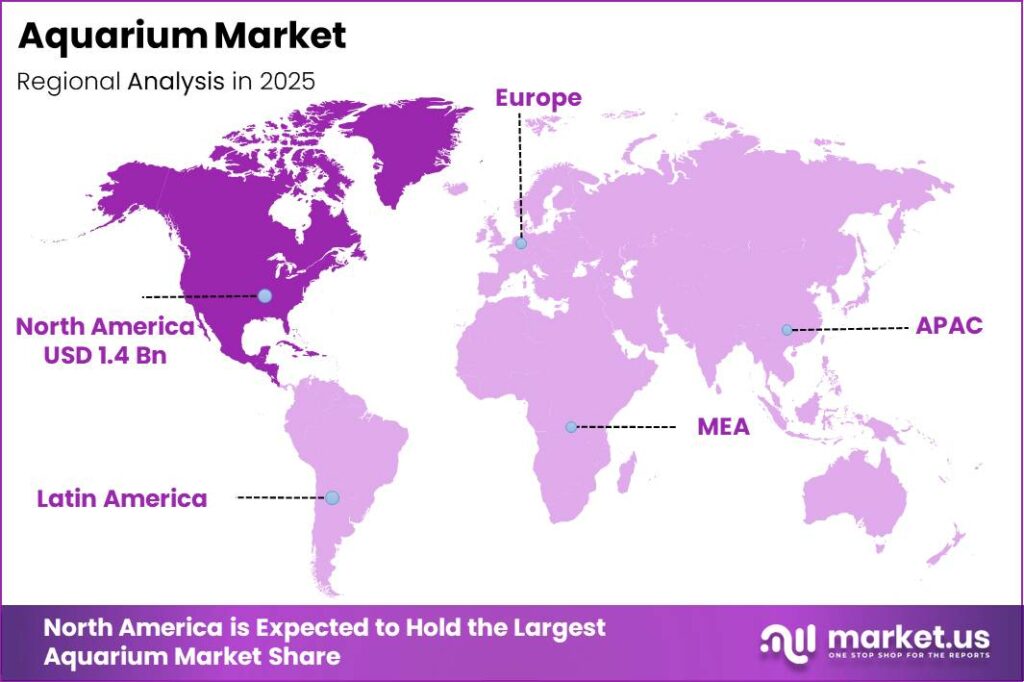
- North America is the dominant region with a 36.0% market share, valued at USD 1.4 Billion.
As per our research, 49% of European households, representing approximately 140 million homes, owned at least one pet in 2024. Europe recorded 27,749,000 aquaria that same year, confirming the region as a structurally deep consumer base. This scale provides consistent demand for filtration media, livestock, and replacement equipment across the forecast period.
As per our research, fish were owned by 8% of U.S. households in 2024, and approximately 4.7 billion people, or 58% of the global population, live in urban areas. Urban household growth expands the addressable base for compact aquarium formats. Vendors targeting apartment-dwelling consumers with space-efficient tank designs and subscription-based consumable delivery hold a structural advantage.
According to Market.us data, global merchandise-trade growth is projected to slow from 4.6% in 2025 to 1.9% in 2026, while the Drewry World Container Index remained 141% above its pre-crisis level in November 2024. Red Sea container traffic fell by three-fourths, pushing Cape of Good Hope navigation up by more than 50%. This logistics pressure raises landed costs for imported livestock and hardware, compressing margins for distributors and retailers dependent on Asian supply chains. In March 2025, EHEIM published a smart-home REST API, signaling a parallel shift toward software-enabled product ecosystems that reduce reliance on physical import cycles.
Aquarium Type Analysis
Freshwater Aquariums dominate with 70.0% due to low setup cost and wide species availability.
In 2025, Freshwater Aquariums held a dominant market position in the By Aquarium Type segment of the Aquarium Market, with a 70.0% share. Lower maintenance costs and a broader range of compatible livestock drive first-time buyer preference toward freshwater systems. This concentration gives filtration and starter-kit manufacturers a stable, high-volume segment with predictable repeat consumable demand.
Saltwater Aquariums attract experienced hobbyists prepared to invest in specialized lighting, protein skimmers, and marine-grade chemistry management. The United States imported $82.252 million and 4,494,640 kilograms of live ornamental fish in 2023, reflecting strong marine livestock demand. This import volume signals a committed buyer base willing to absorb premium equipment costs to maintain species health.
Reef Aquariums represent the highest-value sub-segment, requiring precision water chemistry, dedicated coral lighting spectra, and advanced circulation systems. In May 2026, EHEIM introduced an LED bracket supporting glass up to 12 millimetres thick, with height adjustment up to 230 millimetres and compatibility with as many as 3 powerLED units, directly targeting this precision-lighting demand. Thailand exported $20.131 million and 669,677 kilograms of live ornamental fish in 2023, supplying key reef-compatible species to global markets.
Brackish-Water and Pico Aquariums hold the remaining share collectively. Brackish systems serve a niche buyer segment bridging freshwater and marine care requirements. Pico formats serve urban dwellers with limited space, and the Florida Aquarium opening of a 60-foot-long, 4,000-gallon Tide Pool in August 2025 underscores institutional validation of diverse aquatic display formats.
Product Analysis
Aquarium Tanks dominate with 31.0% due to their role as the essential platform purchase.
In 2025, Aquarium Tanks held a dominant market position in the By Product segment of the Aquarium Market, with a 31.0% share. Tanks function as the foundational purchase that anchors all downstream equipment spending. Manufacturers that invest in modular, upgradeable tank designs capture recurring revenue from hobbyists expanding their systems over time.
Filtration Equipment is the second-largest product category, driven by the biological necessity of maintaining water quality across all aquarium types. Global trade reached approximately $35 trillion in 2025, a 7.5% increase, expanding the logistics network that moves filtration components from manufacturing hubs to end markets. This trade growth supports faster restocking cycles and broader geographic product availability.
Lighting Equipment serves both functional and aesthetic roles, particularly in reef and planted freshwater systems where spectrum precision directly affects organism health. Temperature-Control Equipment and Other Products, including water conditioners, substrates, and décor, hold the remaining product share. OECD countries spent an average of $20,500 per tertiary student, with total educational-institution expenditure averaging 4.9% of GDP, supporting institutional procurement of aquarium-related educational equipment.
Material Type Analysis
Glass dominates with 60.0% due to optical clarity and long-term structural reliability.
In 2025, Glass held a dominant market position in the By Material Type segment of the Aquarium Market, with a 60.0% share. Hobbyists and institutions prefer glass for its scratch resistance and visual clarity, both critical for specimen display and long-term aesthetic value. This preference reinforces glass as the default material for mid-range to premium tank formats across all buyer categories.
Acrylic holds the second material position, offering lighter weight and greater design flexibility for large-format and custom installations. Walmart generated $568.70 billion in U.S. retail sales in 2024, representing 7% annual growth, giving mass-market channels that stock entry-level acrylic and plastic tank formats significant distribution leverage. Plastic and Other Materials hold the remaining share, serving the entry-level and children’s starter segment.
End User Analysis
Aquarium Hobbyists dominate with 65.0% due to consistent repeat purchasing behavior across consumables and livestock.
In 2025, Aquarium Hobbyists held a dominant market position in the By End User segment of the Aquarium Market, with a 65.0% share. This cohort drives predictable recurring revenue through consumables, livestock replacement, and equipment upgrades. Vendors with strong loyalty programs and subscription-based consumable delivery hold a durable advantage over transactional competitors.
Hospitality and Commercial Establishments represent a high-value secondary segment, purchasing large-format display systems for hotels, restaurants, and corporate offices. These buyers prioritize reliability, aesthetics, and managed maintenance services over price. Educational and Research Institutions and Public Aquariums and Zoos hold the remaining share, anchoring institutional demand that supports specialized species, large infrastructure investment, and long procurement cycles.
Distribution Channel Analysis
Pet Specialty Stores dominate with 35.0% due to knowledgeable staff and curated product assortments.
In 2025, Pet Specialty Stores held a dominant market position in the By Distribution Channel segment of the Aquarium Market, with a 35.0% share. Specialist staff guidance is a key purchase driver for first-time and intermediate hobbyists selecting compatible livestock, filtration, and water chemistry products. Retailers that invest in aquatic expertise and in-store display tanks convert browsers into high-basket buyers at measurably higher rates.
Aquarium Specialty Dealers serve the advanced hobbyist and institutional buyer segments, offering curated livestock, premium equipment brands, and technical consultation. Online Retail is the fastest-growing channel, enabling access to niche species and specialist equipment beyond the geographic reach of physical stores. Supermarkets, Hypermarkets, and Other Channels hold the remaining distribution share, primarily serving entry-level starter kit buyers with limited selection.
Key Market Segments
By Aquarium Type
- Freshwater Aquariums
- Saltwater Aquariums
- Brackish-Water Aquariums
- Reef Aquariums
- Pico Aquariums
By Product
- Aquarium Tanks
- Filtration Equipment
- Temperature-Control Equipment
- Lighting Equipment
- Other Products
By Material Type
- Glass
- Acrylic
- Plastic
- Other Materials
By End User
- Aquarium Hobbyists
- Hospitality and Commercial Establishments
- Educational and Research Institutions
- Public Aquariums and Zoos
By Distribution Channel
- Pet Specialty Stores
- Aquarium Specialty Dealers
- Supermarkets and Hypermarkets
- Online Retail
- Other Channels
Regional Analysis
North America Dominates the Aquarium Market with a Market Share of 36.0%, Valued at USD 1.4 Billion
North America leads the global aquarium market with a 36.0% share valued at USD 1.4 Billion in 2025. High household pet ownership, a mature specialty retail infrastructure, and strong consumer spending on premium aquatic products support this position. This scale gives North American distributors and manufacturers first-mover advantage in launching premium and technology-enabled product lines before other regions reach comparable penetration.
Europe is the second-largest region, supported by Germany’s approximately 2,000,000 aquaria in 2024 and the continent’s broad base of engaged hobbyist communities. Europe recorded 793 million international tourist arrivals in 2025, 4% more than in 2024, creating parallel demand for commercial aquarium installations in hospitality venues seeking biophilic design elements. In May 2026, EHEIM relaunched aquacompact in two models for aquariums from 20 to 60 litres, reinforcing European product innovation with compact formats suited to urban households.
Asia Pacific is the fastest-growing region, driven by expanding middle-income households, rising urban pet ownership, and a deep regional supply base for ornamental fish. However, East Asia and Pacific GDP growth was projected to slow from 5.0% in 2024 to 4.5% in 2025, introducing moderate demand-side caution for premium hardware categories. In March 2025, Newport Aquarium opened a $1.5 million, 1,700-square-foot jellyfish exhibit, reflecting broader institutional investment in high-engagement aquatic displays that mirror consumer interest in specialty aquarium formats.
Key Regions and Countries
North America
- US
- Canada
Europe
- Germany
- France
- The UK
- Spain
- Italy
- Rest of Europe
Asia Pacific
- China
- Japan
- South Korea
- India
- Australia
- Rest of APAC
Latin America
- Brazil
- Mexico
- Rest of Latin America
Middle East and Africa
- GCC
- South Africa
- Rest of MEA
Drivers
Expanding livestock collections push aquarium retail beyond one-time starter-kit sales toward higher-value habitat ecosystems. The United States imported approximately 4.29 million kilograms of live ornamental fish in 2024, while 77% of fish keepers maintained at least 2 fish and 34% of saltwater hobbyists used tanks of at least 126 gallons. Larger systems multiply demand for filtration, lighting, substrates, and consumables, increasing revenue per household without proportional customer-acquisition costs.
Manufacturers and retailers can reorganize assortments around expandable platforms and replenishment bundles to capture this multi-product household spend. This driver contributes an estimated +0.8% to the 6.4% baseline CAGR. Specialty e-commerce expansion, biophilic interior adoption, and energy-efficient equipment replacement add further upside across short and medium timeframes.
| Driver | (~) % Impact on CAGR Forecast | Geographic Relevance | Impact Timeline |
|---|---|---|---|
| Multi-Fish Habitat Premiumization | +0.8% | North America, Europe, East Asia | Short term (≤ 2 years) |
| Specialty E-Commerce Expansion | +0.5% | Global urban markets | Short term (≤ 2 years) |
| Biophilic Interior Adoption | +0.4% | North America, Europe, Gulf states | Medium term (2–4 years) |
| Energy-Efficient Equipment Replacement | +0.3% | Europe, North America, Japan | Medium term (2–4 years) |
| Middle-Income Hobbyist Expansion | +0.2% | Asia-Pacific, Latin America | Medium term (2–4 years) |
| Recurring Consumables Demand | +0.1% | Global installed base | Short term (≤ 2 years) |
Restraints
The recurring cost of maintaining temperature, circulation, filtration, and lighting after the initial tank purchase deters prospective buyers from upgrading or purchasing larger systems. A 100-watt heater operating 12 hours daily consumes approximately 36 kilowatt-hours per month before pumps, lights, and auxiliary equipment are included. Prospective buyers increasingly evaluate lifetime expenditure rather than shelf price, pushing them toward smaller or cheaper alternatives.
This behavior produces an estimated -0.7% deduction from the 6.4% baseline CAGR. Vendors face pressure to redesign products for lower wattage and demonstrate measurable operating-cost savings. Live-species import restrictions, marine setup capital intensity, and housing space constraints in dense urban markets compound this restraint across multiple geographies.
| Restraint | (~) % Impact on CAGR Forecast | Geographic Relevance | Impact Timeline |
|---|---|---|---|
| Lifetime Ownership Cost Burden | -0.7% | Europe, North America, developed Asia | Short term (≤ 2 years) |
| Live-Species Import Restrictions | -0.5% | Australia, European Union, North America | Short term (≤ 2 years) |
| Marine Setup Capital Intensity | -0.4% | Global consumer market | Short term (≤ 2 years) |
| Housing Space Constraints | -0.3% | Dense Asian and European cities | Long term (≥ 4 years) |
| Animal-Welfare Sales Scrutiny | -0.2% | Europe, Oceania, North America | Medium term (2–4 years) |
| Discretionary Spending Sensitivity | -0.1% | Global price-sensitive households | Short term (≤ 2 years) |
Challenges
Live ornamental fish move through time-sensitive, multi-stage supply chains spanning tropical breeding centers, airports, wholesalers, and retailers. The United States alone received approximately 4.29 million kilograms of live ornamental fish in 2024, exposing that volume to temperature variation, oxygen depletion, and water chemistry stress at every transfer point. Nominal shipment volume does not translate directly into saleable inventory once transit attrition and quarantine losses are accounted for.
The estimated -0.6% friction drag reflects write-offs, quarantine costs, replacement shipments, and working-capital loss across the supply chain. Long-term investment in regional acclimation hubs, shipment-level sensor logging, and standardized handling protocols is necessary to close this gap. Cross-brand compatibility fragmentation and skilled maintenance labor gaps in North America, Europe, and Gulf states add further operational complexity for retailers and service providers.
| Challenge | (~) % CAGR Friction Drag | Geographic Relevance | Mitigation Horizon |
|---|---|---|---|
| Live-Animal Transit Attrition | -0.6% | Global import-export corridors | Medium term (2–4 years) |
| Pathogen Biosecurity Exposure | -0.5% | Asia-Pacific exporters, Western importers | Long term (≥ 4 years) |
| Cross-Brand Compatibility Fragmentation | -0.4% | Global equipment market | Medium term (2–4 years) |
| Skilled Maintenance Labor Gaps | -0.3% | North America, Europe, Gulf states | Long term (≥ 4 years) |
| Component Input Volatility | -0.2% | Global manufacturing hubs | Short term (≤ 2 years) |
| Complex Inventory Forecasting | -0.1% | Wholesalers and specialist retailers | Medium term (2–4 years) |
Opportunities
Smart monitoring represents a white-space revenue stream that moves aquarium businesses from intermittent hardware sales toward recurring subscription income. A 2026 implementation combined pH, total dissolved solids, temperature, and turbidity sensors with automated feeding and pump control, demonstrating technical feasibility at the product level. Vendors that move first to commercialize this model gain recurring gross-margin income while reducing preventable livestock loss.
In an analyst scenario where annual software, alerting, and consumables-replenishment revenue equals 10 to 15% of a controller’s initial selling price at 70 to 85% gross margin, each installed user generates approximately 7 to 13 additional gross-profit units per 100 units of original hardware revenue. This model could add approximately +0.5% above the 6.4% baseline CAGR. Managed aquarium-as-a-service, captive-bred premium livestock, and aquascaping creator commerce offer additional upside for operators ready to move beyond single-transaction hardware sales.
| Opportunity | (~) % Potential CAGR Upside | Geographic Relevance | Execution Window |
|---|---|---|---|
| Smart Monitoring Subscriptions | +0.5% | North America, Europe, developed Asia | Medium term (2–4 years) |
| Managed Aquarium-as-a-Service | +0.4% | Commercial centres worldwide | Medium term (2–4 years) |
| Captive-Bred Premium Livestock | +0.3% | North America, Europe, Asia-Pacific | Long term (≥ 4 years) |
| Aquascaping Creator Commerce | +0.2% | East Asia, Europe, North America | Short term (≤ 2 years) |
| Circular Trade-In Programs | +0.1% | Europe, Japan, North America | Medium term (2–4 years) |
| Therapeutic Education Installations | +0.1% | Healthcare and education markets | Long term (≥ 4 years) |
Key Company Insights
Spectrum Brands Holdings, Inc. reported consolidated net sales of $779.4 million for fiscal third-quarter 2024, demonstrating significant scale in the pet and home segments. In August 2024, Spectrum Brands and Aperture Pet & Life launched HelloReef All-in-One GloFish aquarium kits in 15-gallon and 40-gallon configurations, targeting beginner saltwater buyers with a bundled entry format.
Central Garden & Pet Company generated $1.801930 billion in Pet segment net sales in fiscal 2025, supported by a U.S. network covering almost 10,000 retailer locations and more than 5,600 veterinary offices. In April 2026, Central Garden & Pet sold its Pet Distribution operations to Phillips Pet Food & Supplies for approximately $31 million in cash and a $5 million note, while retaining a 20% interest valued at $26.1 million, signaling a strategic pivot toward branded product margins over distribution volume.
Key Players
- Spectrum Brands Holdings, Inc.
- Central Garden & Pet Company
- Rolf C. Hagen Inc.
- EHEIM GmbH & Co. KG
- OASE GmbH
- Aqua Design Amano Co., Ltd.
- JUWEL Aquarium AG & Co. KG
- Red Sea
- Seachem Laboratories, Inc.
- Sera GmbH
- Aquael Sp. z o.o.
- Penn-Plax, Inc.
- Tropical Marine Centre Ltd.
- Qian Hu Corporation Limited
- Sunsun Group Co., Ltd.
Recent Developments
- July 2026 – Central Garden & Pet agreed to acquire 80% of TRIXIE for up to €400 million, including approximately €340 million at closing and an earn-out of up to €60 million.
- July 2026 – Red Sea launched ReefControl architecture capable of monitoring up to 7 ReefSense digital probes and sensors.
- June 2026 – Columbus Zoo and Aquarium announced a facility covering more than 100,000 square feet, containing over 1 million gallons, more than 10,000 animals, over 300 species, and 27 exhibits.
- June 2026 – New England Aquarium committed $1 million over 2 years to sustainable fisheries and aquaculture initiatives.
- May 2026 – EHEIM introduced two professionel 4 filter versions, including a 600T thermofilter, for aquariums from 300 to 800 litres with a 3-year guarantee.
- May 2026 – EHEIM expanded powerRGB with a 1,500-millimetre model, taking the portfolio to 9 adjustable lengths spanning 36 to 150 centimetres.
- December 2024 – Clearwater Marine Aquarium announced a $32 million expansion fundraising plan covering 6 years.
Report Scope
| Report Features | Description |
|---|---|
| Market Value (2025) | USD 4.1 Billion |
| Forecast Revenue (2035) | USD 7.7 Billion |
| CAGR (2026-2035) | 6.4% |
| Base Year for Estimation | 2025 |
| Historic Period | 2020-2024 |
| Forecast Period | 2026-2035 |
| Report Coverage | Revenue Forecast, Market Dynamics, Market Opportunity Analysis, Technology and Innovation Landscape, Competitive Landscape, Recent Developments |
| Segments Covered | By Aquarium Type (Freshwater Aquariums, Saltwater Aquariums, Brackish-Water Aquariums, Reef Aquariums, Pico Aquariums), By Product (Aquarium Tanks, Filtration Equipment, Temperature-Control Equipment, Lighting Equipment, Other Products), By Material Type (Glass, Acrylic, Plastic, Other Materials), By End User (Aquarium Hobbyists, Hospitality and Commercial Establishments, Educational and Research Institutions, Public Aquariums and Zoos), By Distribution Channel (Pet Specialty Stores, Aquarium Specialty Dealers, Supermarkets and Hypermarkets, Online Retail, Other Channels) |
| Regional Analysis | North America (US and Canada), Europe (Germany, France, The UK, Spain, Italy, and Rest of Europe), Asia Pacific (China, Japan, South Korea, India, Australia, and Rest of APAC), Latin America (Brazil, Mexico, and Rest of Latin America), Middle East and Africa (GCC, South Africa, and Rest of MEA) |
| Competitive Landscape | Spectrum Brands Holdings, Inc., Central Garden & Pet Company, Rolf C. Hagen Inc., EHEIM GmbH & Co. KG, OASE GmbH, Aqua Design Amano Co., Ltd., JUWEL Aquarium AG & Co. KG, Red Sea, Seachem Laboratories, Inc., Sera GmbH, Aquael Sp. z o.o., Penn-Plax, Inc., Tropical Marine Centre Ltd., Qian Hu Corporation Limited, Sunsun Group Co., Ltd. |
| Customization Scope | Customization for segments, region/country-level will be provided. Additional customization can be done based on requirements. |
| Purchase Options | We have three licenses to opt for: Single User License, Multi-User License (Up to 5 Users), Corporate Use License (Unlimited User and Printable PDF) |





































