


Report Overview
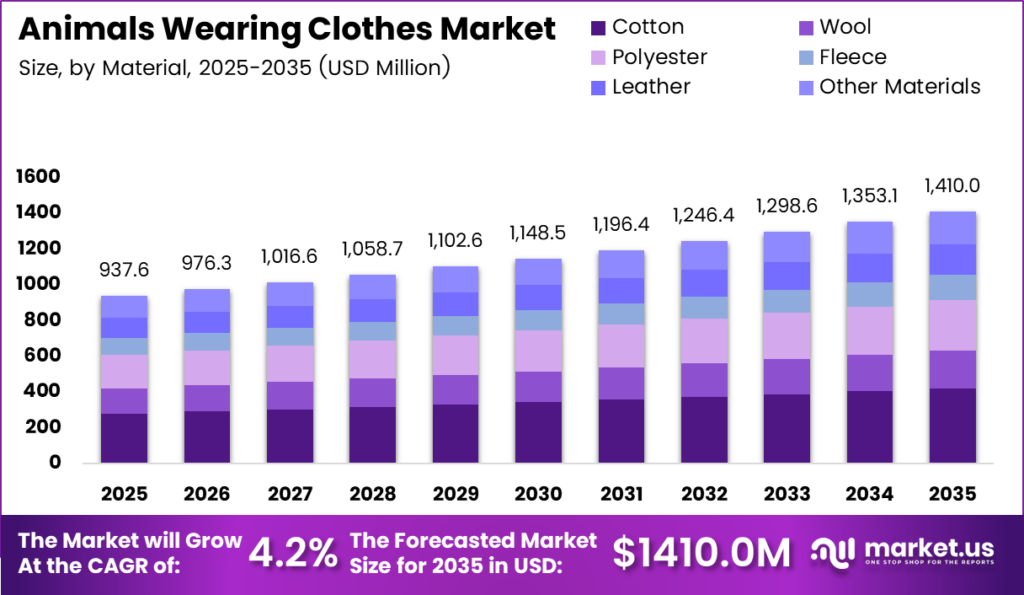
Global Animals Wearing Clothes Market size is expected to be worth around USD 1,410.0 Million by 2035 from USD 937.6 Million in 2025, growing at a CAGR of 4.2% during the forecast period 2026 to 2035.
The animals wearing clothes market covers garments and wearable textile products designed for companion animals, including dogs, cats, horses, and rabbits. Product categories span functional outerwear such as coats and jackets, casual apparel including shirts and sweaters, and occasion-driven costumes. Distribution operates across online retail, pet specialty stores, supermarkets, and department stores.
Key Takeaways
- Market size in 2025 stands at USD 937.6 Million, forecast to reach USD 1,410.0 Million by 2035.
- The market grows at a CAGR of 4.2% from 2026 to 2035.
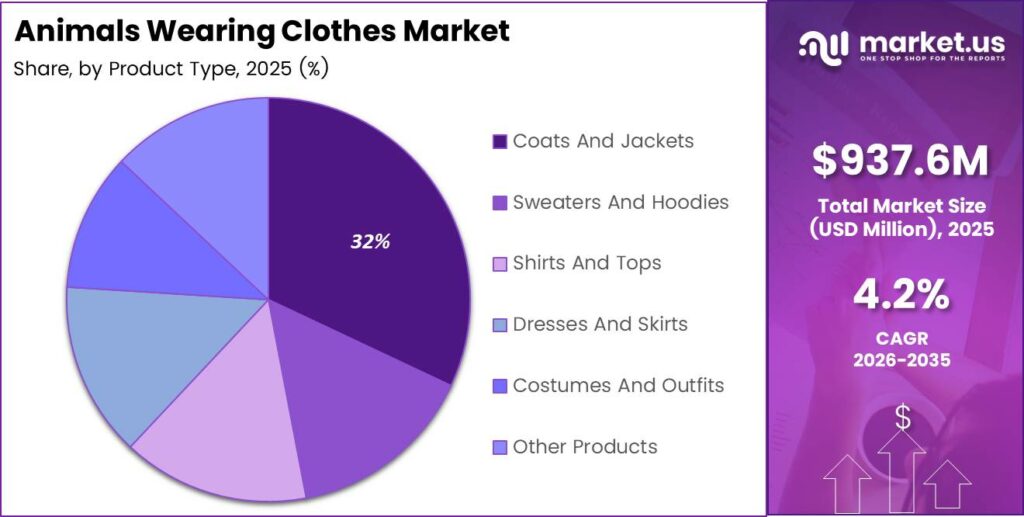
- Coats and Jackets dominate the Product Type segment with a 32.00% share.
- Dogs dominate the Animal Type segment with a 68.00% share.
- Cotton leads the Material segment with a 29.00% share.
- Mid-Range leads the Price Range segment with a 48.00% share.
- Households dominate the End User segment with an 87.00% share.
- Online Retail leads the Distribution Channel segment with a 36.00% share.
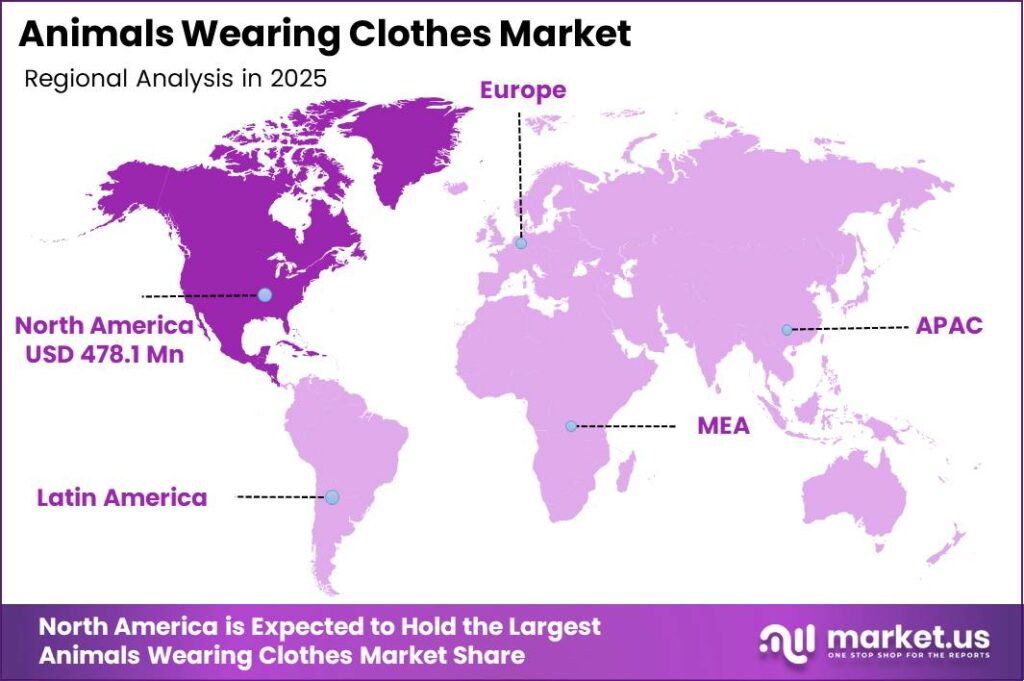
- North America is the dominant region with a 51.00% market share, valued at USD 478.1 Million.
According to the American Pet Products Association, U.S. pet-industry expenditures reached $158 billion in 2025, up 3.7% year over year. This broad spending base signals that animal apparel operates within a well-funded consumer category. Vendors who position pet clothing as a natural extension of pet care spending will find the addressable audience already primed to spend.
As reported by FEDIAF, European pet-food sales reached €29.4 billion with 4% annual growth, underscoring the depth of pet ownership across the continent. Europe’s 140 million pet-owning households represent 49% of all households, making it a structurally large audience for adjacent pet product categories including apparel. Brands with EU-compliant sourcing and multilingual retail presence hold a clear entry advantage.
Data from the World Bank shows global economic growth was projected at 2.6% in 2026, while advanced economies were projected to grow at just 1.7%. This slower pace in the markets that generate most animal-apparel revenue means vendors must compete harder for each discretionary dollar. However, as per our research, textiles and clothing represented 3.7% of world merchandise exports in 2022, confirming the category’s deep integration into global supply chains that animal-apparel brands increasingly rely on.
In March 2025, Ruffwear presented six product groups in its Spring/Summer 2025 new-gear program, signaling that leading brands are treating apparel as a full seasonal calendar rather than a single-occasion category. This structured launch cadence creates more purchase touchpoints annually. Brands that align product drops to seasonal demand cycles will capture repeat buyers and reduce reliance on single peak-season sell-through.
Product Type Analysis
Coats And Jackets dominate with 32.00% due to functional demand across cold weather seasons.
In 2025, Coats and Jackets held a dominant market position in the By Product Type segment of the Animals Wearing Clothes Market, with a 32.00% share. Functional outerwear addresses a genuine utility need for animals in cold and wet climates. This positions the sub-segment as a year-round revenue anchor rather than a purely seasonal line, giving brands a predictable base from which to build higher-margin seasonal extensions.
Sweaters and Hoodies serve as the accessible, everyday layer between formal outerwear and casual tops. Their broad size range and machine-washable construction make them a repeat-purchase category. Buyers who purchase a coat for winter frequently add a sweater or hoodie as a transitional layer, creating natural cross-sell opportunities for brands with deep assortments in both sub-segments.
Shirts and Tops represent the lightest and most fashion-driven portion of the product range. This sub-segment benefits directly from social media visibility, where owners share photos of pets in casual, styled outfits. Brands that release frequent, on-trend colorways and patterns in this category can drive impulse purchasing outside traditional seasonal peaks.
Dresses and Skirts, Costumes and Outfits, and Other Products collectively hold the remaining share. Costumes and Outfits generate concentrated revenue during Halloween and holiday gifting windows. In July 2026, Petco launched a Halloween collection containing more than 300 products, with prices starting at $3 and most products priced below $20, demonstrating that occasion-driven apparel remains a high-volume, accessible category at mass retail.
Animal Type Analysis
Dogs dominate with 68.00% due to large ownership base and owner spending willingness.
In 2025, Dogs held a dominant market position in the By Animal Type segment of the Animals Wearing Clothes Market, with a 68.00% share. According to the American Pet Products Association, dogs were owned by 53% of U.S. households in 2025, with ownership reaching 71 million U.S. households, up 4% year over year. This ownership scale translates directly into the broadest addressable buyer base of any animal segment, making dogs the primary volume and margin driver across all product types.
Cats represent the second-largest animal segment by ownership base and present a structural growth opportunity. As reported by FEDIAF, Europe alone had 110.861 million cats, a population that exceeds the total dog population across many individual national markets. However, lower average garment adoption rates among cat owners relative to dog owners mean the segment’s revenue share significantly trails its population size, signaling room for brands that develop cat-specific fit systems and comfort-focused designs.
Horses represent a specialist sub-segment where garments serve primarily functional roles, including weather protection and post-treatment recovery wraps. Unit prices in this sub-segment are substantially higher than companion-animal clothing due to the material volumes required. This creates a niche but margin-accretive opportunity for brands willing to invest in size engineering and equine-specific distribution channels.
Rabbits and Other Animals collectively hold the remaining share of the animal type segment. These sub-segments are early stage, with limited standardized sizing and low brand investment. In May 2026, Petco launched more than 130 summer products spanning apparel, toys, cooling equipment, and travel gear, reflecting retailer appetite to expand seasonal assortments. As large retailers widen their SKU range, smaller species are likely to gain shelf presence incrementally.
Material Analysis
Cotton dominates with 29.00% due to breathability, comfort, and wide consumer familiarity.
In 2025, Cotton held a dominant market position in the By Material segment of the Animals Wearing Clothes Market, with a 29.00% share. Cotton’s combination of natural breathability and skin-safe properties makes it the preferred base material for everyday casual garments including shirts, tops, and lightweight dresses. Brands that emphasize cotton’s comfort credentials in product copy will align with owner concerns about animal wearability and stress reduction.
Wool serves the colder-climate and premium-positioning segment of the market. Its thermal properties make it suitable for sweaters and outerwear sold into Scandinavian, Central European, and high-altitude North American markets. The material also supports a premium price narrative, giving brands a credible reason to charge above mid-range price points without relying purely on design or branding.
Polyester and Fleece together address the performance and activewear segment of the market. These materials dominate in outdoor jackets, raincoats, and adventure-use garments where durability, water resistance, and quick-drying properties matter more than natural fiber status. Leather and Other Materials collectively hold the remaining share, serving niche fashion and accessory applications.
Price Range Analysis
Mid-Range dominates with 48.00% due to balance of quality and accessibility for most buyers.
In 2025, Mid-Range held a dominant market position in the By Price Range segment of the Animals Wearing Clothes Market, with a 48.00% share. The mid-range tier captures the largest buyer pool because it sits above purely functional economy options while remaining accessible to the majority of pet-owning households. As per our research, global headline inflation was projected to increase from 4.1% in 2025 to 4.7% in 2026, which intensifies downward pricing pressure and makes the mid-range tier a contested battleground between brands defending margin and consumers seeking value.
The Premium segment commands higher unit revenue and attracts buyers who treat pet clothing as a fashion or lifestyle statement. As per our research, Ruffwear’s Powder Hound dog jacket was listed at $109.95, illustrating the price ceiling that performance-focused premium brands can sustain when product features justify the spend. Brands in this tier must continuously invest in material quality and fit technology to prevent trade-down during inflationary periods.
The Economy segment serves price-sensitive buyers and high-volume seasonal purchasers, particularly during Halloween and gifting events. Economy pricing enables mass-retail partners to drive unit volume at low per-item margin while maintaining category footprint. In March 2025, Target announced a strategy intended to generate more than $15 billion in sales growth by 2030, including a Boots & Barkley pet-supplies refresh, signaling that mass retailers see economy and entry-price pet products as a growth vehicle within their broader assortment strategies.
End User Analysis
Households dominate with 87.00% due to personal ownership driving the majority of purchase decisions.
In 2025, Households held a dominant market position in the By End User segment of the Animals Wearing Clothes Market, with an 87.00% share. Individual pet owners drive purchase volume through gifting, seasonal dressing, and social-occasion buying. This concentration means that brand strategies built around emotional connection, social sharing, and seasonal product drops will reach the overwhelming majority of actual buyers without requiring separate commercial channel investment.
Commercial Establishments represent a smaller but structurally distinct buyer group that includes pet hotels, grooming salons, and pet-friendly hospitality venues. These buyers prioritize durability, uniform appearance, and ease of laundering over fashion-cycle relevance. Brands that develop dedicated B2B lines with institutional sizing guides and bulk-order pricing can access this segment without competing on the same messaging used for household consumers.
Animal Shelters and Veterinary Facilities represent the end user sub-segment most closely aligned with functional and medical garment needs. As per our research, BARK generated $324.927 million in direct-to-consumer revenue during fiscal 2026, demonstrating the scale that purpose-led brands can reach through focused channel strategies. Vendors that develop shelter-specific pricing programs or post-operative garment partnerships with veterinary chains can build recurring institutional revenue alongside their consumer business.
Distribution Channel Analysis
Online Retail dominates with 36.00% due to broad assortment access and convenience for pet owners.
In 2025, Online Retail held a dominant market position in the By Distribution Channel segment of the Animals Wearing Clothes Market, with a 36.00% share. Digital channels remove the geographic and shelf-space constraints that limit physical retail assortments. This means brands with wide size ranges and deep colorway libraries can present their full catalog online without the floor-space negotiation that limits mid-tier vendors in brick-and-mortar environments.
Pet Specialty Stores represent the highest-engagement physical channel, where trained staff can recommend garments based on breed, size, and use case. These stores carry a disproportionate share of premium and performance-oriented products. Brands that invest in staff education and in-store sizing tools within pet specialty environments can reduce the return rates that erode online channel margins.
Supermarkets and Hypermarkets, Department Stores, and Other Channels collectively hold the remaining distribution share. Supermarkets and hypermarkets drive volume at economy and entry-level price points, particularly during seasonal events. In December 2025, Petco announced more than 800 new products for 2026, with prices starting at $5 and most products priced at $15 or less, illustrating how large specialty-retail chains use broad, accessible price architecture to compete against general mass-market channels.
Key Market Segments
By Product Type
- Coats And Jackets
- Sweaters And Hoodies
- Shirts And Tops
- Dresses And Skirts
- Costumes And Outfits
- Other Products
By Animal Type
- Dogs
- Cats
- Horses
- Rabbits
- Other Animals
By Material
- Cotton
- Wool
- Polyester
- Fleece
- Leather
- Other Materials
By Price Range
- Economy
- Mid-Range
- Premium
By End User
- Households
- Commercial Establishments
- Animal Shelters And Veterinary Facilities
- Other End Users
By Distribution Channel
- Online Retail
- Pet Specialty Stores
- Supermarkets And Hypermarkets
- Department Stores
- Other Channels
Regional Analysis
North America Dominates the Animals Wearing Clothes Market with a Market Share of 51.00%, Valued at USD 478.1 Million
North America holds a commanding 51.00% share of the global animals wearing clothes market, valued at USD 478.1 Million in 2025. The region’s dominance reflects its high per-pet spending culture, deep e-commerce penetration, and a retail infrastructure built around companion animal ownership. In May 2025, Petco launched a nearly 100-item summer collection with prices starting at $3.99 and most products below $15, demonstrating that accessible price points sustain high purchase frequency even within the region’s dominant market.
Asia Pacific represents the market’s fastest-growing region, supported by expanding urban pet ownership across China, South Korea, Japan, and India. The World Bank projected South Asian economic growth at 6.2% in 2026, a rate nearly 2.5 times faster than advanced economies. This economic momentum expands the middle-class buyer pool for discretionary pet products and positions Asia Pacific as the primary long-term volume opportunity outside North America.
Europe operates as the market’s second-largest established region, anchored by strong pet ownership density across Western markets. As reported by FEDIAF, Europe had 140 million pet-owning households, representing 49% of all European households. This penetration rate means that European growth will come from spending-per-pet increases and category expansion rather than new owner acquisition, favoring brands positioned in the mid-range and premium tiers.
Key Regions and Countries
North America
- US
- Canada
Europe
- Germany
- France
- The UK
- Spain
- Italy
- Rest of Europe
Asia Pacific
- China
- Japan
- South Korea
- India
- Australia
- Rest of APAC
Latin America
- Brazil
- Mexico
- Rest of Latin America
Middle East and Africa
- GCC
- South Africa
- Rest of MEA
Drivers
Pet humanization has converted animal clothing from a novelty purchase into a recurring gifting category organized around holidays, birthdays, and family photo occasions. In 2024, 52% of dog owners and 41% of cat owners planned Christmas gifts for their pets. By 2025, those proportions held at 50% and 41% respectively, with average spend reaching $29.80 per dog gift and $30.70 per cat gift. This consistency across two consecutive years signals that seasonal pet gifting has become a habitual behavior rather than a passing trend, giving brands a predictable revenue window to build themed product drops and higher-margin collections around.
| Driver | (~) % Impact on CAGR Forecast | Geographic Relevance | Impact Timeline |
|---|---|---|---|
| Pet Humanization & Gifting | +1.0% | Global; strongest in North America, Europe, Japan, South Korea | Short term (≤ 2 years) |
| Expanding Pet Ownership | +0.7% | North America, Europe, urban Asia-Pacific | Medium term (2–4 years) |
| E-Commerce Category Access | +0.5% | Global; digitally mature consumer markets | Short term (≤ 2 years) |
| Social-Media Product Visibility | +0.4% | North America, Europe, China, South Korea, Southeast Asia | Short term (≤ 2 years) |
| Pet-Inclusive Travel Growth | +0.3% | North America, Western Europe, Australia, Japan | Medium term (2–4 years) |
| Coordinated Family Fashion | +0.2% | North America, Europe, East Asia | Short term (≤ 2 years) |
Restraints
Animal clothing competes for household budgets after food, veterinary care, and other essential pet expenditures, making it disproportionately exposed during consumer spending pullbacks. During 2025, 22% of U.S. pet owners reported spending less on their pets, a 10% increase from 2024, even as pet ownership across 95 million U.S. households remained substantial. This budget rationalization shifts buyers toward entry-price garments, reduces impulse purchases, and compresses gross margins through heavier promotional activity and greater reliance on peak-season sell-through, with an estimated 0.8% deduction from forecast CAGR.
| Restraint | (~) % Impact on CAGR Forecast | Geographic Relevance | Impact Timeline |
|---|---|---|---|
| Discretionary Spending Trade-Down | -0.8% | Global; strongest in inflation-sensitive households | Short term (≤ 2 years) |
| Pet Comfort Limitations | -0.5% | Global; heightened in warm and humid climates | Long term (≥ 4 years) |
| EU Product Compliance | -0.4% | European Union and non-EU exporters | Short term (≤ 2 years) |
| Import-Cost Volatility | -0.3% | North America, Europe, import-dependent markets | Short term (≤ 2 years) |
| Limited Retail Shelf Access | -0.2% | Global organized retail channels | Medium term (2–4 years) |
| Low Replacement Frequency | -0.2% | Global; value-oriented consumer segments | Long term (≥ 4 years) |
Challenges
Anatomical variation across species and breeds prevents human-apparel sizing conventions from applying reliably to animal garments. The U.S. registry alone covered 205 recognized dog breeds at the start of 2026. This complexity compounds online return rates, which reached an estimated 16.9% of total retail sales in 2024 and an estimated 19.3% for online channels in 2025. A basic assortment spanning 5 sizes, 4 colors, and 6 designs already generates 120 stock-keeping combinations. Vendors that invest in standardized breed-cluster measurement protocols and fit-prediction tools will recover an estimated 0.7% in CAGR friction while building a structural advantage that low-cost imitators cannot easily replicate.
| Challenge | (~) % CAGR Friction Drag | Geographic Relevance | Mitigation Horizon |
|---|---|---|---|
| Sizing & Fit Fragmentation | -0.7% | Global; strongest in online channels | Medium term (2–4 years) |
| SKU Demand Forecasting | -0.5% | Global omnichannel retailers and manufacturers | Medium term (2–4 years) |
| Durability-Washability Trade-Offs | -0.4% | Global mass-market and outdoor segments | Medium term (2–4 years) |
| Multi-Species Pattern Engineering | -0.3% | Global; diverse pet-population markets | Long term (≥ 4 years) |
| Sustainable Material Consistency | -0.2% | Europe, North America, Australia, Japan | Medium term (2–4 years) |
| Design Imitation Pressure | -0.1% | Global online marketplaces | Long term (≥ 4 years) |
Opportunities
Recovery and medical apparel remains commercially underdeveloped because most category merchandising is organized around fashion, weather protection, and seasonal occasions rather than veterinarian-linked wound care or post-operative recovery. U.S. veterinarian-service prices increased 5.7% and broader pet-service prices increased 4.6% over the year to August 2026. Rising veterinary costs intensify demand for at-home recovery products that reduce avoidable follow-up care. Clinically informed garments could sustain a 15% to 25% price premium, add approximately 3 to 6 gross-margin points, and reduce fit-related returns by 2 to 4 percentage points when paired with veterinary sizing protocols, creating potential CAGR upside of 0.8%.
| Opportunity | (~) % Potential CAGR Upside | Geographic Relevance | Execution Window |
|---|---|---|---|
| Recovery & Medical Apparel | +0.8% | North America, Europe, Japan, Australia, urban Asia-Pacific | Medium term (2–4 years) |
| Print-on-Demand Personalization | +0.4% | Global digital-commerce markets | Short term (≤ 2 years) |
| Connected Safety Garments | +0.4% | North America, Europe, East Asia | Long term (≥ 4 years) |
| Cat & Small-Animal Ranges | +0.3% | Europe, North America, Japan, urban Asia-Pacific | Medium term (2–4 years) |
| Circular Rental & Resale | +0.2% | North America, Western Europe, Japan | Long term (≥ 4 years) |
| B2B Animal Uniforms | +0.1% | Global hospitality, events and service-animal channels | Medium term (2–4 years) |
Key Company Insights
Ruffwear anchors its market position in the performance outdoor segment, where technical product credentials justify premium price points. The brand presented six product groups in its Spring/Summer 2025 program, and its Powder Hound jacket carries a listed price of $109.95. This positioning creates durable margin protection against mid-range competitors but concentrates revenue in a buyer segment that reduces spending first during economic slowdowns.
Mungo & Maud operates at the luxury end of the animals wearing clothes market, where product pricing reflects design exclusivity rather than functional performance alone. The Archer Dog Pullover carried a listed price of £126.50, placing it well above mid-range alternatives. In April 2025, Hurtta introduced the Monsoon Coat II ECO with harness openings across sizes 28 to 80, demonstrating that functional innovation and premium positioning are not mutually exclusive strategies in this market. In June 2025, 3i agreed to sell MPM to Partners Group for approximately £400 million in gross proceeds, signaling that institutional investors see sustained value in the premium pet category.
Key Players
- Ruffwear
- Hurtta
- Canada Pooch
- Kurgo
- TRIXIE Heimtierbedarf GmbH & Co. KG
- PetRageous Designs LLC
- Mungo & Maud
- fabdog
- WeatherBeeta
- RC Pets
- Muttluks
- MILK & PEPPER
- Moshiqa
- Bitch New York
- Medical Pet Shirts International B.V.
Recent Developments
- July 27, 2026 – Petco launched a Halloween collection containing more than 300 products, with prices starting at $3 and most products priced below $20.
- February 20, 2026 – RC Pets introduced the Tundra Fleece with listed dog-girth measurements extending to 84 to 104 centimeters.
- December 18, 2025 – Petco announced more than 800 new products for 2026, with prices starting at $5 and most products priced at $15 or less.
- August 7, 2025 – Petco launched more than 400 Halloween and fall products, with prices starting at $2.99 and nearly all products priced below $20.
- December 18, 2024 – General Mills completed its $1.45 billion acquisition of Whitebridge Pet Brands’ North American business.
- October 25, 2024 – Bansk Group completed its approximately $1.5 billion acquisition of PetIQ for $31 per share.
- October 23, 2024 – BARK and Crocs launched Pet Crocs in three sizes covering dogs weighing 15 to 80 pounds.
Report Scope
| Report Features | Description |
|---|---|
| Market Value (2025) | USD 937.6 Million |
| Forecast Revenue (2035) | USD 1,410.0 Million |
| CAGR (2026-2035) | 4.2% |
| Base Year for Estimation | 2025 |
| Historic Period | 2020-2024 |
| Forecast Period | 2026-2035 |
| Report Coverage | Revenue Forecast, Market Dynamics, Market Opportunity Analysis, Technology and Innovation Landscape, Competitive Landscape, Recent Developments |
| Segments Covered | By Product Type (Coats And Jackets, Sweaters And Hoodies, Shirts And Tops, Dresses And Skirts, Costumes And Outfits, Other Products), By Animal Type (Dogs, Cats, Horses, Rabbits, Other Animals), By Material (Cotton, Wool, Polyester, Fleece, Leather, Other Materials), By Price Range (Economy, Mid-Range, Premium), By End User (Households, Commercial Establishments, Animal Shelters And Veterinary Facilities, Other End Users), By Distribution Channel (Online Retail, Pet Specialty Stores, Supermarkets And Hypermarkets, Department Stores, Other Channels) |
| Regional Analysis | North America (US and Canada), Europe (Germany, France, The UK, Spain, Italy, and Rest of Europe), Asia Pacific (China, Japan, South Korea, India, Australia, and Rest of APAC), Latin America (Brazil, Mexico, and Rest of Latin America), Middle East and Africa (GCC, South Africa, and Rest of MEA) |
| Competitive Landscape | Ruffwear, Hurtta, Canada Pooch, Kurgo, TRIXIE Heimtierbedarf GmbH & Co. KG, PetRageous Designs LLC, Mungo & Maud, fabdog, WeatherBeeta, RC Pets, Muttluks, MILK & PEPPER, Moshiqa, Bitch New York, Medical Pet Shirts International B.V. |
| Customization Scope | Customization for segments, region/country-level will be provided. Additional customization can be done based on requirements. |
| Purchase Options | We have three licenses to opt for: Single User License, Multi-User License (Up to 5 Users), Corporate Use License (Unlimited User and Printable PDF) |





































