


Report Overview
Global Adventure Tourism Market size is expected to be worth around USD 4,273.6 Billion by 2035 from USD 708.3 Billion in 2025, growing at a CAGR of 19.7% during the forecast period 2026 to 2035. This scale reflects a structural move of travel spending toward active, immersive experiences. Operators who reposition inventory around higher-yield itineraries will capture the largest slice of this expansion.
Adventure tourism covers guided and self-guided travel built around physical activity, nature immersion, and cultural exploration. This market spans activity type, tour type, traveler type, age group, booking channel, accommodation, adventure intensity, and trip purpose. This structure lets operators segment demand precisely. Therefore, companies can match product design to distinct buyer groups instead of selling one generic package.
- Global Adventure Tourism Market will reach USD 4,273.6 Billion by 2035 from USD 708.3 Billion in 2025, at a CAGR of 19.7%.
- Trekking and Hiking led activity type with a 31.40% share in 2025.
- Domestic Adventure Tourism dominated tour type with a 58.60% share.
- Solo Travelers held the largest traveler type share at 29.80%.
- The 25 to 44 age group commanded 46.20% of the market.
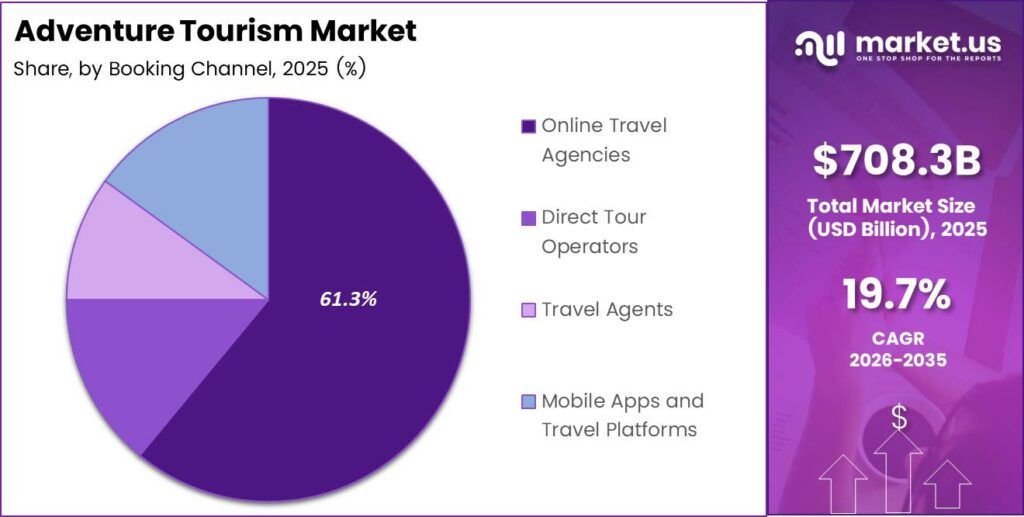
- Online Travel Agencies led booking channels with 61.30%.
- Hotels and Resorts held 42.50% of accommodation demand.
- Moderate Adventure Activities led intensity with 48.70%.
- Leisure and Recreation dominated purpose with 63.20%.
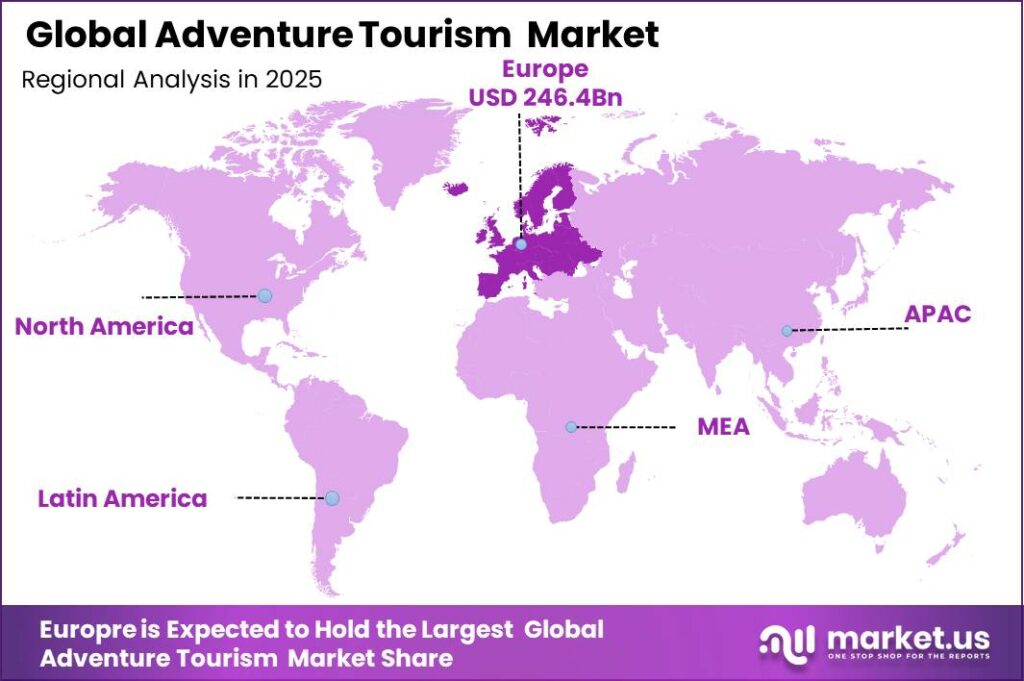
- Europe led all regions with a 34.80% share, valued at USD 246.47 Billion.
Government programs increasingly shape supply in this market. Public agencies fund protected areas, trail networks, and eco-corridors that host commercial adventure activity. This means operators gain access to new terrain without carrying the full cost of infrastructure. As a result, destinations that invest in outdoor recreation attract more certified operators and higher visitor spend across the season. 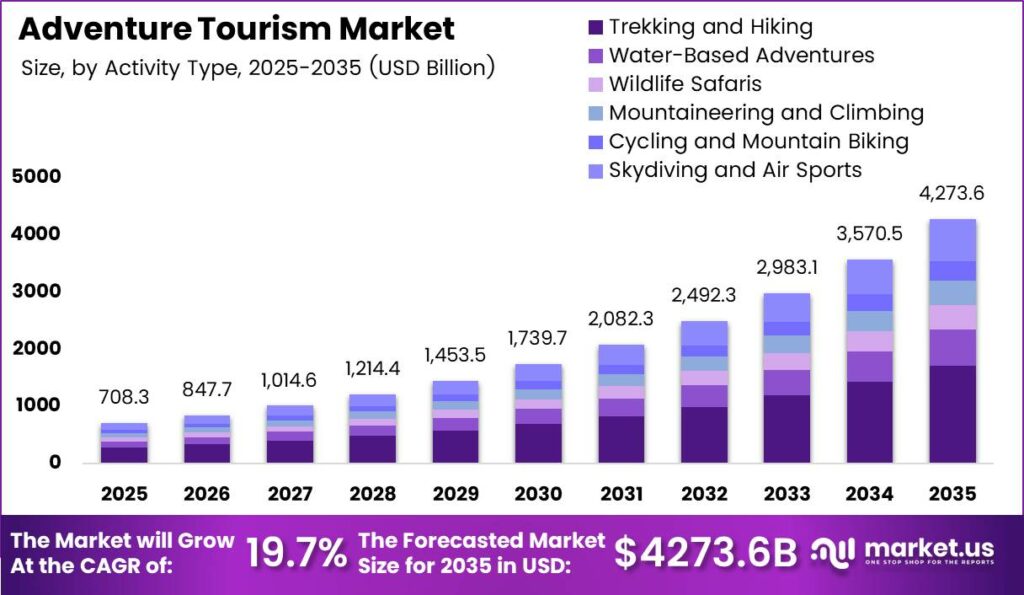
Data from the 2025 ATTA Industry Survey shows adventure travel departures ran at 65% average capacity utilization, unchanged over two years. This stable loading signals mature operational discipline rather than volatile demand. Operators can therefore forecast staffing and gear needs with confidence. Consequently, investors face lower operational surprise risk when backing established adventure brands.
ATTA survey data indicates the median popular guided itinerary sold for USD 3,000 across an 8 night trip in 2025. About 76% of that revenue, near USD 2,280, flowed to local suppliers. This means adventure trips push strong economic value into host communities. Therefore, destinations have clear incentive to welcome and support commercial adventure operators. In July 2025, Intrepid Travel completed its full acquisition of Australian firm Joob to expand domestic offerings.
Activity Type Analysis
Trekking and Hiking dominates with 31.40% due to low equipment barriers globally.
In 2025, Trekking and Hiking held a dominant market position in the By Activity Type segment of Adventure Tourism Market, with a 31.40% share. UNWTO tourism data links hiking demand to protected area visitation, which exceeds 8 billion annual visits worldwide. This scale confirms hiking as the broadest entry activity. Operators should therefore anchor product ranges around trekking to capture first-time adventure buyers.
Water-Based Adventures cover rafting, kayaking, and scuba diving, and rank as the fastest growing activity. FAO and coastal tourism data show diving tourism supports over 9 million certified divers globally through PADI records. This large certified base signals steady repeat demand. Consequently, operators expanding into dive and raft products can tap a committed, high-frequency customer pool.
Wildlife Safaris draw travelers seeking guided nature encounters in protected reserves. IUCN records list more than 16% of global land area under formal protection, supplying vast safari terrain. This land base underpins long-term product viability. Therefore, safari operators can plan multi-year investments with confidence in continued access. Mountaineering and Climbing, Cycling and Mountain Biking, and Skydiving and Air Sports hold the remaining share collectively across niche, higher-skill traveler groups.
Tour Type Analysis
Domestic Adventure Tourism dominates with 58.60% due to lower travel cost barriers.
In 2025, Domestic Adventure Tourism held a dominant market position in the By Tour Type segment of Adventure Tourism Market, with a 58.60% share. World Bank travel data shows domestic tourism spending exceeds international receipts by over 4 times in large economies. This gap confirms home-market strength. Operators should therefore build domestic product depth before scaling cross-border trips.
International Adventure Tourism ranks as the fastest growing tour type as cross-border travel recovers. UNWTO figures record international arrivals near 1.4 billion in recent years. This large flow signals rising appetite for foreign adventure destinations. Consequently, operators with multi-country itineraries can capture premium spend from returning international travelers.
Domestic and international products serve different cost and logistics profiles for operators. National statistical offices report domestic trips carry shorter booking windows and lower cancellation rates. This behavior reduces working capital strain. Therefore, operators balancing both tour types can stabilize cash flow across seasons.
Traveler Type Analysis
Solo Travelers dominate with 29.80% due to flexible small-group booking behavior.
In 2025, Solo Travelers held a dominant market position in the By Traveler Type segment of Adventure Tourism Market, with a 29.80% share. OECD tourism surveys report solo travel rising across member states, with single bookings now above 25% of leisure trips in several markets. This shift favors small-group formats. Operators should therefore design departures that welcome individuals without single supplements.
Group Travelers represent the fastest growing traveler type as social and affinity trips expand. Industry association data shows group departures fill at higher rates than private trips. This filling efficiency lifts per-departure margins. Consequently, operators prioritizing group inventory can raise utilization above the sector average.
Family Adventure Travelers and Corporate Team-Building Groups complete this segment. National statistics offices link family travel to school holiday peaks, concentrating demand into fixed windows. This concentration strains capacity. Therefore, operators serving families and corporate groups must plan staffing around predictable seasonal surges to protect service quality.
Age Group Analysis
25 to 44 Years dominates with 46.20% due to peak disposable income levels.
In 2025, the 25 to 44 age group held a dominant market position in the By Age Group segment of Adventure Tourism Market, with a 46.20% share. World Bank labor data shows this cohort holds the highest workforce participation, above 80% in advanced economies. This earning power funds discretionary adventure trips. Operators should therefore target this group with premium multi-day products.
The 18 to 24 group ranks as the fastest growing age segment as young travelers enter the market. ITU connectivity data shows near-universal smartphone access among this cohort, above 95% in many countries. This digital fluency drives app-based booking. Consequently, operators with strong mobile platforms can capture this rising younger demand.
The 45 to 64 and 65 plus groups hold the remaining share collectively. World Bank demographic data shows populations over 65 expanding fastest across developed nations. This aging trend supports soft-adventure demand. Therefore, operators offering lower-intensity itineraries can serve a growing, financially secure older audience.
Booking Channel Analysis
Online Travel Agencies dominate with 61.30% due to broad inventory aggregation reach.
In 2025, Online Travel Agencies held a dominant market position in the By Booking Channel segment of Adventure Tourism Market, with a 61.30% share. UNCTAD digital economy data shows global online travel sales surpass USD 600 Billion annually. This scale confirms OTA dominance in discovery and payment. Operators should therefore maintain strong OTA listings to protect visibility.
Direct Tour Operators rank as the fastest growing booking channel as brands push direct sales. ATTA survey data shows 73% of operators reported revenue increases year over year, aided by direct margins. This margin capture strengthens brand economics. Consequently, operators investing in direct channels can reduce commission leakage to intermediaries.
Travel Agents and Mobile Apps and Travel Platforms hold the remaining share collectively. ITU data shows mobile travel bookings rising fastest among younger cohorts. This channel shift rewards app investment. In June 2025, TourRadar launched TourRadar Moments, a short-form video platform enabling travelers to discover and book multi-day adventure tours.
Accommodation Type Analysis
Hotels and Resorts dominate with 42.50% due to familiar comfort and reliability.
In 2025, Hotels and Resorts held a dominant market position in the By Accommodation Type segment of Adventure Tourism Market, with a 42.50% share. UNWTO lodging data shows hotels supply the majority of formal tourism room stock worldwide. This capacity base ensures reliable overnight supply. Operators should therefore pair adventure activities with hotel bases to reassure first-time buyers.
Camps and Eco-Lodges rank as the fastest growing accommodation type as travelers seek immersion. IUCN data links eco-lodge growth to protected area buffer zones. This land access supports expansion. Consequently, operators building eco-lodges near reserves can differentiate on authentic, low-impact stays.
Homestays and Guesthouses and Adventure Campsites hold the remaining share collectively. National statistics offices report homestays channel spend directly to local families. This local flow boosts community support for tourism. Therefore, operators using homestays gain both cost efficiency and stronger destination goodwill.
Adventure Intensity Level Analysis
Moderate Adventure Activities dominate with 48.70% due to broad physical accessibility appeal.
In 2025, Moderate Adventure Activities held a dominant market position in the By Adventure Intensity Level segment of Adventure Tourism Market, with a 48.70% share. WHO physical activity data shows only a minority of adults meet high-exertion fitness thresholds, below 30% in many nations. This limits extreme uptake. Operators should therefore center ranges on moderate activities to reach the widest audience.
High-Intensity Extreme Adventures rank as the fastest growing intensity level among skilled travelers. Industry certification bodies report rising participation in technical climbing and diving qualifications. This skill growth expands the eligible customer base. Consequently, operators offering extreme products can command premium pricing from committed enthusiasts.
Soft Adventure and Leisure Activities hold the remaining share. World Bank demographic data shows aging populations lifting demand for gentle, low-risk experiences. This trend widens the soft-adventure market. Therefore, operators adding easy-access itineraries can serve older and first-time travelers who avoid strenuous formats.
Purpose Analysis
Leisure and Recreation dominates with 63.20% due to core vacation motivation strength.
In 2025, Leisure and Recreation held a dominant market position in the By Purpose segment of Adventure Tourism Market, with a 63.20% share. UNWTO data shows leisure accounts for over 50% of all international arrivals. This dominance confirms recreation as the primary travel motive. Operators should therefore lead marketing with enjoyment and escape rather than niche purposes.
Wellness and Nature Retreats rank as the fastest growing purpose as travelers seek restorative trips. World Bank health spending data shows rising wellness expenditure across income brackets. This spending shift funds retreat demand. Consequently, operators blending adventure with wellness can capture a premium, repeat-visit audience.
Educational and Cultural Exploration and Corporate Training and Team Building hold the remaining share collectively. OECD data links corporate offsite spending to team performance goals. This business budget adds stable midweek demand. Therefore, operators serving corporate purposes can smooth occupancy outside leisure peaks.
Key Market Segments
By Activity Type
- Trekking and Hiking
- Water-Based Adventures (Rafting, Kayaking, Scuba Diving)
- Wildlife Safaris
- Mountaineering and Climbing
- Cycling and Mountain Biking
- Skydiving and Air Sports
By Tour Type
- Domestic Adventure Tourism
- International Adventure Tourism
By Traveler Type
- Solo Travelers
- Group Travelers
- Family Adventure Travelers
- Corporate / Team-Building Groups
By Age Group
- 25 to 44 Years
- 18 to 24 Years
- 45 to 64 Years
- 65+ Years
By Booking Channel
- Online Travel Agencies (OTAs)
- Direct Tour Operators
- Travel Agents
- Mobile Apps and Travel Platforms
By Accommodation Type
- Hotels and Resorts
- Camps and Eco-Lodges
- Homestays and Guesthouses
- Adventure Campsites
By Adventure Intensity Level
- Moderate Adventure Activities
- High-Intensity Extreme Adventures
- Soft Adventure / Leisure Activities
By Purpose
- Leisure and Recreation
- Wellness and Nature Retreats
- Educational and Cultural Exploration
- Corporate Training and Team Building
Regional Analysis
Europe Dominates the Adventure Tourism Market with a Market Share of 34.80%, Valued at USD 246.47 Billion
Europe leads the Adventure Tourism Market with a 34.80% share worth USD 246.47 Billion in 2025. Dense trail networks, alpine terrain, and low-cost carrier links to secondary airports support this lead. This connectivity lowers access cost for travelers. Therefore, operators based in Europe can scale departures efficiently across nearby destinations. In February 2025, Intrepid Travel acquired Dutch firm Sawadee Reizen to strengthen its European portfolio.
Asia Pacific ranks as the fastest growing region as domestic tourism drives and secondary destinations expand. Rising middle-class income and airport connectivity to remote hubs fuel this growth. This access opens new adventure corridors. Consequently, operators entering Asia Pacific early can secure permits and terrain before competition intensifies.
Key Regions and Countries
North America
- US
- Canada
Europe
- Germany
- France
- The UK
- Spain
- Italy
- Rest of Europe
Asia Pacific
- China
- Japan
- South Korea
- India
- Australia
- Rest of APAC
Latin America
- Brazil
- Mexico
- Rest of Latin America
Middle East and Africa
- GCC
- South Africa
- Rest of MEA
Market Dynamics
Market Opportunity Analysis - Underexploited segments and emerging regions open clear entry points for new operators
Water-Based Adventures remain underexploited despite fastest-growing status within the activity segment. Most operators still anchor ranges on trekking, leaving diving and rafting supply thin. This gap creates room for specialists. Therefore, new entrants building dedicated water-adventure brands can capture rising demand before generalist operators expand into the space.
Asia Pacific stands out as the region with the widest headroom, given its fastest-growing status against Europe’s 34.80% lead. Many prime corridors still lack organized commercial operators. This absence lowers early competition. Consequently, investors backing Asia Pacific ground operations can secure permits and terrain while barriers stay low.
The 18 to 24 age group holds strong upside as the fastest-growing cohort against the dominant 46.20% held by 25 to 44 travelers. Few operators design products around student budgets and app-first behavior. This mismatch leaves demand unmet. Therefore, brands building affordable, mobile-native adventure formats can lock in loyalty early in the travel lifecycle.
Camps and Eco-Lodges represent underused accommodation supply against the 42.50% hotel lead. Immersive stays match rising wellness and nature demand yet remain scarce near many reserves. This scarcity limits authentic options. Consequently, developers building eco-lodges in buffer zones can differentiate sharply and command premium nightly rates from experience-seeking travelers.
Technology and Innovation Landscape - Safety tech, e-mobility, and digital mapping reshape how operators compete
Operators are embedding satellite communication and emergency tracking devices into guided packages. This technology raises safety assurance in remote terrain where cellular coverage fails. This means buyers gain confidence to book higher-risk trips. Therefore, operators offering connected safety systems can convert cautious first-time travelers who otherwise avoid backcountry adventure products.
Commercial outdoor tours are rapidly adopting electric mountain bikes and e-mobility equipment. This shift widens access for less-fit travelers while cutting on-trail emissions. This means operators reach broader age and ability ranges. Consequently, fleets adding e-mobility gear can serve older and soft-adventure customers without diluting the active experience.
Expedition planners now use remote sensing, GIS mapping, and digital trail intelligence. This technology sharpens route safety, permit compliance, and terrain assessment before departure. This means operators reduce cancellations and rerouting costs. Therefore, companies investing in mapping tools can protect margins while scaling into unfamiliar frontier destinations.
Demand is rising for low-impact, carbon-measured itineraries with transparent sustainability reporting. In 2025, 40% of operators restructured itineraries to cut fossil fuel use. This adoption signals a measurable green shift. Consequently, operators publishing verified carbon data can win corporate ESG contracts and premium-conscious travelers.
Drivers
Household spending data since 2022 shows travel, recreation, and cultural outlays growing 3 to 5 percentage points faster than durable goods. Survey panels show roughly 20 to 25% of international leisure travelers now prioritize active components like trekking, diving, or cycling. This shift redirects wallets into higher-yield products where per-trip revenue runs 30 to 60% above mass tourism. Operators gain from guiding, equipment, and permit layers.
Operators are shifting from single-day, sub-USD 200 excursions toward packaged 5 to 10 day itineraries priced far higher. Guide-to-guest ratios capped near 1:6 constrain capacity for safety reasons. This means even modest volume growth compounds strongly. As a result, this driver adds about +4.1% on top of the baseline CAGR of 19.7% as operators reprice inventory and extend seasons.
| Driver | (~) % Impact on CAGR Forecast | Geographic Relevance | Impact Timeline |
|---|---|---|---|
| Post-pandemic shift from material to experiential spending | +4.1% | North America, Europe, Asia-Pacific | Short term (≤ 2 years) |
| Millennial and Gen Z preference for outdoor, immersive travel | +3.6% | Global | Medium term (2–4 years) |
| Government-backed adventure and eco-corridor development programs | +2.9% | Latin America, Asia-Pacific, Africa | Medium term (2–4 years) |
| Low-cost carriers and secondary-airport connectivity to remote hubs | +2.3% | Europe, Asia-Pacific | Short term (≤ 2 years) |
| Digital booking platforms specializing in multi-day adventure itineraries | +1.8% | Global | Short term (≤ 2 years) |
| Growing corporate incentives for offsite team-building expeditions | +1.2% | North America, Europe | Medium term (2–4 years) |
Restraints
Park and conservation authorities have cut daily trail permits and backcountry overnights by 10 to 40% versus pre-2020 peaks. Some iconic sites now cap commercial operators under 5 departure slots per week regardless of demand. This decouples pricing power from volume growth. Waitlists exceed capacity by 2 to 3x, yet headcount stays fixed even where appetite runs high.
Operators that once stacked departures to spread fixed guide wages, insurance, and gear costs now face hard limits. This forces price hikes of 20 to 50% per traveler or a shift to secondary routes with smaller audiences. This pulls an estimated -3.8% off attainable CAGR. Consequently, operators delay lodge expansions and long-lead marketing tied to restricted destinations.
| Restraint | (~) % Impact on CAGR Forecast | Geographic Relevance | Impact Timeline |
|---|---|---|---|
| Stricter carrying-capacity caps in overtouristed wilderness areas | -3.8% | Europe, North America | Short term (≤ 2 years) |
| Rising travel costs from airfare, insurance, and local permit inflation | -3.2% | Global | Short term (≤ 2 years) |
| Visa and entry-policy tightening in key adventure gateways | -2.1% | Asia-Pacific, Schengen perimeter | Medium term (2–4 years) |
| Climate-driven closures of trails, peaks, and river corridors | -1.7% | Global | Medium term (2–4 years) |
| High accident-risk perception depressing first-time adventure uptake | -1.4% | Emerging adventure markets | Short term (≤ 2 years) |
Challenges
Adventure tourism concentrates into peak-weather windows, often under 90 viable operating days per year for alpine or polar products. Operators must earn most annual revenue in one quarter while fixed costs accrue across all 12 months. This means load factors dropping 10 to 15 points below target in shoulder weeks can erase full-season margins. Seasonality strains the whole business model.
Low asset use compounds the problem, with boats, jeeps, and gear idle for over half the year. Effective utilization stays under 40% in many segments versus 70 to 80% in continuous hospitality. This creates a friction drag of about -2.7% on maximum growth. Therefore, operators must diversify into counter-season geographies or corporate midweek business to smooth occupancy.
| Challenge | (~) % CAGR Friction Drag | Geographic Relevance | Mitigation Horizon |
|---|---|---|---|
| Seasonality and capacity utilization | -2.7% | Global | Medium term (2–4 years) |
| Qualified guide and safety-instructor shortages | -2.3% | North America, Europe, Asia-Pacific | Medium term (2–4 years) |
| Fragmented insurance and liability regimes | -1.9% | Global | Long term (≥ 4 years) |
| Digital discovery versus on-ground capacity mismatch | -1.5% | Global | Short term (≤ 2 years) |
| Currency volatility affecting cross-border trip pricing | -1.1% | Emerging markets | Short term (≤ 2 years) |
Opportunities
The clearest white space lies in moving frequent adventure travelers into longer expedition formats of 7 to 14 days. These itineraries command per-capita prices 2 to 4 times higher than standard 2 to 3 day trips while raising variable costs per guest only 40 to 70%. This gap reflects scale economies in transfers and gear. Operators can lift yield without proportional cost growth.
Because this segment is less price-sensitive, it supports net margins 5 to 10 points above mass-market products. Converting just 10 to 15% of existing customers into expedition tiers over 2 to 4 years lifts revenue per user sharply. This adds an estimated +3.5% to the baseline CAGR of 19.7%. Therefore, early movers gain outsized returns without expanding fixed assets.
| Opportunity | (~) % Potential CAGR Upside | Geographic Relevance | Execution Window |
|---|---|---|---|
| Multi-day, higher-yield expedition products for affluent repeat travelers | +3.5% | Global | Medium term (2–4 years) |
| Adventure add-ons to mainstream beach and city itineraries | +2.8% | Global | Short term (≤ 2 years) |
| Digitally-enabled self-guided and hybrid-guided adventure formats | +2.2% | Europe, North America | Medium term (2–4 years) |
| Low-impact adventure offerings aligned with corporate ESG goals | +1.9% | Global | Long term (≥ 4 years) |
| Emerging-market youth adventure programs linked to domestic tourism drives | +1.6% | Asia-Pacific, Latin America, Africa | Medium term (2–4 years) |
Key Company Insights
Intrepid Travel holds a strong position through aggressive acquisition of regional operators across Europe and Australia. This buy-and-build approach expands its destination management control and domestic adventure depth. This means the company secures on-ground supply that rivals must rent. However, heavy acquisition pace raises integration risk. In July 2025, Intrepid completed its full acquisition of Australian firm Joob to deepen domestic offerings.
G Adventures competes through rapid itinerary innovation in emerging and polar regions. During Q1 2025, the company launched new trips across Uzbekistan, Kyrgyzstan, and Tajikistan, opening Central Asia small-group supply. In June 2025, it relaunched Arctic expeditions after a six-year gap with four new itineraries and a new ship. This expansion builds first-mover advantage in high-yield frontier destinations.
Key Players
- Intrepid Travel
- G Adventures
- Tui Group
- Abercrombie & Kent
- Exodus Travels
- Backroads
- Rei Adventures
- Mountain Travel Sobek
- Klook
- Viator (Tripadvisor Subsidiary)
- Getyourguide
- Thomas Cook (India) Limited
- Cox & Kings
- Kesari Tours
- Makemytrip
Recent Developments
- June 2025: G Adventures relaunched its Arctic expedition program after a six-year hiatus and introduced 4 new Arctic itineraries following the acquisition of a new expedition ship, with Antarctica departures beginning October 2025.
- July 2025: Terra Nova Expeditions launched as a new Antarctic adventure company using the refurbished 98 passenger vessel St Helena, focused on affordable polar expeditions.
- March 2026: Unlimited Travel Group acquired Dutch polar specialist Waterproof Expeditions, strengthening its expedition cruise portfolio and international adventure business.
- February 2026: Lindblad Expeditions refinanced its balance sheet through USD 675 Million of senior secured notes while continuing fleet expansion after record 2025 performance.
Geopolitical Impact Analysis
According to UNCTAD, container shipping and air freight disruptions from Red Sea rerouting have added 10 to 14 days to some transit lanes, lifting equipment import costs for adventure operators. As reported by the IEA, jet fuel price swings above 20% have pushed airfare volatility into remote-hub routes. This raises trip costs for gear-heavy expedition products. Therefore, operators sourcing imported boats and bikes face tighter procurement margins.
Based on WTO data, tariff escalations across major economies have raised import duties on outdoor equipment categories by up to 25% in some corridors. World Bank figures show currency depreciation above 15% in several emerging adventure markets. This weakens local operator buying power for foreign-made gear. Consequently, destinations reliant on imported safety and mobility equipment must hedge pricing to protect cross-border trip affordability.
Report Scope
| Report Features | Description |
|---|---|
| Market Value (2025) | USD 708.3 Billion |
| Forecast Revenue (2035) | USD 4,273.6 Billion |
| CAGR (2026-2035) | 19.7% |
| Base Year for Estimation | 2025 |
| Historic Period | 2020-2024 |
| Forecast Period | 2026-2035 |
| Report Coverage | Revenue Forecast, Market Dynamics, Market Opportunity Analysis, Technology and Innovation Landscape, Competitive Landscape, Recent Developments |
| Segments Covered | By Activity Type (Trekking and Hiking, Water-Based Adventures, Wildlife Safaris, Mountaineering and Climbing, Cycling and Mountain Biking, Skydiving and Air Sports), By Tour Type (Domestic, International), By Traveler Type (Solo, Group, Family, Corporate / Team-Building), By Age Group (25-44, 18-24, 45-64, 65+), By Booking Channel (OTAs, Direct Tour Operators, Travel Agents, Mobile Apps and Travel Platforms), By Accommodation Type (Hotels and Resorts, Camps and Eco-Lodges, Homestays and Guesthouses, Adventure Campsites), By Adventure Intensity Level (Moderate, High-Intensity Extreme, Soft Adventure / Leisure), By Purpose (Leisure and Recreation, Wellness and Nature Retreats, Educational and Cultural Exploration, Corporate Training and Team Building) |
| Regional Analysis | North America (US and Canada), Europe (Germany, France, The UK, Spain, Italy, and Rest of Europe), Asia Pacific (China, Japan, South Korea, India, Australia, and Rest of APAC), Latin America (Brazil, Mexico, and Rest of Latin America), Middle East and Africa (GCC, South Africa, and Rest of MEA) |
| Competitive Landscape | Intrepid Travel, G Adventures, Tui Group, Abercrombie & Kent, Exodus Travels, Backroads, Rei Adventures, Mountain Travel Sobek, Klook, Viator (Tripadvisor Subsidiary), Getyourguide, Thomas Cook (India) Limited, Cox & Kings, Kesari Tours, Makemytrip |
| Customization Scope | Customization for segments, region / country-level will be provided. Additional customization can be done based on requirements. |
| Purchase Options | We have three licenses to opt for: Single User License | Multi-User License (Up to 5 Users) | Corporate Use License (Unlimited User and Printable PDF) |





































