


Report Overview
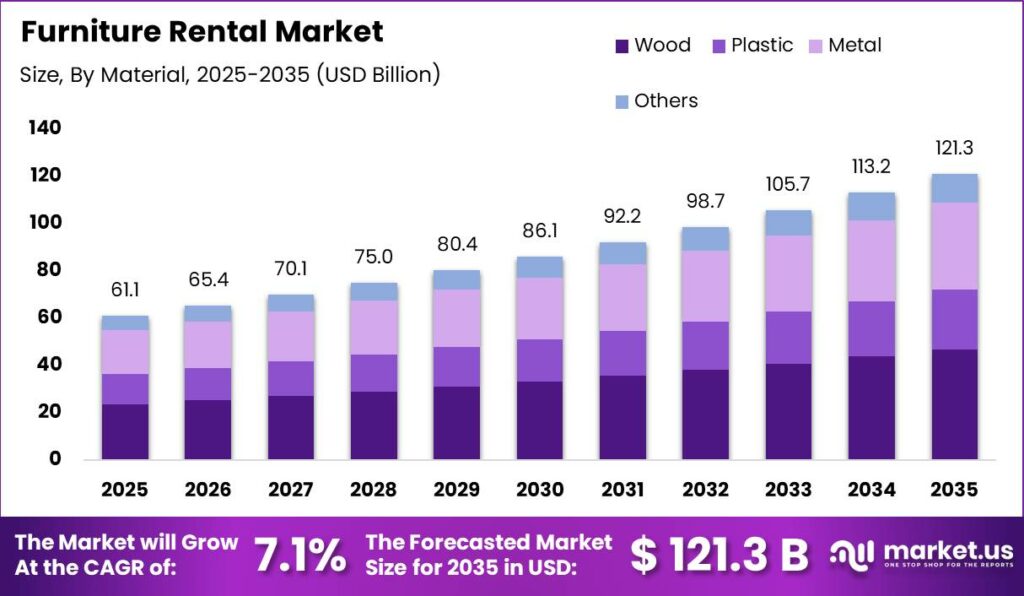
Global Furniture Rental Market size is expected to be worth around USD 121.30 Billion by 2035 from USD 61.10 Billion in 2025, growing at a CAGR of 7.1% during the forecast period 2026 to 2035. This market lets households and businesses access furniture through short and long rental terms. Renters avoid large upfront purchases and gain flexibility as needs change.
The furniture rental market groups products by material, rental period, business model, application, and target customer. Providers own the furniture and recover value across many rental cycles. Therefore operators rely on strong logistics, refurbishment, and asset tracking to protect margins. This structure rewards firms that keep each unit in service across multiple tenants over several years.
Key Takeaways
- Global Furniture Rental Market size will reach USD 121.30 Billion by 2035 from USD 61.10 Billion in 2025.
- The market grows at a CAGR of 7.1% during 2026 to 2035.
- Wood held 38.6% of the By Material segment as the leading material choice.
- Long-Term rental held 37.6% of the By Rental Period segment.
- Brick-and-Mortar Rental Stores held 45.3% of the By Business Model segment.
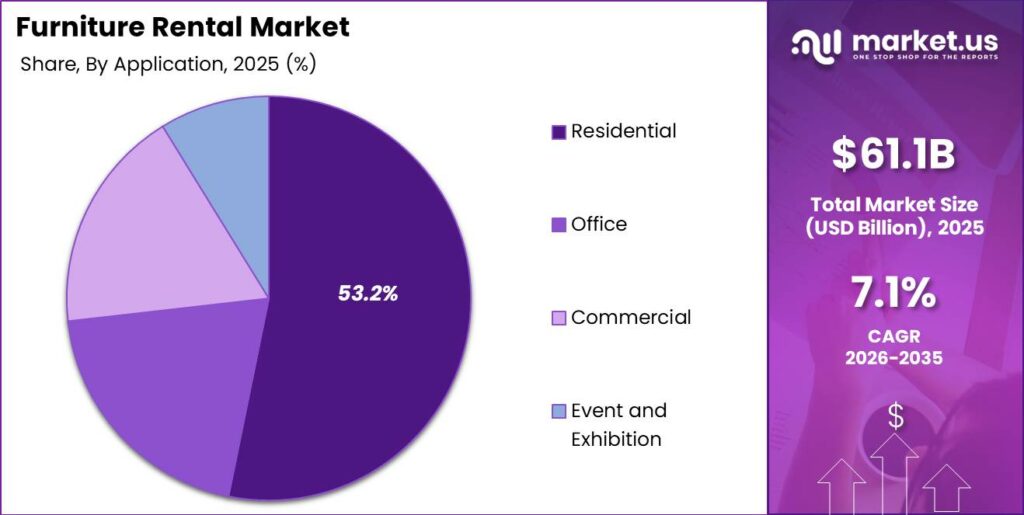
- Residential held 53.2% of the By Application segment.
- Individuals and Families held 41.2% of the By Target Customer segment.
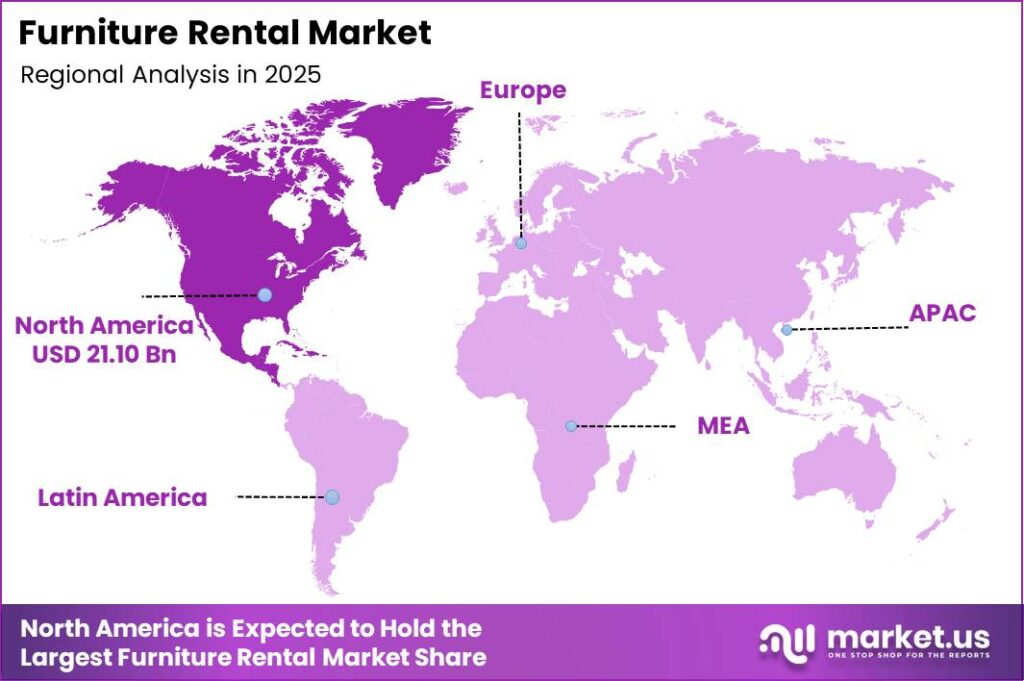
- North America dominated with a 34.6% share, valued at USD 21.10 Billion.
Government waste and recycling policy now shapes rental demand across mature markets. Data from RREUSE shows about 90% of furniture waste in the European Union still ends up landfilled or incinerated. This waste burden pushes regulators toward reuse mandates. As a result, rental operators gain a policy tailwind that positions rental as a compliant, circular alternative to disposable ownership.
Waste volumes in the United States reinforce the same shift toward reuse. The U.S. Environmental Protection Agency reports that 12.1 million tons of furniture and furnishings waste were generated nationally. This scale signals a large pool of demand for lifecycle-extending models. Therefore operators that route units through multiple tenants can capture value that landfill disposal currently wastes.
Workplace behavior directly lifts corporate furniture rental demand. According to CBRE, 75% of companies reported using unassigned seating models for at least some employees in 2025. This shift raises the need for shared desks and flexible setups. Consequently, firms increasingly rent office furniture rather than buy fixed inventory that hybrid schedules leave idle.
Material Analysis
Wood dominates with 38.6% due to durability and premium buyer preference.
In 2025, Wood held a dominant market position in the By Material segment of Furniture Rental Market, with a 38.6% share. Global furniture production reached an estimated USD 471 Billion in 2024, with wood remaining the primary structural material. This scale gives rental operators a deep supply base. Therefore firms stocking wood units secure durable inventory that survives repeated rental cycles and protects residual value.
Plastic furniture serves cost-sensitive and high-turnover rental needs across events and short stays. Global furniture imports reached USD 93.05 Billion in 2024, with lightweight plastic pieces moving efficiently through trade channels. This portability lowers shipping and handling cost per unit. Consequently, operators use plastic to serve price-led renters while keeping logistics spend low.
Metal furniture supports commercial and office settings that demand strength and long service life. Global furniture trade totaled roughly USD 200 Billion in 2023 across all materials, with metal framing common in workplace lines. This durability reduces refurbishment frequency. As a result, operators renting metal units to businesses cut per-cycle maintenance cost and extend asset payback.
Other materials, including composites and upholstered blends, round out the remaining share. These pieces target niche staging and specialty rental demand. Wood, plastic, and metal together hold the leading positions, while other materials collectively fill the remaining balance of the segment.
Rental Period Analysis
Long-Term dominates with 37.6% due to stable recurring rental revenue streams.
In 2025, Long-Term held a dominant market position in the By Rental Period segment of Furniture Rental Market, with a 37.6% share. Enterprise furniture contracts now run 24 to 36 months for accounts signed in 2025. This length locks in predictable income. Therefore operators favor long-term deals that raise customer lifetime value and smooth cash flow across the asset lifecycle.
Short-Term rental serves events, relocations, and temporary housing that need quick setup. CORT states it can deliver and set up rented furniture within as little as 48 hours for eligible requests. This speed suits urgent, brief needs. Consequently, operators charge premium rates on short cycles, offsetting the higher handling cost each rapid turnover creates.
Medium-Term rental bridges seasonal contracts, internships, and multi-month corporate assignments. A typical rental unit must complete 3 to 5 rental cycles to reach breakeven under standard operator economics. This structure rewards steady mid-length bookings. As a result, medium-term demand helps operators keep units productive between short spikes and long commitments.
Business Model Analysis
Brick-and-Mortar Rental Stores dominate with 45.3% due to established local delivery networks.
In 2025, Brick-and-Mortar Rental Stores held a dominant market position in the By Business Model segment of Furniture Rental Market, with a 45.3% share. Physical operators complete 3 to 5 asset cycles per unit through local warehouses. This footprint speeds delivery and returns. Therefore store-based firms defend share by controlling last-mile logistics that online-only rivals struggle to match.
Online Rental Platforms attract digital-first renters seeking fast browsing and booking. Global furniture e-commerce moved a large share of the USD 93.05 Billion in 2024 furniture imports through digital channels. This reach lowers customer acquisition friction. Consequently, platforms scale quickly across cities without the fixed cost of many physical showrooms.
Subscription-Based Services convert furniture into a recurring monthly fee model. Workstation costs of 400 to 600 dollars shift into monthly fees of 15 to 25 dollars per seat under these plans. This pricing eases buyer cash flow. As a result, subscription models win flexible customers who value predictable spending over asset ownership.
Application Analysis
Residential dominates with 53.2% due to renter mobility and relocation needs.
In 2025, Residential held a dominant market position in the By Application segment of Furniture Rental Market, with a 53.2% share. Americans generate 12.1 million tons of furniture waste yearly, much of it from home turnover. This waste points to heavy residential churn. Therefore rental operators serving households capture repeat demand from renters who move often and avoid disposal costs.
Office application demand rises as workplaces adopt flexible layouts. CBRE reported the U.S. overall office vacancy rate at 18.6% in early 2026, pushing tenants toward adaptable setups. This flexibility favors rented desks. Consequently, operators supplying office furniture gain from firms resizing space without buying permanent inventory.
Commercial and Event and Exhibition applications serve retail, hospitality, and temporary venues. Global furniture production of USD 471 Billion in 2024 supplied both permanent and staged commercial fit-outs. This scale supports specialty rental supply. Office leads the non-residential group, while Commercial and Event and Exhibition together hold the remaining share.
Target Customer Analysis
Individuals and Families dominate with 41.2% due to frequent household relocation cycles.
In 2025, Individuals and Families held a dominant market position in the By Target Customer segment of Furniture Rental Market, with a 41.2% share. Global furniture imports of USD 93.05 Billion in 2024 reflect strong household consumption. This demand base supports family rental volume. Therefore operators targeting households secure a broad, recurring customer pool tied to moving and life-stage changes.
Businesses and Organizations rent to manage flexible office footprints. Enterprise rental contracts now stretch to 36 months, lifting supplier lifetime value by an estimated 20%. This length stabilizes revenue. Consequently, operators prioritize corporate accounts that renew reliably and reduce fleet idle time.
Event Planners and Students fill high-turnover, seasonal rental demand. Container shipping rates near 2,213 dollars per 40ft box in late 2025 kept restocking costs manageable for these fast cycles. This affordability supports quick redeployment. Event Planners lead this group, while Students hold the remaining share through term-based housing rentals.
Key Market Segments
By Material
- Wood
- Plastic
- Metal
- Others
By Rental Period
- Short-Term
- Medium-Term
- Long-Term
By Business Model
- Online Rental Platforms
- Brick-and-Mortar Rental Stores
- Subscription-Based Services
By Application
- Residential
- Office
- Commercial
- Event and Exhibition
By Target Customer
- Individuals and Families
- Businesses and Organizations
- Event Planners
- Students
Regional Analysis
North America Dominates the Furniture Rental Market with a Market Share of 34.6%, Valued at USD 21.10 Billion
North America led the furniture rental market with a 34.6% share worth USD 21.10 Billion. High renter mobility and hybrid work drive steady demand across the region. In January 2025, CORT Furniture Rental expanded its workplace solutions portfolio with flexible office rental packages for hybrid work. Therefore regional operators capture rising corporate demand tied to changing office footprints.
Asia Pacific stands as the fastest-growing region through rapid urban household formation. Tier-2 and tier-3 cities across the region add new renters seeking affordable furnishing. This expansion widens the addressable base. Consequently, operators entering these cities early can build share before organized rental competition matures.
Europe and other regions support steady demand through strong reuse and sustainability policy. About 90% of European Union furniture waste still ends in landfill or incineration, pushing circular alternatives. This pressure favors rental adoption. As a result, European operators aligned with reuse policy hold a durable positioning advantage across the remaining regional share.
Key Regions and Countries
North America
- US
- Canada
Europe
- Germany
- France
- The UK
- Spain
- Italy
- Rest of Europe
Asia Pacific
- China
- Japan
- South Korea
- India
- Australia
- Rest of APAC
Latin America
- Brazil
- Mexico
- Rest of Latin America
Middle East and Africa
- GCC
- South Africa
- Rest of MEA
Market Dynamics
Market Opportunity Analysis - Underserved rental periods, emerging cities, and non-residential segments open room for new entrants
Medium-Term rental sits between the dominant Long-Term 37.6% share and fast Short-Term demand, leaving a middle band that few operators serve well. Renters on multi-month assignments lack tailored plans. This gap invites focused products. Therefore new entrants that build medium-term packages can win bookings that current operators leave underserved.
Asia Pacific stands as the fastest-growing region, yet organized rental remains thin outside major metros. Tier-2 and tier-3 cities hold rising renter populations with limited supply. This imbalance creates open territory. Consequently, early movers who enter these cities can secure share before national brands scale their presence.
Office application trails the leading Residential 53.2% share despite strong hybrid-work demand. Many firms still buy furniture they underuse. This mismatch signals untapped conversion potential. As a result, operators building dedicated office rental lines can pull budget away from ownership toward flexible, rented workplace setups.
Subscription-Based Services remain smaller than the leading Brick-and-Mortar 45.3% model, yet suit younger, mobile renters. Predictable monthly pricing appeals to this group. This preference points to headroom for subscription growth. Instead of chasing store share directly, new entrants can win digital-first customers through flexible subscription offers.
Technology and Innovation Landscape - Digital platforms, asset tracking, and subscription systems reshape rental operations
Digital furniture rental platforms enable faster booking, asset management, and scalable operations across markets. These systems cut manual handling and speed customer onboarding. This efficiency lowers cost per transaction. Therefore operators that adopt digital platforms scale into new cities without adding heavy showroom overhead.
IoT-enabled asset tracking and RFID tools address inventory shrinkage running 4% to 6% of fleet value yearly. Implementation costs of 150,000 to 300,000 dollars for a mid-sized fleet fund granular unit visibility. This tracking protects margin. Consequently, operators recover value once lost to unaccounted write-offs and depreciation gaps.
Subscription-based Furniture-as-a-Service systems convert ownership into recurring digital billing at 15 to 25 dollars per seat monthly. This structure ties software-style revenue to physical assets. As a result, providers gain predictable income and deeper customer data that supports pricing and inventory planning across the fleet.
Drivers
Corporate real estate teams shifted office furnishing budgets from capital to operating expenditure between 2024 and 2026, driven by hybrid-work churn in leased offices. This Furniture-as-a-Service model converts an upfront outlay of 400 to 600 dollars per workstation into a monthly fee of 15 to 25 dollars per seat. Therefore firms cut balance-sheet asset intensity while suppliers gain steady recurring revenue.
This model lifted average enterprise contract durations from roughly 12 months to 24 to 36 months for accounts signed in 2025. Longer terms raised supplier customer lifetime value by an estimated 20% to 30%. This shift directly supports the incremental 2.0% contribution to the 7.1% baseline CAGR. As a result, investors favor operators winning multiyear corporate accounts.
| Driver | (~) % Impact on CAGR Forecast | Geographic Relevance | Impact Timeline |
|---|---|---|---|
| Corporate Furniture-as-a-Service adoption | +2.0% | North America, Europe | Short term (≤ 2 years) |
| Urban rental-household mobility | +1.5% | North America, Asia Pacific | Short term (≤ 2 years) |
| Student and short-term housing turnover | +0.9% | North America, Europe, Asia Pacific | Short term (≤ 2 years) |
| Digital subscription-platform expansion | +0.8% | Asia Pacific, North America | Short term (≤ 2 years) |
| Corporate relocation and expatriate demand | +0.6% | North America, Europe | Medium term (2–4 years) |
Restraints
Every returned furniture unit needs pickup, inspection, cleaning, repair, and re-warehousing before redeployment. Rising freight and last-mile rates through 2025 pushed reverse-logistics cost per unit to 35 to 55 dollars, up an estimated 18% to 22% from 2023 levels. This inflation squeezes fleet economics. Therefore operators face slimmer returns on each rental cycle.
Because a typical unit must complete 3 to 5 cycles to break even, cost inflation stretched average payback from 14 months to 17 to 19 months. This delay compressed operator EBITDA margins by an estimated 3% to 5%. As a result, several regional operators froze warehouse expansion, accounting for the -1.4% deduction from the 7.1% baseline CAGR.
| Restraint | (~) % Impact on CAGR Forecast | Geographic Relevance | Impact Timeline |
|---|---|---|---|
| High reverse-logistics and refurbishment costs | -1.4% | Global | Short term (≤ 2 years) |
| Elevated warehousing interest and financing costs | -1.0% | North America, Europe | Short term (≤ 2 years) |
| Consumer preference for low-cost fast furniture ownership | -0.7% | Asia Pacific, North America | Short term (≤ 2 years) |
| Damage and deposit-liability disputes | -0.5% | Global | Short term (≤ 2 years) |
Challenges
Rental furniture assets depreciate on a 3 to 5 year useful-life schedule, yet wear rates vary sharply by category. Without granular RFID or barcode tracking, operators report shrinkage and write-offs of 4% to 6% of active fleet value each year. This gap erodes gross margin by an estimated 2% to 3% yearly. Therefore weak tracking quietly drains profitability.
Fixing this needs multiyear investment in digital asset-management platforms and IoT tracking. Implementation costs run 150,000 to 300,000 dollars for a mid-sized regional fleet. This spend caps the market’s growth ceiling by an estimated 0.8% against the 7.1% baseline until resolved. As a result, operators that digitize early convert a challenge into a durable cost advantage.
| Challenge | (~) % CAGR Friction Drag | Geographic Relevance | Mitigation Horizon |
|---|---|---|---|
| Inventory depreciation and asset tracking | -0.8% | Global | Medium term (2–4 years) |
| Fragmented regional operator competition | -0.6% | Asia Pacific, North America | Medium term (2–4 years) |
| Warehouse labor availability constraints | -0.5% | North America, Europe | Medium term (2–4 years) |
| Style and inventory obsolescence risk | -0.4% | Global | Long term (≥ 4 years) |
Opportunities
Systematic resale and refurbishment of retired rental furniture remains largely uncaptured white space. Fewer than 15% of decommissioned units currently move through formal refurbishment-and-resale channels. Building dedicated refurbishment lines could lift residual recovery value per unit from 8% to 12% of original cost toward 25% to 35%. Therefore operators unlock revenue that liquidation currently discards.
This approach expands blended fleet-lifecycle margins by an estimated 4% to 6% and extends revenue-generating asset life by 12 to 18 months per item. It requires deliberate multiyear investment in refurbishment infrastructure and resale partnerships. As a result, this untapped segment represents an incremental 1.3% CAGR upside above the 7.1% baseline for early movers.
| Opportunity | (~) % Potential CAGR Upside | Geographic Relevance | Execution Window |
|---|---|---|---|
| Circular-economy resale and refurbishment revenue | +1.3% | Global | Long term (≥ 4 years) |
| Tier-2 and tier-3 city market penetration | +1.0% | Asia Pacific, Latin America | Medium term (2–4 years) |
| Bundled appliance and smart-home rental cross-sell | +0.8% | Asia Pacific, North America | Medium term (2–4 years) |
| B2B hospitality and staging partnerships | +0.5% | North America, Europe | Long term (≥ 4 years) |
Key Company Insights
Brook Furniture Rental targets frequent relocators and corporate housing clients, a group a 2025 academic review flagged as high-value because relocation cycles create repeated furnishing needs. This focus builds recurring demand from mobile professionals and expatriates. Therefore the firm gains stable renewal volume, though its reliance on relocation traffic exposes revenue to slowdowns in corporate mobility and housing turnover.
AFR Furniture Rental competes on delivery speed and event staging, where CORT-style benchmarks show setup within 48 hours drives customer choice. This service edge wins urgent short-term bookings across events and offices. Rent-A-Center meanwhile reported a $83.2 Million revenue drop and a 2.2% same-store decline in 2025, signaling consumer-rental pressure that speed-focused operators can exploit for share gains.
Key Players
- Brook Furniture Rental
- AFR Furniture Rental
- Furlenco
- Feather
- Rentomojo
- CORT Furniture
- Rent-A-Center
- Luxe Modern Rentals
- The Everest
- Fernished Inc.
- Athoor
- Fashion Furniture Rental
- The Aaron’s Company, Inc.
Recent Developments
- May 2025: Vesta expanded beyond furniture rental by acquiring Krista + Home, a South Florida interior design company, strengthening its strategy of combining furniture, staging, interior design, and home furnishing services into a single platform.
- August 2024: Blueground partnered with CORT to expand furniture rental and relocation services for residents across the United States, forming one of the most significant recent strategic collaborations in the furniture rental ecosystem.
Geopolitical Impact Analysis
According to the U.S. government, a 25% tariff now applies to imported upholstered wooden furniture, with a targeted 30% duty on Vietnamese upholstery effective October 2025. Vietnam ranks as the second-largest furniture exporter to the United States. These duties raise landed costs on rental inventory sourced abroad. Therefore operators face higher acquisition prices that push fleet planning toward domestic refurbishment and reuse.
As reported by Drewry, the World Container Index sat near 2,213 dollars per 40ft container in late 2025, after a 56% year-over-year decline through September. Lower freight eases restocking cost for imported furniture. This relief partly offsets tariff pressure on rental fleets. Consequently, operators that time bulk purchases to soft freight windows protect margins against rising trade barriers.
Report Scope
| Report Features | Description |
|---|---|
| Market Value (2025) | USD 61.10 Billion |
| Forecast Revenue (2035) | USD 121.30 Billion |
| CAGR (2026-2035) | 7.1% |
| Base Year for Estimation | 2025 |
| Historic Period | 2020-2024 |
| Forecast Period | 2026-2035 |
| Report Coverage | Revenue Forecast, Market Dynamics, Market Opportunity Analysis, Technology and Innovation Landscape, Competitive Landscape, Recent Developments |
| Segments Covered | By Material (Wood, Plastic, Metal, Others), By Rental Period (Short-Term, Medium-Term, Long-Term), By Business Model (Online Rental Platforms, Brick-and-Mortar Rental Stores, Subscription-Based Services), By Application (Residential, Office, Commercial, Event and Exhibition), By Target Customer (Individuals and Families, Businesses and Organizations, Event Planners, Students) |
| Regional Analysis | North America (US and Canada), Europe (Germany, France, The UK, Spain, Italy, and Rest of Europe), Asia Pacific (China, Japan, South Korea, India, Australia, and Rest of APAC), Latin America (Brazil, Mexico, and Rest of Latin America), Middle East and Africa (GCC, South Africa, and Rest of MEA) |
| Competitive Landscape | Brook Furniture Rental, AFR Furniture Rental, Furlenco, Feather, Rentomojo, CORT Furniture, Rent-A-Center, Luxe Modern Rentals, The Everest, Fernished Inc., Athoor, Fashion Furniture Rental, The Aaron’s Company, Inc. |
| Customization Scope | Customization for segments, region / country-level will be provided. Additional customization can be done based on requirements. |
| Purchase Options | We have three licenses to opt for: Single User License | Multi-User License (Up to 5 Users) | Corporate Use License (Unlimited User and Printable PDF) |





































