
Quick Navigation
Report Overview
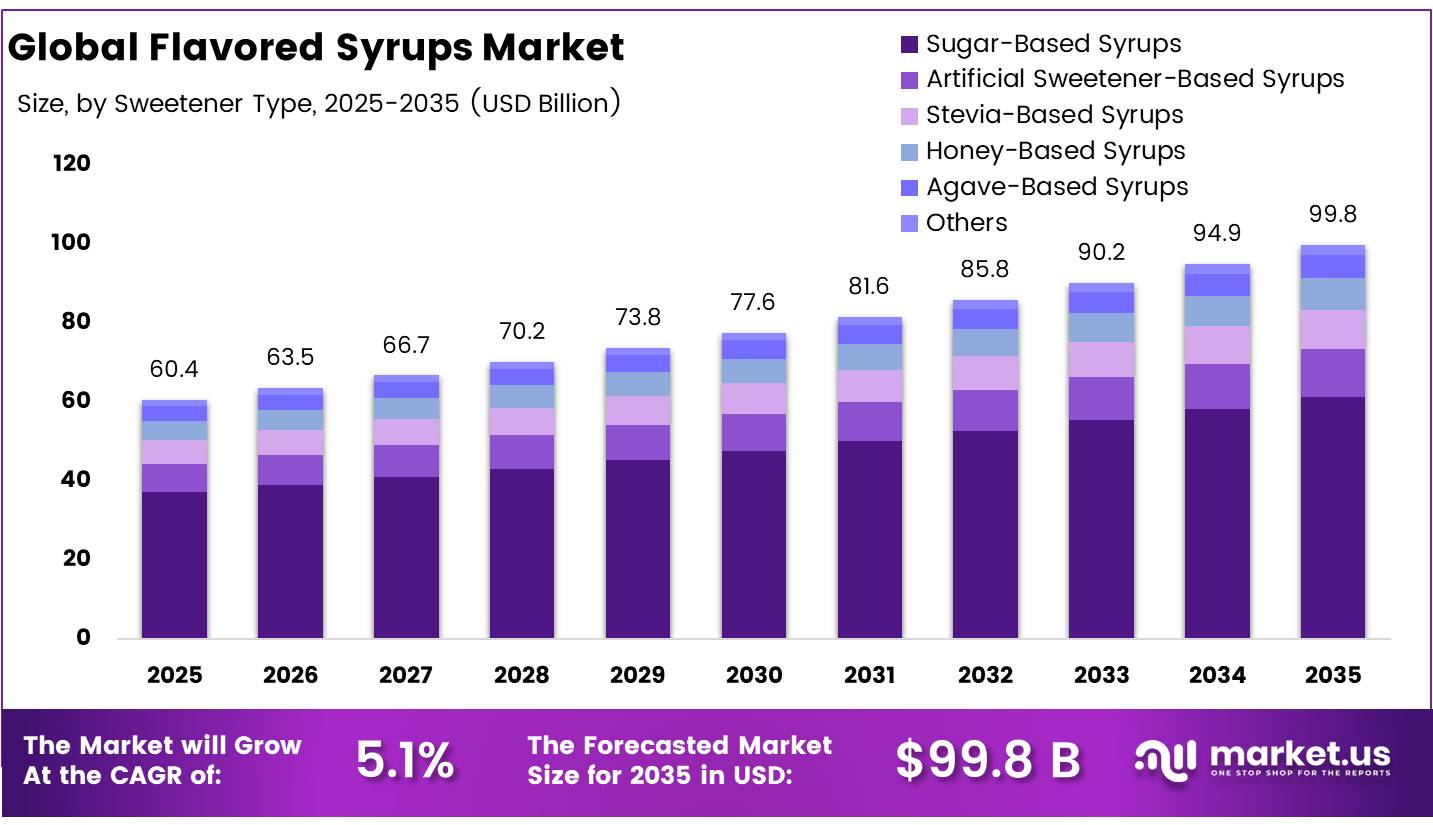
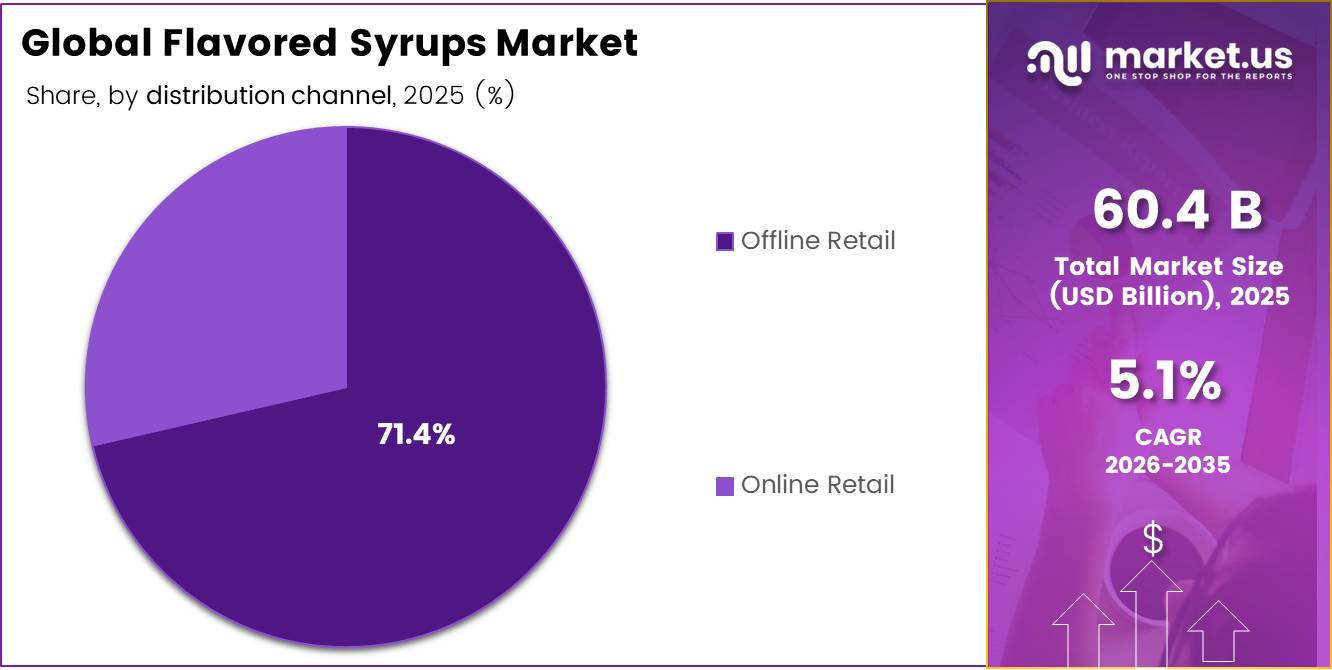
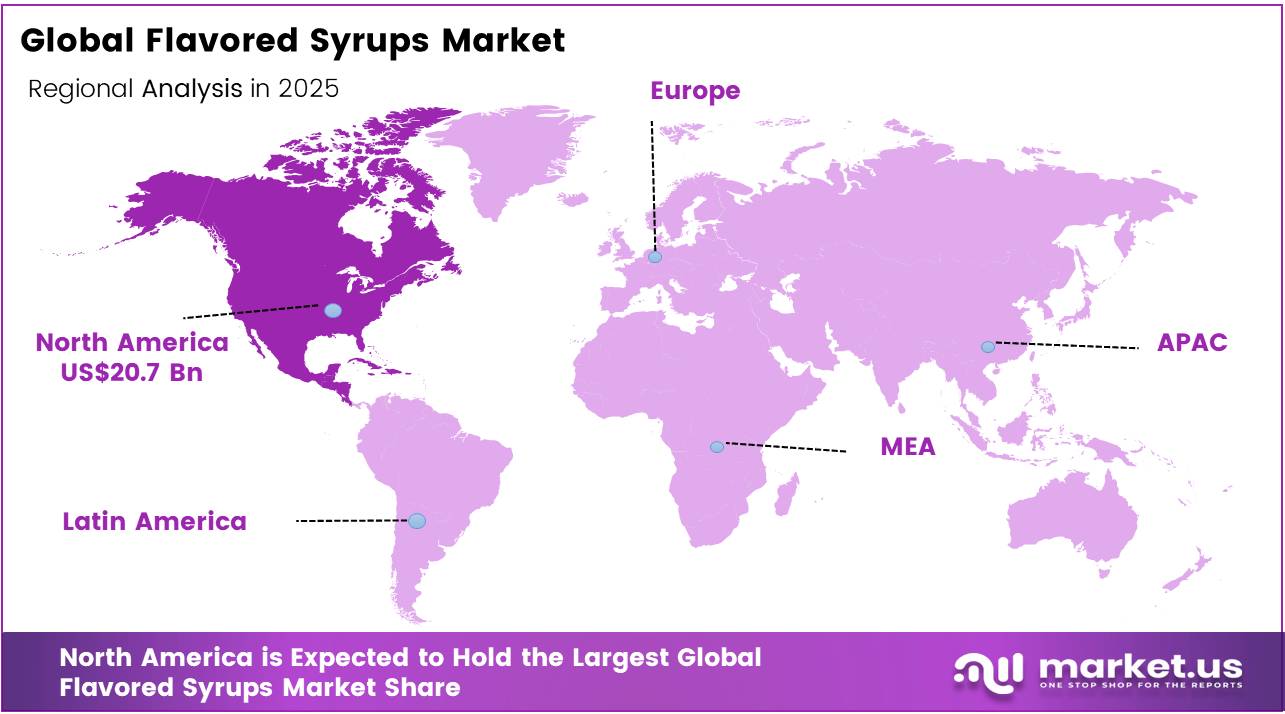
In 2025, the Global Flavored Syrups Market was valued at USD 60.4 billion, and between 2026 and 2035, this market is estimated to register a CAGR of 5.1%, reaching about USD 99.8 billion by 2035. In 2025, North America held a dominant market position, capturing more than a 34.2% share, holding USD 20.7 Billion revenue.
Key Takeaways
- The Global Flavored Syrups Market was valued at USD 60.4 billion in 2025.
- The Market is projected to grow at a CAGR of 5.1% and is estimated to reach USD 99.8 billion by 2035.
- On the basis of product type, Fruit Flavored Syrups flavored syrups dominated the market, constituting 28.7% of the total market share.
- Based on the nature, the conventional dominated the flavored syrups market, with a substantial market share of around 68.2%.
- Based on the Sweetener Type, Sugar-Based Syrups led the market, comprising 61.5% of the total market.
- Among the Distribution Channel, Offline Retail flavored syrups is the most considerable within the market, accounting for around 71.4% of the revenue.
- In 2025, the North America was the most dominant region in the flavored syrups market, accounting for 34.2% of the total global consumption.
The flavored syrup market is a core segment of the global food and beverage value chain, supporting product differentiation, taste enhancement, and formulation flexibility across beverages, confectionery, dairy, and foodservice applications. Demand is closely tied to the expansion of the processed food industry, specialty coffee culture, and the growing consumption of ready-to-drink beverages, where flavor customization requirements are steadily increasing. Sugar and sweetener derivatives represent the primary input base, with syrup formulations playing a decisive role in influencing product palatability, shelf life, and consumer acceptability.
According to the USDA Economic Research Service, availability of total caloric sweeteners reached 123.5 pounds per person in the United States in 2023, reflecting a sustained structural shift in sweetener consumption patterns across food and beverage applications. The sweetener consumption and food and beverage demand remain significant across North America and Asia Pacific
- According to the OECD-FAO Agricultural Outlook 2025–2034, global sugar consumption is projected to expand and reach 202 million metric tons, with syrups and fruit juices explicitly identified within the free sugars framework. The World Health Organization recommends reducing free sugar intake explicitly including syrups and fruit juice concentrates — to below 10% of total daily energy intake, increasingly shaping regulatory environments and reformulation strategies across major consuming markets globally.
Flavored Syrups Market Segments
Product Type Analysis
Fruit Flavored Syrups represents dominant Segment in the Market.
Fruits Flavored syrups dominates the global flavored syrup market at 28.7%, backed by their constant structural importance in the world’s food chains. Based on data from the USDA Economic Research Service (December 2024), around 80% of the US population fails to meet the minimum recommended levels of fruit intake, thereby fueling demand for fruit-based syrups as an alternative delivery mode for consumers. The FAO Food Outlook (2024) found that the global expenditure on imported food was in excess of USD 2 trillion during 2024, with increased expenditures seen for fruit and vegetable imports due to overall pressure on prices of commodities.
Vanilla-flavored syrups, commanding a 21.4% market share, are the fastest-growing premium category, owing to increasing consumption of specialty coffee drinks and clean label reformulation activities in North America and Asia-Pacific regions with growing foodservice recovery. This growth trajectory is further supported by trade-level indicators for vanilla as a key input. According to the USDA Foreign Agricultural Service GAIN report, U.S. imports of vanilla beans reached approximately 3,083 metric tons in 2023.
Nature Analysis
Conventional a significant nature.
The conventional flavored syrup market commands the highest market share of 68.2% due to its widespread use in foodservice, beverages production, and industrial food processing operations, where cost-effectiveness and product formulation consistency play the major roles in purchasing decisions. According to the World Health Organization (WHO), flavorings account for the largest category of food additives worldwide, numbering in hundreds of products employed in various food applications such as confectionery, soft drinks, cereals, and dairy.
The natural flavored syrup market is witnessing the strongest growth among all segments, attributed to consumer demand for clean-label formulations. According to the USDA Economic Research Service report of 2025, in 2024 U.S. sales of organic foods totaled $65.4 billion, marking a year-on-year increase in real terms for the first time since 2020 and thus indicating a long-term change in consumer preferences towards organic product positioning.
Sweetener Type Analysis
Sugar-Based Syrups Are the Most Widely Used Sweetener.
The sugar-based syrups occupy the most dominating place in the flavored syrup market with 61.5% share owing to unmatched functional attributes such as carrying flavors, imparting texture, and preserving foods in beverages, food services, and even industrial foods. As per the USDA Economic Research Service, Sugar & Sweeteners Outlook Report (May 2025), the sugar deliveries of the United States for food and beverages purposes during 2024/25 were estimated to reach 12.150 million short tons (raw value).
The growth of stevia-based syrups will be the highest as consumers become increasingly conscious about health policies favoring the inclusion of calorie-free and natural syrups in beverages and food preparations. The Acceptable Daily Intake of Steviol Glycosides is between 0 – 4 mg/kg body weight, which has been established by the Joint FAO/WHO Expert Committee on Food Additives (JECFA).
Distribution Analysis
Offline Retail Held a Major Share of the distribution channel.
The Offline retail channel dominates the distribution market for flavored syrups at 71.4%, based on the significance of the established network of supermarkets, hypermarkets, specialty food stores, and foodservice providers as the major source of purchase for both households and industry users. The importance of physical retail is inevitable, especially in developing countries where the necessary digital and logistic support for transporting perishable and liquid food products is insufficiently developed.
Based on the data from the U.S. Census Bureau, the monthly revenue generated by food and beverages stores during January 2026 amounted to USD 85,049 million, continuing to follow the upward trend recorded in previous periods such as the USD 85,002 million sales in December 2025 and USD 85,111 million in September 2025. Institutional and business-to-business offline transactions further reinforce this domination within the hotel, restaurant, and cafe segments.
Online retail has the lowest share, but the highest rate of growth. The U.S. Census Bureau reported that the sales of online businesses increased 9.8% year-over-year in Q1 2026, exceeding the total retail sales growth of 3.9% for the quarter.
Key Market Segments
By Product Type
- Fruit Flavored Syrups
- Chocolate Flavored Syrups
- Vanilla Flavored Syrups
- Caramel Flavored Syrups
- Coffee Flavored Syrups
- Mint Flavored Syrups
- Others
By Nature
- Natural
- Conventional
By Sweetener Type
- Sugar-Based Syrups
- Artificial Sweetener-Based Syrups
- Stevia-Based Syrups
- Honey-Based Syrups
- Agave-Based Syrups
- Others
By Distribution Channel
- Online Retail
- E-commerce Platforms
- Brand-Owned Websites
- Offline Retail
- Supermarkets & Hypermarkets
- Convenience Stores
- Specialty Stores
- Foodservice Distributors
- Wholesale Stores
Drivers
Low-sugar reformulation and tax-threshold optimization
Sugar policy tightening has become a direct formulation and pricing lever for syrup producers supplying beverages, dessert toppings and concentrates. WHO 2026 global review confirms sugar sweetened beverage taxation is a mainstream policy tool while Europe expands threshold based taxes including 2025–2026 coverage of beverages and concentrates. UK lowered threshold from 5g to 4.5g per 100ml with implementation by January 2028. Levy bands remain about 19.4p per litre and 25p per litre. This is driving reformulation into zero sugar and reduced sugar syrups plus high intensity flavor systems preserving sweetness perception at lower dosage and enabling better for you positioning improving market.
Drivers Impact Analysis
| Driver | (~) % Impact on CAGR | Geographic Relevance | Impact Timeline |
|---|---|---|---|
| Low-sugar reformulation and tax-threshold optimization | 1.40% | EU core, UK, North America reformulation, selective APAC urban markets | Short term (≤ 2 years) |
| Specialty coffee and beverage customization expansion | 1.20% | North America core, Western Europe, East Asia, GCC urban foodservice | Short term (≤ 2 years) |
| Premium natural flavors and clean-label conversion | 1.00% | North America, EU, Japan, South Korea, premium APAC corridors | Medium term (2-4 years) |
| At-home mixology, café-style consumption, and multi-use retail formats | 0.80% | North America, Europe, Australia, affluent APAC metros | Short term (≤ 2 years) |
| Functional and hybrid beverage innovation | 0.70% | North America, EU, China, Southeast Asia, developed urban retail | Medium term (2-4 years) |
| Emerging-market foodservice formalization and flavor localization | 0.90% | India, Southeast Asia, Middle East, Latin America spill-over | Long term (≥ 4 years) |
Restraints
Sugar-tax pressure
Sugar taxation is increasingly constraining flavored syrup volume growth because syrups directly influence sugar content in beverages such as coffees, sodas, shakes, and dessert drinks. WHO’s 2026 review confirms sugar-sweetened beverage taxes are now widely adopted policy tools, while European and UK threshold-based levies penalize high-sugar formulations and reward low-sugar alternatives. In the UK system, breaching sugar limits increases per-litre taxation, forcing either price increases or reformulation. This creates margin pressure for syrup suppliers, reduces high-sugar SKU competitiveness, and shifts demand toward fewer compliant low-sugar core flavors, particularly across the UK, EU, and North American foodservice markets with about 1.5% growth drag overall.
Restraint Impact Analysis
| Restraint | (~) % Impact on CAGR | Geographic Relevance | Impact Timeline |
|---|---|---|---|
| Sugar-tax pressure | -1.50% | EU core, UK, North America reformulation markets | Short term (≤ 2 years) |
| Ingredient cost volatility | -1.30% | Global, APAC sourcing, EU and North America manufacturing | Short term (≤ 2 years) |
| Consumer trade-down | -1.00% | North America, Western Europe, developed APAC | Short term (≤ 2 years) |
| Clean-label reformulation cost | -0.80% | North America core, EU, Japan, South Korea | Medium term (2-4 years) |
| Packaging compliance burden | -0.70% | EU core, UK spill-over, premium export corridors | Medium term (2-4 years) |
| Foodservice channel fragility | -0.90% | Urban North America, Europe, GCC, emerging APAC corridors | Medium term (2-4 years) |
Opportunity
Emerging-market cafe roll-up supply
The future growth opportunity for flavored syrups lies in structured supply partnerships with fast-scaling regional café and beverage chains rather than fragmented independent outlets. In emerging markets across Southeast Asia and the Middle East, and selective urban chains elsewhere, beverage retail is still formalizing into organized multi-outlet formats, enabling contract-based syrup supply models. Targeting 20–50 chain customers with 50–300 outlets each can deliver more stable and predictable demand versus fragmented café sales. Private-label and co-branded programs can reduce selling costs by 15–25%, while early infrastructure investment in warehousing and localized flavors may add about 1.1% CAGR uplift by 2028–2030.
Opportunity Impact Analysis
| Opportunity | (~) % Potential CAGR | Geographic Relevance | Execution Window |
|---|---|---|---|
| Functional syrup platforms | 1.50% | North America core, EU, Japan, South Korea, urban China | Medium term (2-4 years) |
| RTD and fountain B2B pivot | 1.30% | North America, EU, GCC, developed APAC | Short term (≤ 2 years) |
| Zero-sugar premiumization | 1.20% | North America, UK, EU, India metros, Southeast Asia | Short term (≤ 2 years) |
| Emerging-market café roll-up supply | 1.10% | India, Southeast Asia, Middle East | Medium term (2-4 years) |
| Refill and dispenser systems | 0.90% | EU core, UK spill-over, North America foodservice | Medium term (2-4 years) |
| Flavor IP and local M&A | 0.80% | APAC corridors, Latin America, boutique EU markets | Long term (≥ 4 years) |
Challenges
Agricultural input volatility
The flavored syrup sector faces structural cost volatility due to exposure to multiple agricultural inputs, including sugar, cocoa, coffee, vanilla, and fruit concentrates, which move independently and create complex pricing instability. Climate-driven supply shocks pushed cocoa above USD 10,000 per metric ton in 2024 and arabica coffee futures beyond USD 4.40 per pound in 2025, amplifying raw material uncertainty. As a result, blended input costs fluctuate about 10–25% year-on-year, while fixed 12-month foodservice contracts create margin pressure. This mismatch increases formulation and procurement costs by 2–5% and reduces potential sector CAGR by approximately 1.2 percentage points globally.
Challenge Impact Analysis
| Challenge | (~) % Potential CAGR | Geographic Relevance | Mitigation Horizon |
|---|---|---|---|
| Agricultural input volatility | -1.20% | Global sourcing corridors, APAC, Latin America, EU manufacturing | Medium term (2-4 years) |
| Private-label and SKU proliferation | -1.00% | North America core, EU retail, developed APAC | Short term (≤ 2 years) |
| Food safety and traceability compliance | -0.90% | EU regulatory hubs, North America, export-oriented APAC | Medium term (2-4 years) |
| Shelf-life and cold chain complexity | -0.80% | Emerging APAC, Middle East, Latin America, warm-climate corridors | Long term (≥ 4 years) |
| Skilled formulation talent deficit | -0.70% | North America, EU, developed APAC manufacturing clusters | Medium term (2-4 years) |
| Channel fragmentation and DTC economics | -0.60% | North America, EU, India, Southeast Asia e-commerce corridors | Short term (≤ 2 years) |
Geopolitical Impact Analysis
Geopolitical Realignment and Supply Chain Fragmentation Reshaping Flavored syrups Manufacturing.
The ongoing wars and geopolitical unrest are putting significant pressure on the global flavored syrup market by disrupting the supply and prices of important raw materials like sugar, corn syrups, fruits derivatives, and energy-based materials. The war between Russia and Ukraine, conflicts in the Middle East, and Sudan unrests have destabilized the supply chains of raw materials, creating cost and margin pressures for the manufacturers.
- The Food and Agriculture Organization’s (FAO) State of Food Security and Nutrition in 2025 estimates that the main cause of acute food insecurity globally in 2024 was the conflict which affected 139.8 million people, whereas there was an increase in the fertilizer prices by 38%, increasing from USD 354 per tonne to USD 489 per tonne in January-September 2025.
As a result, flavored syrup manufacturers will have to adopt new sourcing policies to minimize risks in the wake of the ongoing crises. According to FAO, escalation in conflicts in the Near East region increased energy and fertilizer prices besides disrupting their production and supply chains.
Based on the FAO’s framework analysis on food price inflation after the pandemic period, it is clear that the war in Ukraine together with disruptions caused by the COVID-19 pandemic resulted in drastic surges in international food prices, with the highest levels of food price inflation occurring in March 2022 an occurrence that revealed critical structural weaknesses in the integrated agri-food systems around the world.
Regional Analysis
North America Held the Largest Share of the Global Flavored Syrups Market.
North America holds a prominent position within the global flavored syrup market, accounting for 34.2%, primarily due to the well-developed foodservice infrastructure in the region, high consumption of specialty beverages, and consistent growth in per capita food expenditure. As per estimates from the USDA Economic Research Service, consumer and business expenditure on food and beverages reached USD 2.58 trillion in 2024 from USD 2.48 trillion in 2023.
Meanwhile, according to the U.S. Bureau of Economic Analysis, personal consumption expenditure on purchased meals and beverages grew to USD 1.260 trillion in 2025 from USD 1.196 trillion in 2024, which clearly indicates the robust structural growth in out-of-home consumption and specialty beverages culture.
Asia Pacific holding an 18.0% share, represents the fastest-growing regional market. The OECD-FAO Agricultural Outlook 2025-2034 suggests that India and Southeast Asian countries will account for 39% of global food consumption growth by 2034 due to population growth, increasing income, and urbanization.
Key Regions and Countries
- North America
- The US
- Canada
- Europe
- Germany
- France
- The UK
- Spain
- Italy
- Russia & CIS
- Rest of Europe
- APAC
- China
- Japan
- South Korea
- India
- ASEAN
- Rest of APAC
- Latin America
- Brazil
- Mexico
- Rest of Latin America
- Middle East & Africa
- GCC
- South Africa
- Rest of MEA
Key Players Analysis
The competitive landscape of the international flavored syrup market can be considered a moderately competitive structure, featuring the presence of giant food ingredients multinationals, traditional confectioneries and sweeteners producers, specialized food service manufacturers, and artisanal/clean-label brands that make up an emerging market share. The competition is defined not only in terms of price but rather focuses on differentiation based on such criteria as flavors’ uniqueness, quality of ingredient sourcing, clean-labeling, business-to-business cooperation with food service providers, and broadness of distribution.
Companies compete among themselves using the strategies of efficiency improvement, responding to customers’ demands, and identifying new marketing opportunities within the food industry. Moreover, the level of competition within the segment is influenced by the ongoing trend of industry consolidation. According to the USDA Economic Research Service, the increased concentration in food industries was related to consolidation among businesses due to technology development, changes in consumer needs, and redesigning supply chains.
The Major Players in The Industry
- The Hershey Company
- The Kraft Heinz Company
- Kerry Group
- Tate & Lyle
- Toschi Vignola s.r.l.
- Monin Inc.
- Fuerst Day Lawson
- Torani
- The J.M. Smucker Company
- Panos Brands
- Amoretti
- Skinny Mixes.
- Nature’s Flavors, Inc.
- Sonoma Syrup Co
- Other Key Players
Key Development
- In April 2024, Torani introduced the Dragon Fruit Syrup to diversify its range of flavors in response to increasing consumer preference for exotic and tropical flavors in both beverages and desserts, marking an ongoing effort in product innovation within the premium foodservice syrups market.
- In April 2025, The Hershey Company announced its acquisition of LesserEvil, an organic snacks brand, reflecting its broader strategic shift toward better-for-you, clean-label product portfolios across its food and topping segments.
Report Scope
| Report Features | Description |
|---|---|
| Market Value (2025) | US$60.4Bn |
| Forecast Revenue (2035) | US$99.8Bn |
| CAGR (2026-2035) | 5.1% |
| Base Year for Estimation | 2025 |
| Historic Period | 2020-2024 |
| Forecast Period | 2026-2035 |
| Report Coverage | Revenue Forecast, Market Dynamics, Competitive Landscape, Recent Developments |
| Segments Covered | By Product Type (Fruit Flavored Syrups, Chocolate Flavored Syrups, Vanilla Flavored Syrups, Caramel Flavored Syrups, Coffee Flavored Syrups, Mint Flavored Syrups, and Others), By Nature (Natural and Conventional), By Sweetener Type (Sugar-Based Syrups, Artificial Sweetener-Based Syrups, Stevia-Based Syrups, Honey-Based Syrups, Agave-Based Syrups, and Others), By Distribution Channel (Online Retail and Offline Retail) |
| Regional Analysis | North America – The US & Canada; Europe – Germany, France, The UK, Spain, Italy, Russia & CIS, Rest of Europe; APAC– China, Japan, South Korea, India, ASEAN & Rest of APAC; Latin America– Brazil, Mexico & Rest of Latin America; Middle East & Africa– GCC, South Africa, & Rest of MEA |
| Competitive Landscape | The Hershey Company, The Kraft Heinz Company, Kerry Group, Tate & Lyle, Toschi Vignola s.r.l., Monin Inc., Fuerst Day Lawson, Torani, The J.M. Smucker Company, Panos Brands, Amoretti, Skinny Mixes., Nature’s Flavors, Inc., Sonoma Syrup Co, Other Key Players |
| Customization Scope | Customization for segments, region/country-level will be provided. Moreover, additional customization can be done based on the requirements. |
| Purchase Options | We have three licenses to opt for: Single User License, Multi-User License (Up to 5 Users), Corporate Use License (Unlimited Users and Printable PDF) |


