


Report Overview
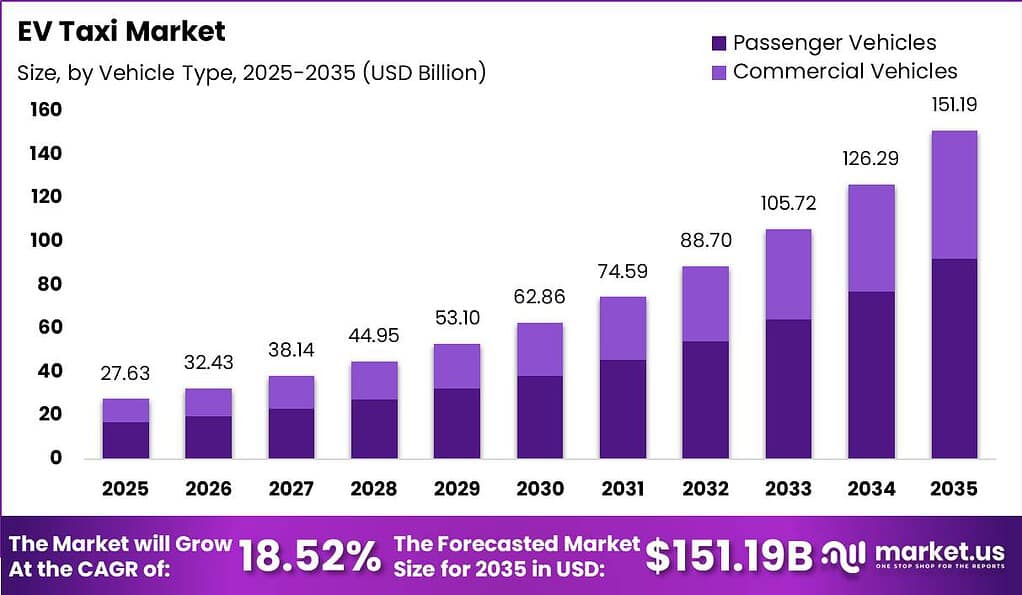
The EV Taxi Market size is expected to be worth around USD 151.19 Billion by 2035 from USD 27.63 Billion in 2025, growing at a CAGR of 18.52% during the forecast period 2026 to 2035. This trajectory reflects a structural shift in urban mobility investment, not just a product upgrade cycle. Operators and city planners who commit to fleet electrification now will gain first-mover cost advantages before infrastructure competition intensifies.
The EV taxi market covers electric-powered vehicles deployed across ride-hailing, ride-sharing, corporate transport, and airport shuttle services. It spans passenger vehicles and commercial van and minibus formats. Ownership structures range from company-operated and franchise fleets to individually owned and leased models. The market intersects vehicle manufacturing, charging infrastructure, platform technology, and urban transport policy.
Key Takeaways
- The global EV Taxi Market was valued at USD 27.63 Billion in 2025 and is forecast to reach USD 151.19 Billion by 2035.
- The market expands at a CAGR of 18.52% over the forecast period 2026 to 2035.
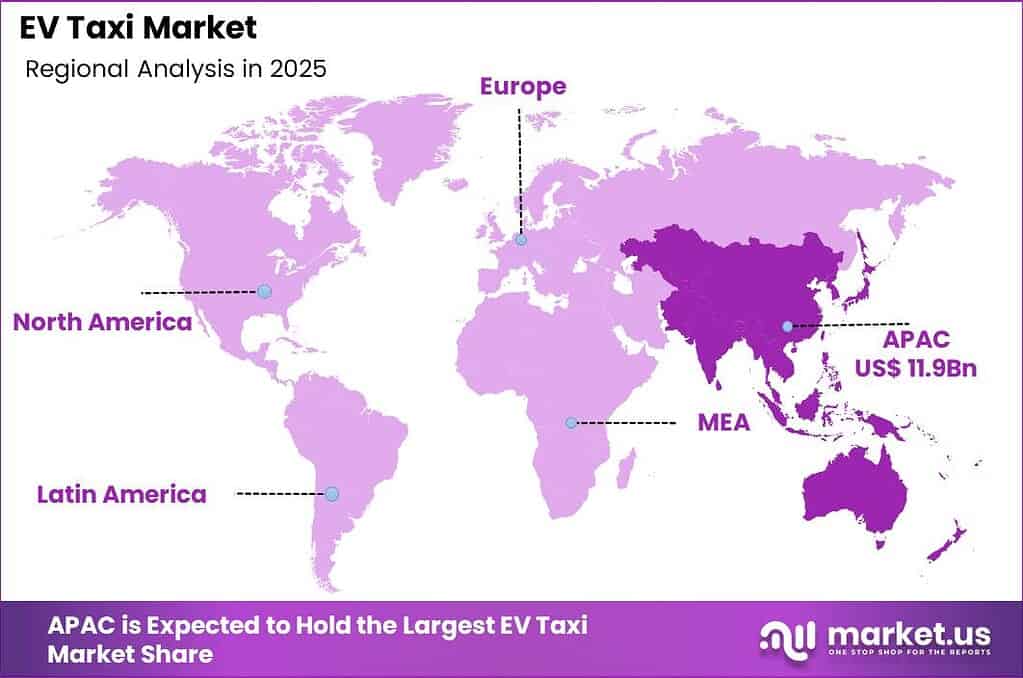
- Asia Pacific dominates regional performance with a market share of 43.02%, valued at USD 11.90 Billion in 2025.
- Passenger Vehicles lead the By Vehicle Type segment with a 61.00% share.
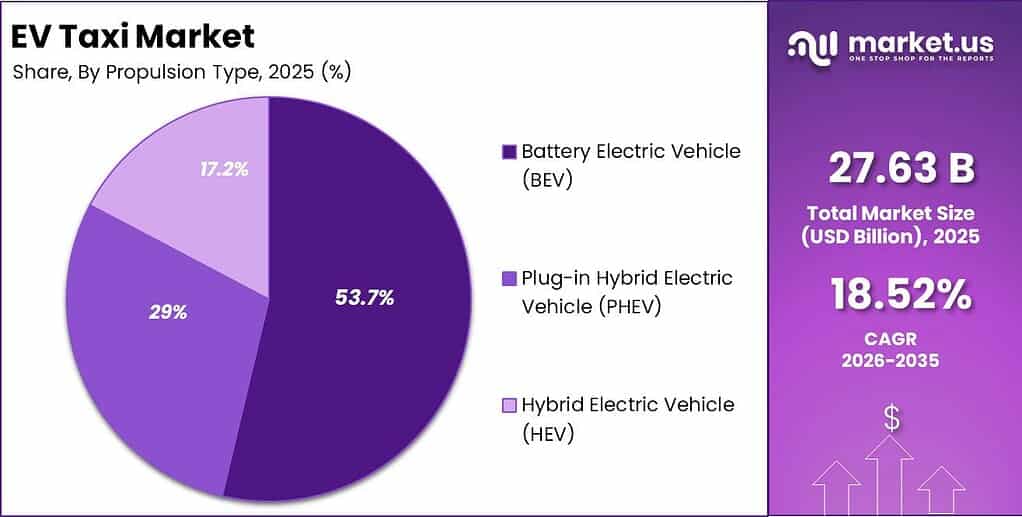
- Battery Electric Vehicles (BEV) lead the By Propulsion Type segment with a 53.72% share.
- Ride-Hailing leads the By Service Model segment with a 65.88% share.
- Fleet-Owned models lead the By Ownership Model segment with a 51.58% share.
Government policy is the most direct accelerant in this market. Norway mandated fully electric taxi operations in Oslo from November 2024, proving that regulatory deadlines translate into near-total fleet conversion within a single city. Europe’s plug-in passenger-vehicle registrations reached roughly 298,000 units in January 2026, up around 22% year on year. Policy frameworks that combine purchase subsidies, zone access privileges, and reskilling funds are compressing the adoption timeline for entire urban fleets.
As per our research, replacing diesel taxi fleets with battery-electric vehicles avoids approximately 700 metric tonnes of NOx and particulate matter emissions annually. Switching from CNG to BEV eliminates around 180 metric tonnes of these pollutants per year. These quantified environmental gains give operators a concrete compliance and branding argument that strengthens contracts with corporate clients and municipal authorities who set air-quality targets.
As per our research, binding EU fleet electrification rules from 2030 could generate demand for up to 2.1 million new EVs from corporate and fleet buyers alone. Taxi and ride-hailing operators represent a material share of that total. This signals that fleet procurement decisions made in the next two to three years will determine which vehicle suppliers and platform operators hold scale advantages when mandatory targets take effect.
Vehicle Type Analysis
Passenger Vehicles dominate with 61.00% due to urban trip-length and rider comfort fit.
In 2025, Passenger Vehicles held a dominant market position in the By Vehicle Type segment of the EV Taxi Market, with a 61.00% share. The International Energy Agency reported that global electric passenger car stock exceeded 40 million units by end of 2023, establishing a deep supply base for taxi operators sourcing EV sedans and hatchbacks. Passenger vehicles match the short-to-medium urban trip profile that defines most ride-hailing demand. Fleet operators converting from ICE to EV naturally prioritize this category first because vehicle availability, model diversity, and charging compatibility are highest.
Sedans form the core of EV taxi pavement fleets in most metropolitan markets. IEA data shows that battery-electric sedans account for the majority of new EV passenger models available to fleet buyers across China, Europe, and North America. Their low floor height, trunk capacity, and passenger familiarity make them the lowest-friction vehicle to introduce into an existing taxi licence framework. Operators running sedan-heavy fleets report faster driver adoption and lower retraining costs compared to larger formats.
Hatchbacks serve price-sensitive urban corridors where compact dimensions and lower acquisition cost matter. According to the European Automobile Manufacturers Association, compact and subcompact BEV models represented a growing proportion of fleet-eligible vehicles registered in Europe through 2024. Their smaller battery packs reduce upfront cost, which directly addresses the financing barrier that restrains individual taxi driver adoption. This positions hatchbacks as an entry-level electrification path in cities where sedan price points remain prohibitive for owner-operators.
SUVs and MPVs address premium and group-travel segments, while Commercial Vehicles, the fastest-growing sub-category, cover electric vans and minibuses used in airport shuttle and corporate transfer services. UITP data confirms that multi-passenger electric vehicles are entering urban-mobility service contracts at an accelerating rate as cities expand zero-emission zone requirements to cover all for-hire transport. Together these formats capture the remaining fleet demand beyond the dominant passenger-vehicle core.
Propulsion Type Analysis
Battery Electric Vehicle (BEV) dominates with 53.72% due to zero-emission mandate compliance advantage.
In 2025, Battery Electric Vehicle (BEV) held a dominant market position in the By Propulsion Type segment of the EV Taxi Market, with a 53.72% share. ITU data on urban digital infrastructure investment shows that smart-charging networks supporting BEV-only fleets received priority deployment funding in over 30 cities globally through 2024. BEVs align directly with municipal zero-emission zone requirements, making them the only propulsion type that guarantees compliance across all current and projected urban access policies. Fleet operators choosing BEV eliminate fuel-cost volatility entirely, replacing it with predictable electricity tariffs.
Plug-in Hybrid Electric Vehicles (PHEV) represent the fastest-growing propulsion sub-segment. World Bank data on transport electrification transitions shows that PHEV adoption in emerging markets increased as operators sought vehicles capable of operating on both grid power and liquid fuel in regions with unreliable charging infrastructure. PHEVs reduce range anxiety for drivers in cities where fast-charger density remains low. This makes them a transitional bridge technology, particularly relevant in Latin America, Southeast Asia, and parts of Africa where grid stability limits pure BEV adoption.
Hybrid Electric Vehicles (HEV) serve operators in markets where neither full electrification subsidies nor charging infrastructure have reached sufficient scale. According to national automotive statistical offices in Japan and Southeast Asia, HEV taxi registrations remained a significant share of new for-hire vehicle additions through 2024, reflecting a practical compromise between fuel efficiency and operational reliability. HEVs generate lower emission reductions than BEVs but reduce per-kilometre fuel costs meaningfully. As BEV infrastructure matures, HEV operators face increasing pressure to accelerate full electrification.
Service Model Analysis
Ride-Hailing dominates with 65.88% due to app-platform scale and real-time dispatch efficiency.
In 2025, Ride-Hailing held a dominant market position in the By Service Model segment of the EV Taxi Market, with a 65.88% share. In June 2026, GSM Green and Smart Mobility officially launched its New Delhi fleet operations under its premium Limo Green tier, expanding app-based EV ride-hailing into one of the world’s largest urban mobility markets. UN Comtrade data shows that electric passenger vehicles shipped under ride-hailing platform contracts represented a fast-rising volume in cross-border fleet procurement through 2024. Platform operators with proprietary dispatch algorithms can route EV taxis to chargers during low-demand windows, maximising vehicle uptime and fleet economics.
App-based Ride-Hailing and Corporate Ride-Hailing together comprise the two operating formats within this dominant segment. Corporate ride-hailing captures contracted enterprise clients who require predictable, emission-compliant vehicle access for employee transport. ITC Trade Map data shows that corporate fleet procurement of electric passenger vehicles grew across major business hubs in Asia and Europe through 2024. Corporate contracts provide fleet operators with guaranteed utilisation rates, reducing the revenue unpredictability that makes EV financing more complex for individual owner-operators.
Ride-Sharing pools multiple passengers into single trips, reducing per-passenger cost and improving vehicle utilisation. Airport and Tourism Shuttles represent the fastest-growing service model sub-segment, driven by airport authority sustainability commitments and tourism authority green-access requirements. ICAO data on ground transport electrification at major international airports shows that dedicated EV shuttle contracts are now part of standard airport concession tenders in Europe and Asia. This creates a recurring, high-volume revenue channel for fleet operators willing to specialise in fixed-route electric shuttle operations.
Ownership Model Analysis
Fleet-Owned dominates with 51.58% due to centralised procurement and charging infrastructure control.
In 2025, Fleet-Owned held a dominant market position in the By Ownership Model segment of the EV Taxi Market, with a 51.58% share. UNIDO manufacturing output data shows that purpose-built EV taxi production lines, scaled for fleet-volume orders of 500 units or more, were operational across China and expanding into Southeast Asia by 2024. Centralised fleet ownership allows operators to deploy shared charging depots, negotiate bulk electricity tariffs, and standardise vehicle maintenance. This cost structure is structurally superior to fragmented individual ownership in high-utilisation urban markets.
Company-Operated Fleets and Franchise Fleets form the two primary fleet-ownership structures. Company-operated fleets give platform operators direct control over vehicle condition, driver standards, and energy costs. Franchise fleets extend that model by licensing branded operations to regional partners, reducing capital requirements at the centre while maintaining service consistency. Corporate annual reports from major Asian ride-hailing operators confirm that franchise fleet growth outpaced direct ownership expansion in secondary cities through 2024, reflecting capital-efficient scaling strategies.
Individually-Owned taxis retain relevance in markets where licensing regimes and cultural norms favour owner-operator models. Customs database records from India and Southeast Asia show continued individual EV taxi registrations through 2024, though growth rates lag behind fleet-owned models due to financing constraints. Leasing and Subscription models represent the fastest-growing ownership sub-segment. These structures lower the upfront barrier for individual drivers by converting capital expenditure into a monthly operating cost, directly addressing the financing gap that UITP identifies as a primary adoption barrier.
Key Market Segments
By Vehicle Type
- Passenger Vehicles
- Sedans
- Hatchbacks
- SUVs and MPVs
- Commercial Vehicles
- Electric Vans
- Minibuses
By Propulsion Type
- Battery Electric Vehicle (BEV)
- Plug-in Hybrid Electric Vehicle (PHEV)
- Hybrid Electric Vehicle (HEV)
By Service Model
- Ride-Hailing
- App-based Ride-Hailing
- Corporate Ride-Hailing
- Ride-Sharing
- Airport and Tourism Shuttles
By Ownership Model
- Fleet-Owned
- Company-Operated Fleets
- Franchise Fleets
- Individually-Owned
- Leasing and Subscription
Regional Analysis
Asia Pacific Dominates the EV Taxi Market with a Market Share of 43.02%, Valued at USD 11.90 Billion
Asia Pacific commands the EV taxi market through a combination of high urban density, strong domestic EV manufacturing, and government-backed fleet mandates in China, India, and Vietnam. According to the ICCT, EU-wide BEV share among new passenger-car registrations reached 25% in December 2025, with total new car registrations around 11 million for that year, showing European fleet renewal is accelerating. Asia Pacific benefits from lower EV acquisition costs driven by Chinese manufacturing scale, giving regional fleet operators a cost advantage unavailable to counterparts in North America or Europe.
Europe is the fastest-growing region in this market. Policy mandates including Oslo’s full EV taxi requirement from November 2024 and the EU’s expanding zero-emission zone framework are converting policy commitment into measurable fleet turnover. In June 2025, Gojek formed a structural fleet integration pact with Green SM, enabling Indonesian passengers to book Green SM electric taxis across rival ride-hailing apps, signalling that cross-platform EV fleet sharing is accelerating regional market depth beyond single-operator control. European operators face the highest compliance pressure of any region, which translates into the fastest procurement cycle for new EV taxi stock.
North America, Latin America, and the Middle East and Africa regions represent earlier-stage but structurally significant markets. North America benefits from growing autonomous EV taxi pilots and platform operator investment. Latin America and MEA face infrastructure constraints that slow BEV adoption but create long-run opportunity for leasing and PHEV models. These regions collectively absorb the remaining market share and will increase their contribution as charging networks expand and local government policy frameworks mature over the forecast period.
Key Regions and Countries
North America
- US
- Canada
Europe
- Germany
- France
- The UK
- Spain
- Italy
- Rest of Europe
Asia Pacific
- China
- Japan
- South Korea
- India
- Australia
- Rest of APAC
Latin America
- Brazil
- Mexico
- Rest of Latin America
Middle East and Africa
- GCC
- South Africa
- Rest of MEA
Market Dynamics
Market Opportunity Analysis - Underpenetrated service models and ownership structures offer targeted entry points for fleet operators and investors.
Airport and Tourism Shuttles represent the fastest-growing service model sub-segment yet remain structurally underdeveloped relative to the dominant ride-hailing channel. Most airport concession tenders now include EV requirements, but few operators have built dedicated electric shuttle fleets at scale. Operators willing to specialise in fixed-route, high-frequency airport transfers can secure long-term contracted revenue with lower demand variability than general ride-hailing, giving them a more bankable cash-flow profile for EV fleet financing.
The Leasing and Subscription ownership model is the fastest-growing ownership sub-segment but currently addresses only a small fraction of the market’s 51.58% fleet-owned dominant base. Leasing structures convert capital expenditure into operating costs, directly removing the primary barrier restraining individual driver adoption. Financial institutions and fleet operators that develop taxi-specific leasing products will access a buyer pool that has been effectively locked out of EV ownership by conventional auto-loan structures.
Commercial Vehicles, covering electric vans and minibuses, are the fastest-growing vehicle type sub-segment but remain underweighted against passenger vehicles which hold 61.00% of the segment. Corporate clients and municipal transport authorities are increasingly requiring zero-emission group-transport solutions. Operators entering the electric van and minibus space now face lower competitive intensity than the saturated sedan and hatchback ride-hailing channel, creating a window for early movers to secure long-duration fleet contracts before larger platform operators turn their capital toward this format.
Individually-Owned taxis in India and Southeast Asia represent a geographically underpenetrated ownership tier. Asia Pacific commands 43.02% of the global market, yet a large share of that base remains in ICE vehicles owned by individual licensed drivers. Financing products and government subsidy programmes targeted specifically at individual EV taxi buyers in these markets could convert a substantial segment of existing ICE drivers into EV operators, deepening regional market penetration without requiring the large capital outlays that company-operated fleet models demand.
Technology and Innovation Landscape - Autonomous vehicle systems and fleet analytics are redefining competitive positioning in EV taxi operations
Level 4 autonomous vehicle technology has moved from pilot to commercial deployment within the EV taxi market. In January 2026, Didi Global’s R2 Robotaxi entered commercial delivery as a purpose-built mass-produced autonomous vehicle developed through the Anditech joint venture with GAC Aion. This shift from software trials on existing platforms to purpose-engineered autonomous taxi hardware signals that the technology development cycle is contracting. Operators without a clear autonomous vehicle roadmap face increasing margin pressure as driverless cost structures enter the competitive set.
Proprietary dispatch and routing software represents the second major technology axis separating leading platforms from followers. App-based platforms that integrate real-time state-of-charge data into dispatch algorithms can route EV taxis to chargers during demand troughs, maintaining vehicle availability without sacrificing revenue hours. This operational advantage compounds over time because it improves asset utilisation and reduces energy cost per kilometre simultaneously. Operators running generic fleet management tools cannot replicate this efficiency without building or acquiring purpose-built EV dispatch capability.
Unsupervised autonomous ride-hailing network technology entered commercial urban deployment with Tesla’s April 2026 expansion to Dallas and Houston. This represents a qualitative shift from supervised autonomous pilots to fully driverless commercial service at city scale. The technology removes the single largest operating cost in taxi economics, driver wages, converting a variable cost into a fixed asset depreciation and software maintenance line. Platforms that deploy this technology at scale will price below conventional EV taxi operators, compressing margins across the entire service model segment.
Cross-platform fleet integration technology is emerging as a structural innovation layer above individual operator apps. Gojek’s June 2025 pact with Green SM enabled Indonesian passengers to book Green SM electric taxis through Gojek’s app, creating a federated EV fleet network without requiring either party to own the other’s assets. This interoperability model allows smaller regional EV fleet operators to access demand at platform scale without building their own rider acquisition infrastructure. Investors backing platform-agnostic fleet integration technology gain exposure to the full market rather than any single operator’s ride volume.
Drivers
Norway’s policy framework required all taxis in Oslo to operate as fully electric from November 2024, demonstrating that city-level regulation can drive 100% BEV fleet conversion within a compressed timeline. Europe entered 2026 with BEVs representing around 20% of new passenger-car registrations, up from about 17% in January 2025. Plug-in passenger-vehicle registrations in January 2026 reached roughly 298,000 units, up approximately 22% year on year. This policy-driven supply expansion creates a growing pool of eligible EV models for taxi procurement.
UITP analysis confirms that successful taxi electrification requires multi-level government action. Subsidies that cut upfront purchase costs, privileged urban-zone access, and dedicated fleet-conversion funds are classified as key success factors, not optional measures. This structured policy toolkit adds an estimated +5.5% to the EV Taxi Market’s baseline CAGR of 18.52%. Investors and fleet operators in cities that combine these levers with rising BEV registration share face the lowest adoption friction and the clearest route to fleet-wide electrification.
| Driver | (~) % Impact on CAGR Forecast | Geographic Relevance | Impact Timeline |
|---|---|---|---|
| Regulatory and policy push for zero-emission taxi fleets | +5.5% | Europe | Short term (≤ 2 years) |
| Rising BEV share in new passenger-car registrations | +4.3% | Europe | Short term (≤ 2 years) |
| Corporate-fleet electrification momentum | +3.2% | Europe | Medium term (2-4 years) |
| Demonstrated operating-cost and air-quality benefits of EV taxi fleets | +2.1% | Global | Medium term (2-4 years) |
Restraints
UITP policy briefs confirm that subsidies reducing EV purchase prices and fleet-conversion funds are labelled key success factors precisely because many taxi drivers cannot access affordable financing for battery-electric vehicles. In Europe, BEVs represent only about 2% of the total passenger-car fleet across the EU-27 plus Norway, with that share projected to reach roughly 3% in 2024 and about 5% by 2025. Rapid growth in new BEV sales produces slow overall fleet turnover because the ICE base is large. This gap between sales momentum and fleet penetration limits the pace at which EV taxis can replace conventional vehicles.
Individual taxi drivers face the steepest financing barriers because they cannot pool procurement costs the way company-operated fleets can. This asymmetry means the fastest-adopting operators are large fleet owners, leaving individually licensed drivers behind and slowing aggregate market conversion. Capital constraints subtract an estimated -4.2% from the otherwise strong baseline CAGR of 18.52%. Financing products designed specifically for taxi-operator credit profiles, rather than standard consumer auto loans, represent the most direct tool to close this adoption gap.
| Restraint | (~) % Impact on CAGR Forecast | Geographic Relevance | Impact Timeline |
|---|---|---|---|
| Upfront vehicle-cost and financing barriers for individual taxi drivers | -4.2% | Global (excluding India) | Short term (≤ 2 years) |
| Uneven BEV fleet penetration despite strong sales growth | -3.0% | Europe | Medium term (2-4 years) |
| Limited mandatory EV targets for corporate and taxi fleets | -2.4% | Europe, North America | Medium term (2-4 years) |
Challenges
Norway reported approximately 9,600 fast and ultra-fast chargers in 2024, serving a passenger EV fleet of about 794,000 BEVs. That ratio of roughly 87 BEVs per fast charger is manageable for private cars but creates access risk for taxis requiring predictable, high-frequency charging windows. Taxis operate at utilisation rates far above private vehicles, meaning charger queuing directly translates into lost revenue hours. This structural mismatch between charger supply and taxi-grade demand is the single largest infrastructure constraint facing the market today.
Simulation research on app-based taxi fleets shows that serving 100% of daily urban trip demand with BEVs requires approximately 23,000 vehicles at 200 km range supported by around 3,000 fast chargers rated at 50 kW in a single large-city scenario. Building that charger density into existing urban fabric requires years of permitting, grid upgrades, and capital deployment. This infrastructure timeline imposes a friction drag of roughly -3.5% on the EV Taxi Market’s maximum growth potential against the baseline CAGR of 18.52%, creating a sustained execution challenge for platform operators and city authorities alike.
| Challenge | (~) % CAGR Friction Drag | Geographic Relevance | Mitigation Horizon |
|---|---|---|---|
| Charging-infrastructure availability for high-utilisation taxi duty cycles | -3.5% | Global (excluding India) | Medium term (2-4 years) |
| Fleet-turnover dynamics slowing replacement of ICE taxis | -2.7% | Europe | Long term (≥ 4 years) |
| Operational integration of EVs into app-based taxi platforms | -2.2% | Global | Medium term (2-4 years) |
Opportunities
UITP policy guidance identifies low electricity costs, purchase subsidies, and privileged urban-zone access as critical electrification accelerants that most cities have not yet combined with dedicated taxi-only charging infrastructure. In January 2026, plug-in passenger-vehicle registrations across Europe reached approximately 298,000 units, with BEVs alone accounting for roughly 195,000 units and about 20% of all new passenger-car registrations. Local authorities that designate a share of this expanding BEV stock for professional passenger transport and pair it with reserved high-power chargers unlock a structurally distinct revenue channel for fleet operators.
Dedicated EV taxi charging hubs with prioritised access rights allow operators to fully exploit lower per-kilometre energy costs and reduced maintenance burdens, potentially expanding fleet margins by mid-single-digit percentages. Binding corporate and fleet EV targets from 2030 add a further +3.3% CAGR upside specifically for European markets. Combined with advanced fleet analytics and optimised dispatch systems, these opportunities add an estimated +4.0% upside to the baseline CAGR of 18.52% when implemented across major metropolitan areas within the next two to four years.
| Opportunity | (~) % Potential CAGR Upside | Geographic Relevance | Execution Window |
|---|---|---|---|
| Dedicated EV taxi charging hubs and prioritised access policies | +4.0% | Europe, North America, Asia (ex-India) | Medium term (2-4 years) |
| Binding corporate and fleet EV targets including taxi and ride-hailing | +3.3% | Europe | Medium term (2-4 years) |
| Advanced EV taxi-fleet analytics and optimised dispatch for cost savings | +2.5% | Global | Long term (≥ 4 years) |
Key Company Insights
BYD Company Limited holds a structural manufacturing advantage as the world’s highest-volume EV producer, giving taxi fleet operators access to purpose-built electric vehicles at price points that compress acquisition payback periods. Transport Environment data shows BEV uptake in large EU corporate fleets reached 14.3% of new registrations, only marginally above the 13.6% rate for private buyers. BYD’s volume scale positions it to close that gap by reducing per-unit cost below the threshold that triggers mass fleet conversion.
In May 2025, ANI Technologies Pvt. Ltd. (Ola) restructured its mobility operations to prioritise its consumer-facing electric two-wheeler division, scaling back internal EV taxi trials. This strategic pivot reduces Ola’s competitive footprint in the EV taxi segment precisely as that market accelerates. Research on EV satisfaction found that 80% of one leading EV brand’s owners fell in the promoter category, against an industry average of only 50%. Ola’s exit from EV taxi trials signals that high user satisfaction alone does not guarantee platform operator commitment when capital allocation priorities shift.
Key Players
- BYD Company Limited
- Didi Global Inc.
- Uber Technologies, Inc.
- Lyft, Inc.
- ANI Technologies Pvt. Ltd. (Ola)
- Tesla, Inc.
- Grab Holdings Limited
- BluSmart Mobility Pvt. Ltd.
- Xanh SM (GSM Green and Smart Mobility)
- Tata Motors Limited
Recent Developments
- April 2026: Tesla officially expanded its unsupervised autonomous ride-hailing network to Dallas and Houston, Texas, scaling its proprietary Robotaxi app beyond its original June 2025 limited pilot launch.
- January 2026: Didi Global Inc. began commercial delivery of its R2 Robotaxi model, a custom mass-produced Level 4 autonomous vehicle developed through Anditech, its joint venture with GAC Aion.
Geopolitical Impact Analysis
Data from the World Trade Organization shows that average applied tariff rates on electric vehicles and battery components between major trading blocs have risen materially since 2023, with the EU imposing additional duties of up to 38% on Chinese-manufactured BEVs and the US maintaining Section 301 tariffs of 100% on Chinese EVs. These measures directly increase the acquisition cost of the Chinese-manufactured vehicles that dominate EV taxi fleet procurement in Asia and are increasingly targeted at European and North American fleet buyers. This creates a structural pricing wedge that benefits domestic EV manufacturers but constrains the cost advantage that made fleet-scale electrification economically compelling for operators in import-dependent markets.
According to the World Shipping Council, average container freight rates on major Asia-to-Europe corridors remained elevated through 2025, running approximately 3 to 4 times pre-2020 baseline levels during peak disruption periods, driven by Red Sea rerouting that added an estimated 10 to 14 days to transit times. For EV taxi fleet operators sourcing vehicles and battery packs from Asian manufacturers, these logistics cost increases translate directly into higher per-vehicle landed costs and extended delivery windows that delay fleet deployment. Operators in Europe and North America who source domestically or from tariff-advantaged trade partners carry a structural logistics cost advantage that compounds over multi-year fleet procurement cycles.
Report Scope
| Report Features | Description |
|---|---|
| Market Value (2025) | USD 27.63 Billion |
| Forecast Revenue (2035) | USD 151.19 Billion |
| CAGR (2026-2035) | 18.52% |
| Base Year for Estimation | 2025 |
| Historic Period | 2020-2024 |
| Forecast Period | 2026-2035 |
| Report Coverage | Revenue Forecast, Market Dynamics, Market Opportunity Analysis, Technology and Innovation Landscape, Competitive Landscape, Recent Developments |
| Segments Covered | By Vehicle Type (Passenger Vehicles: Sedans, Hatchbacks, SUVs and MPVs; Commercial Vehicles: Electric Vans, Minibuses), By Propulsion Type (Battery Electric Vehicle, Plug-in Hybrid Electric Vehicle, Hybrid Electric Vehicle), By Service Model (Ride-Hailing: App-based Ride-Hailing, Corporate Ride-Hailing; Ride-Sharing; Airport and Tourism Shuttles), By Ownership Model (Fleet-Owned: Company-Operated Fleets, Franchise Fleets; Individually-Owned; Leasing and Subscription) |
| Regional Analysis | North America (US and Canada), Europe (Germany, France, The UK, Spain, Italy, and Rest of Europe), Asia Pacific (China, Japan, South Korea, India, Australia, and Rest of APAC), Latin America (Brazil, Mexico, and Rest of Latin America), Middle East and Africa (GCC, South Africa, and Rest of MEA) |
| Competitive Landscape | BYD Company Limited, Didi Global Inc., Uber Technologies, Inc., Lyft, Inc., ANI Technologies Pvt. Ltd. (Ola), Tesla, Inc., Grab Holdings Limited, BluSmart Mobility Pvt. Ltd., Xanh SM (GSM Green and Smart Mobility), Tata Motors Limited |
| Customization Scope | Customization for segments, region / country-level will be provided. Additional customization can be done based on requirements. |
| Purchase Options | We have three licenses to opt for: Single User License | Multi-User License (Up to 5 Users) | Corporate Use License (Unlimited User and Printable PDF) |





































