


Report Overview
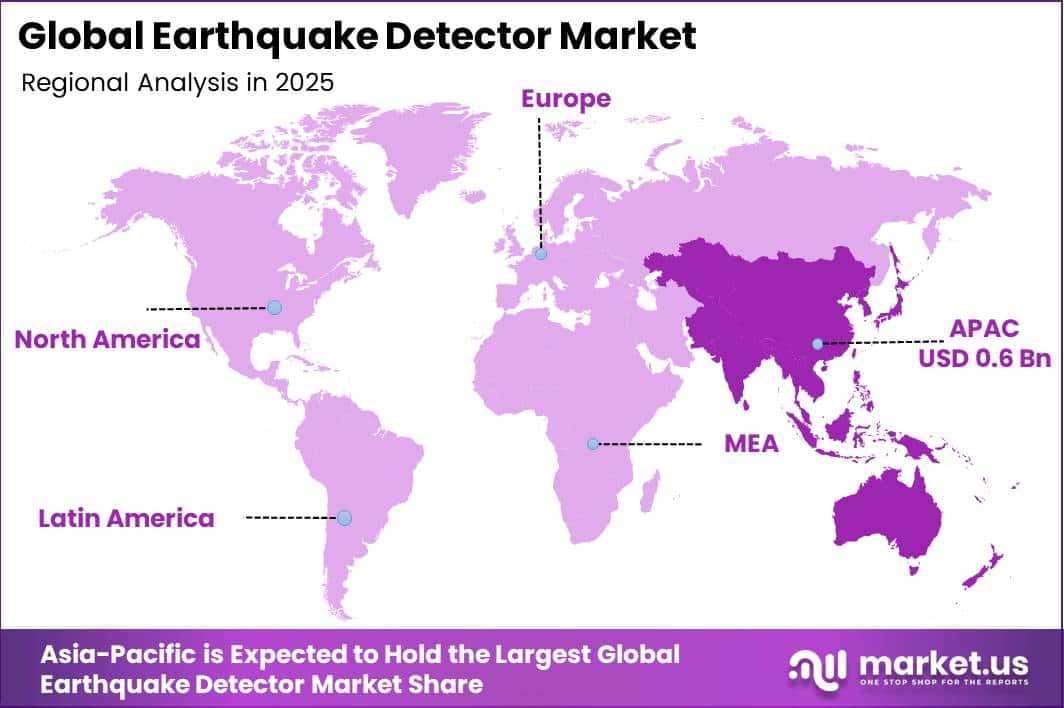
In 2025, the Global Earthquake Detector Market was valued at USD 1.4 billion. The market is projected to grow at a CAGR of 9.0% during 2026–2035, reaching approximately USD 3.4 billion by 2035. Asia-Pacific dominated the global market in 2025, accounting for more than 42.6% of the total market share and generating approximately USD 0.6 billion in revenue.
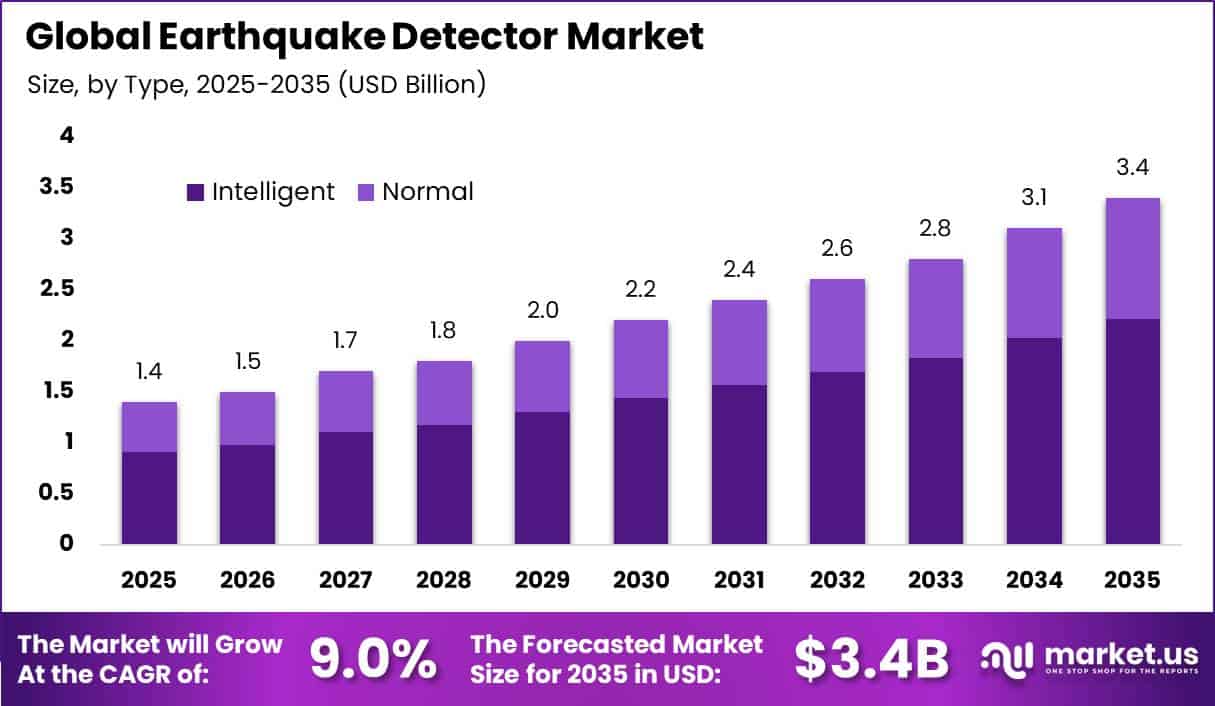
Growth is supported by rising investment from governments, utilities, transport operators, and industrial facilities in real-time seismic monitoring and earthquake early-warning systems. Earthquake detectors, including seismometers, accelerometers, strong-motion sensors, data loggers, and connected warning devices, help identify ground movement and issue alerts before severe shaking arrives.
The U.S. Geological Survey’s 2025 plan for Alaska proposes a 450-station early-warning network, including 270 new stations and upgrades to 160 existing stations. In Japan, the Japan Meteorological Agency operates around 300 seismometers, highlighting the need for large permanent monitoring networks in earthquake-prone countries.
Demand is also increasing across railways, power facilities, factories, hospitals, commercial buildings, and public-warning systems. More than 140 disasters affected Asia-Pacific in 2022, causing over 7,500 deaths, impacting more than 64 million people, and resulting in nearly USD 57 billion in economic losses.
Earthquakes alone caused about USD 12.1 billion in losses. Growing investment in metro systems, high-speed rail, ports, power grids, semiconductor plants, industrial facilities, and urban infrastructure is expected to increase demand for dense seismic networks, faster data transmission, automated alerts, and detector upgrades through 2035.
Key Takeaway
- Earthquake Detector Market valued at USD 1.4 billion in 2025, projected to reach USD 3.4 billion by 2035 at a 9.0% CAGR
- The intelligent segment dominates By Type with a 65.2% share
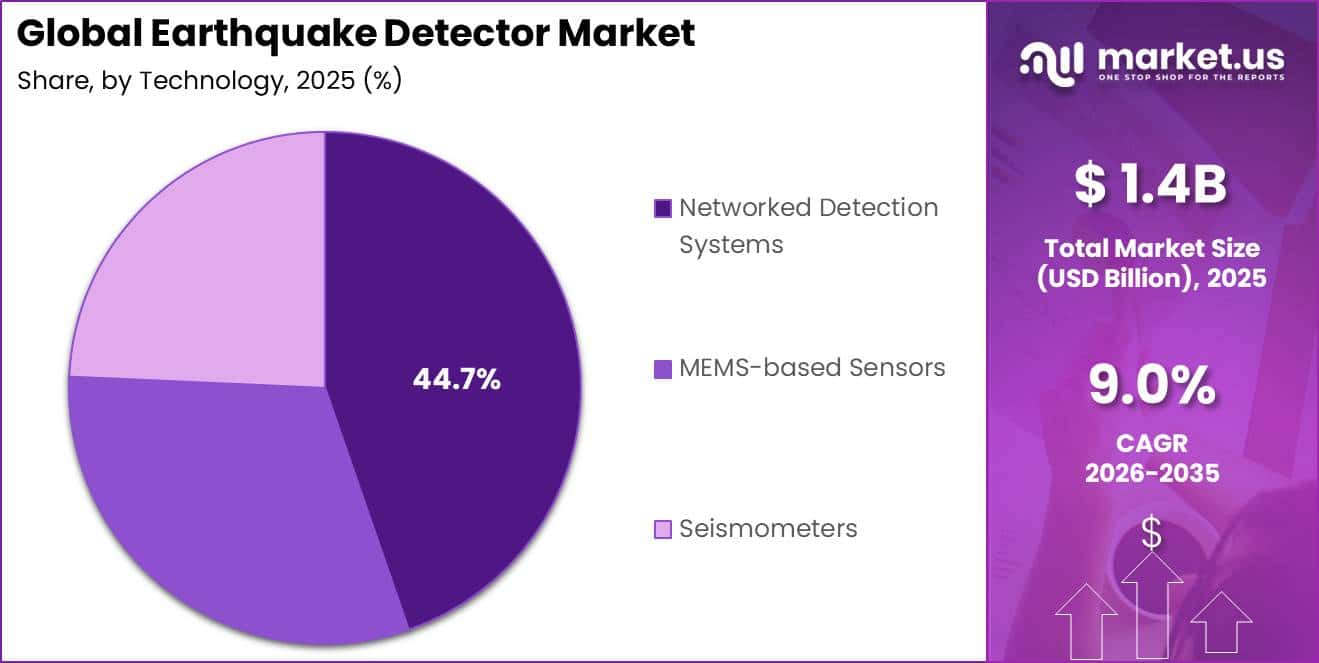
- Networked detection systems lead by Technology with a 44.7% share
- Industrial facilities lead By Application with a 30.8% share
- Governments lead by End-User with a 60.4% share
- Asia-Pacific led the market in 2025 with a 42.6% share, worth approximately USD 0.6 billion
Market Statistics and Data Insights
- The U.S. Geological Survey awarded more than $23 million for earthquake monitoring and applied research in 2025. This included more than $12.5 million for ShakeAlert, more than $6.5 million for Advanced National Seismic System regional networks, $4 million for external earthquake research, and $400,000 for geodetic networks. USGS reviewed more than 160 applications and selected 53 recipients.
- The official Alaska ShakeAlert Phase 1 plan calls for 450 real-time earthquake early-warning stations, including 270 new stations, 160 upgrades, and 20 existing EEW-ready stations. The proposed network covers areas containing around 90% of Alaska’s population.
- Building Alaska’s Phase 1 ShakeAlert network is estimated to require $65.8 million in capital spending, while the completed system would require approximately $12 million per year for operations and maintenance. These figures are stated in 2024 dollars in the official implementation plan.
- China’s National Earthquake Early Warning Project has installed 15,899 monitoring stations, along with 3 national centres, 31 provincial centres, 173 city-level information-release nodes, 196 station aggregation nodes, and 12,082 service terminals. Total project investment was CNY 1.87 billion.
- During China’s magnitude 6.8 Luding earthquake in 2022, the national system released warning information within 6.2 seconds and provided second-level warning coverage to around 1.5 million people near the epicentral region. This is an observed operational case rather than a forecast.
- Indonesia’s BMKG reported in November 2025 that its national earthquake early-warning prototype was using 228 optimized sensors, including accelerometers and intensity meters. Initial development covers 4 pilot areas: Jakarta, Banten, West Java, and Lampung.
- Japan’s N-net seafloor earthquake and tsunami monitoring system consists of 36 observation stations, divided into 2 subsystems with 18 stations each. Each observation point combines earthquake sensors and water-pressure gauges, with data transmitted through submarine fibre-optic cables.
- Japan’s wider offshore monitoring infrastructure includes 51 DONET stations. The Metropolitan Seismic Observation Network, MeSO-net, also contains around 300 stations placed approximately 2–5 km apart across the Tokyo metropolitan area.
- New Zealand’s GeoNet operates 1,000 monitoring instruments across nearly 700 locations. The Natural Hazards Commission contributes up to NZD 14 million each year to GeoNet, while its near-real-time data is used by emergency managers, insurers, government agencies, engineers, developers, scientists, and the public.
- Mexico’s SASMEX earthquake early-warning network operates 96 seismic sensors along its Pacific seismic-risk zone. The system has detected more than 13,070 earthquakes and generated 30,215 acceleration records. Its alerts currently benefit more than 25 million people across covered cities.
- A Japan Meteorological Agency survey covering 1,352 respondents affected by the Noto Peninsula earthquake found that 87.6% heard or saw the emergency earthquake warning for the major 16:10 earthquake. Among 1,185 people who received it, 72.2% received the warning through television, 63.1% through emergency mobile/email alerts, 28.0% through public broadcasting systems, and 23.0% through smartphone disaster apps.
- Among those 929 warning recipients, 61.2% received the alert through emergency mobile/email messages, 47.1% through television, 25.9% through smartphone disaster apps, 9.4% through social media, 6.9% through public broadcasting equipment, and 5.9% through radio.
By Type
The Intelligent segment dominates the Earthquake Detector Market with a 65.2% share, mainly because national agencies are moving from standalone sensors to connected systems that can automatically detect earthquakes, process data, and issue warnings.
Indonesia’s BMKG operates around 2,000 seismic sensors across the country, allowing authorities to generate real-time alerts and support faster disaster response, including during the recent Flores earthquake.
Mexico’s SASMEX network also shows the growing importance of automated earthquake detection. The system connects 97 accelerograph stations with control centres that process seismic signals and send alerts through radios, loudspeakers, and television within seconds. Since 1993, SASMEX has issued 158 early warnings after recording more than 6,896 earthquakes.
By Technology
Networked Detection Systems lead the Earthquake Detector Market with a 44.7% share, as earthquake early-warning systems depend on broad sensor coverage, continuous data transmission, and fast central processing. China’s National Earthquake Early Warning Project operates 15,391 early-warning stations, supported by 3 national centres, 31 provincial centres, and 173 prefecture-level alert-release centres.
During the 2022 Luding magnitude 6.8 earthquake, the system generated a warning within 6.2 seconds and provided second-level coverage to around 1.5 million people near the epicentre. India’s National Seismological Network increased from about 84 stations in 2014 to 168 operating observatories by mid-2025, effectively doubling its connected monitoring capacity.
Between January 2020 and June 2025, the network transmitted information on 80,029 earthquakes to authorities. In the United States, around 1,500 of the planned 1,675 ShakeAlert stations had been completed by the end of 2023. These systems also require telemetry, control-centre or cloud processing, backup communication, and public-alert interfaces.
By Application
The Industrial Facilities segment leads the Earthquake Detector Market with a 30.8% share, supported by the growing need to protect factories, energy sites, and process plants from seismic damage and operational shutdowns. Global industrial electricity consumption increased by nearly 4% in 2024 and accounted for almost 40% of total electricity-demand growth, showing the rising scale of industrial activity.
In China, industry contributed 48% of the country’s electricity-demand growth during 2022–2024. Manufacturing of solar modules, batteries, electric vehicles, and related materials consumed more than 300 TWh of electricity in 2024, close to Italy’s annual electricity use. These energy-intensive facilities depend on continuous operations, making earthquake-related equipment failure, power disruption, and production stoppages costly.
By End-User
The Government segment leads the Earthquake Detector Market with a 60.4% share, mainly because public agencies fund large national monitoring networks to protect communities, emergency services, and critical infrastructure. Governments typically purchase earthquake detection systems at scale and also finance installation, maintenance, data processing, and long-term operations.
The U.S. Geological Survey estimates that completing Phase 1 of the ShakeAlert expansion in Alaska will require around USD 65.8 million in capital investment, followed by nearly USD 12 million in annual operating and maintenance costs. In Indonesia, a World Bank-supported disaster-resilience program allocated USD 57.5 million to strengthen monitoring networks and early-warning capacity.
Under the program, 83 earthquake and tsunami sensors were installed, with another 148 units planned, along with 75 warning-receiver systems for local governments. New Zealand’s public GeoNet network operates around 1,000 instruments across nearly 700 locations and processes more than 11 billion data samples each day.
Key Market Segments
By Type
- Intelligent
- Normal
By Technology
- Networked Detection Systems
- MEMS-based Sensors
- Seismometers
By Application
- Industrial Facilities
- Apartment
- House
- Office Building
- Transportation Infrastructure
- Other
By End-User
- Governments
- Private Sector
- Research Institutions
Geopolitical Impact Analysis
Geopolitical disruptions are increasing the cost and delivery time of earthquake detectors because these systems depend on globally sourced components such as MEMS accelerometers, integrated circuits, printed circuit boards, GNSS modules, copper wiring, batteries, and communication hardware. Trade restrictions can raise input costs before final assembly.
The U.S. increased tariffs on Chinese semiconductors to 50% from January 2025, adding cost pressure for manufacturers sourcing sensor chips, processing boards, modems, and power-management components from Asian supply chains. Material prices are another concern. The World Bank expects its metals and minerals price index to increase by 17% in 2026, while copper, aluminium, and tin prices are each projected to rise by about 20%.
These materials are widely used in detector cabling, PCB traces, enclosures, solder, antennas, and power connections, directly increasing equipment production costs. Regional conflicts are also affecting logistics. Global seaborne trade reached 12.72 billion tonnes in 2024, while tonne-miles increased by 5.9% as Red Sea disruptions forced ships to use longer routes around the Cape of Good Hope.
By early May 2025, Red Sea transits remained around 70% below their 2023 average. Longer shipping routes increase freight, insurance, inventory, and working-capital costs for imported sensors, data loggers, radio modules, and spare parts. In response, earthquake-detector suppliers are expected to increase regional inventories, diversify component sourcing, expand local assembly, and strengthen local service networks.
Regional Analysis
Asia-Pacific led the global Earthquake Detector Market in 2025, accounting for 42.6% of total revenue and around USD 0.6 billion in market value. The region’s strong position is supported by high earthquake exposure, dense populations, expanding industrial activity, and government investment in seismic monitoring and public-warning systems.
This creates steady demand for seismometers, strong-motion sensors, communication equipment, data loggers, alert controllers, and maintenance services. Asia-Pacific also recorded 12.76 million disaster-related displacements in 2023, equal to 50% of the global total, further supporting investment in faster monitoring and warning systems.
North America is expected to be the fastest-growing regional market, driven by modernization of connected earthquake-warning networks. The U.S. Geological Survey’s Alaska ShakeAlert plan includes 450 real-time seismic stations, consisting of 270 new stations, 160 upgrades, and 20 existing early-warning-capable stations.
The project requires about USD 66 million in capital spending and nearly USD 12 million in annual operating and maintenance costs. The expanded network is designed to cover areas containing around 90% of Alaska’s population, supporting demand for detectors, communications, analytics, backup power, software, and servicing.
Key Regions and Countries
North America
- US
- Canada
Europe
- Germany
- France
- The UK
- Spain
- Italy
- Rest of Europe
Asia Pacific
- China
- Japan
- South Korea
- India
- Australia
- Rest of APAC
Latin America
- Brazil
- Mexico
- Rest of Latin America
Middle East & Africa
- GCC
- South Africa
- Rest of MEA
Market Dynamics
Drivers
| Driver | (~) % CAGR | Geographic Relevance | Impact Timeline |
|---|---|---|---|
| Federal early-warning legislation renewal | +2.1% | North America | Short term (2 years or less) |
| Metro and high-speed rail safety mandates | +1.6% | Asia-Pacific | Medium term (2 to 4 years) |
| Utility and grid automatic shutoff adoption | +1.4% | Global | Medium term (2 to 4 years) |
| Smartphone-integrated public alert rollout | +1.0% | North America, Asia-Pacific | Short term (2 years or less) |
| Insurance-linked risk mitigation incentives | +0.7% | Global | Medium term (2 to 4 years) |
Federal early-warning legislation renewal
The reauthorization of the National Earthquake Hazards Reduction Program through 2028, passed by the U.S. Senate in January 2026, supports more predictable multi-year funding across USGS, FEMA, NIST, and NSF. This improves procurement visibility for earthquake-detector suppliers and supports a shift from one-time equipment sales toward recurring operations and maintenance contracts.
USGS base ShakeAlert funding reached $28.6 million annually by fiscal year 2024, while another $34.9 million was allocated in 2026 for continued system expansion. The Alaska Phase 1 project alone requires about $65.8 million in capital spending and around $12 million per year for operations and maintenance. This long-term funding visibility can reduce procurement uncertainty and support stronger vendor planning for large seismic-network contracts.
Restraints
| Restraint | (~) % CAGR | Geographic Relevance | Impact Timeline |
|---|---|---|---|
| Municipal budget appropriation gaps | -1.5% | North America, Latin America | Short term (2 years or less) |
| High-precision sensor import restrictions | -1.1% | Asia-Pacific | Short term (2 years or less) |
| Elevated borrowing costs for public infrastructure | -0.8% | Global | Short term (2 years or less) |
| Data-sharing and privacy compliance barriers | -0.5% | Europe | Medium term (2 to 4 years) |
Municipal budget appropriation gaps
State and local funding gaps can delay earthquake-detector procurement because federal capital support often depends on non-federal contributions. Since 2006, state and local partners have contributed about $135.5 million, compared with $130.7 million in federal funding. California alone accounted for around $110.1 million, leaving smaller jurisdictions with much lower financial capacity.
The funding gap can slow new station installations when state budgets tighten. The FY 2025 USGS Natural Hazards Mission Area request totaled $210.6 million, while California’s earthquake early-warning program had an annual operating budget of only $17.086 million. As a result, vendors may face delayed purchase orders and longer sales cycles in mid-sized markets that lack dedicated co-funding programs, limiting near-term equipment shipments.
Challenges
| Challenge | (~) % CAGR | Geographic Relevance | Mitigation Horizon |
|---|---|---|---|
| Calibration and false-alert accuracy drag | -0.9% | Global | Medium term (2 to 4 years) |
| Remote-station maintenance logistics | -0.7% | North America, Asia-Pacific | Long term (4 years or more) |
| Skilled seismic technician shortage | -0.6% | Global | Long term (4 years or more) |
| Legacy network interoperability gaps | -0.4% | Europe, Latin America | Medium term (2 to 4 years) |
| Multi-agency data standardization friction | -0.3% | Global | Long term (4 years or more) |
Calibration and false-alert accuracy drag
Maintaining alert accuracy across remote seismic and geodetic stations creates ongoing operating costs rather than a one-time expense. The USGS Alaska technical plan allocates $2.18 million in capital and $1.36 million annually for R&D focused on improving earthquake-alert reliability, separate from basic sensor deployment costs.
Co-locating GNSS and seismic stations can reduce infrastructure expenses, but it still requires about $2.99 million in geodetic capital and $660,000 annually for operations. These recurring costs reflect the need for software recalibration, equipment checks, and field maintenance to limit false alerts and missed detections. Over time, vendors and public agencies will need more automated diagnostic tools to reduce maintenance costs per station and protect operating margins.
Opportunities
| Opportunity | (~) % CAGR | Geographic Relevance | Execution Window |
|---|---|---|---|
| Subscription-based data-as-a-service monetization | +2.0% | Global | Medium term (2 to 4 years) |
| Underserved secondary-city network buildout | +1.3% | Latin America, Southeast Asia | Long term (4 years or more) |
| Cross-hazard sensor bundling (tsunami, landslide) | +1.1% | Asia-Pacific | Medium term (2 to 4 years) |
| Private industrial-facility retrofit contracts | +0.9% | North America, Europe | Medium term (2 to 4 years) |
| AI-driven predictive maintenance licensing | +0.6% | Global | Long term (4 years or more) |
Subscription-based data-as-a-service monetization
This opportunity remains largely untapped because current federal and state contracts are mainly structured around one-time equipment purchases and O&M spending rather than recurring data-licensing models. USGS appropriations include annual base and capital funding of about $28.6 million and $31.1 million, respectively, while roughly $23 million in annual USGS research grants was reported in May 2025.
This shift could improve margins by moving revenue from hardware sales toward lower-cost software and data services. The opportunity remains outside current grant structures, while the NEHRP reauthorization carries an estimated $596 million cost over 5 years. As a result, recurring seismic-data monetization represents a clear white-space opportunity, although growth will depend on regulatory clarity around public seismic-data resale and commercial access rights.
Key Players Analysis
The Earthquake Detector Market remains fragmented, as no supplier reports a pure-play market share. Based on product reach, seismic expertise, industrial automation capability, and public-infrastructure presence, Tier-1 companies such as Azbil, Omron, Sercel, Güralp, REF TEK, Tokyo Sokushin, and Meisei Electric are estimated to hold a combined 45–55% share.
Azbil reported FY2025 revenue of JPY 298.9 billion, including JPY 109.8 billion from Advanced Automation. The company also invested JPY 12.7 billion in R&D and JPY 9.8 billion in capital expenditure. Omron generated FY2025 net revenue of JPY 767.4 billion and spent JPY 44.3 billion on R&D, supporting connected sensing, factory automation, safety control, and automated shutdown technologies.
Tier-2 companies, including Colibrys, DJB Instruments, Dytran Instruments, GEObit Instruments, Dynamic Technologies, JDS Products, Ubukata Industries, QMI Manufacturing, Beeper, Dai-ichi Seiko, and Senba Denki Kazai, are estimated to account for around 25–35% collectively. These companies mainly compete through specialized accelerometers, vibration sensors, data-acquisition systems, alert devices, and local installation services.
Competition is focused on detection accuracy, low-latency communication, system interoperability, harsh-environment reliability, and lifecycle support. Azbil’s FY2026 plan includes JPY 11.7 billion in capital investment and JPY 13.8 billion in R&D, while Omron continues to prioritize investment in key devices and automation technologies.
Top Key Players in the Market
- Dai-ichi Seiko
- JDS Products
- Azbil
- Ubukata Industries
- Colibrys
- DJB Instruments
- Dytran Instruments
- REF TEK
- Tokyo Sokushin
- GEObit Instruments
- Dynamic Technologies
- Sercel
- Güralp
- Omron
- QMI Manufacturing
- Beeper
- Meisei Electric
- Senba Denki Kazai
Recent Developments
- In 2026, OMRON’s Device & Module Solutions business announced the relocation and expansion of its Malaysian manufacturing facility in Selangor. The new plant is planned to increase production capacity to 1.5 times the current level and represent more than 10% of the business’s global production capacity.
- Total investment is expected to reach approximately JPY 10 billion, while the relocated company will have stated capital of MYR 110 million, equivalent to around JPY 4.0 billion. Construction is scheduled to begin in October 2026, with production expected to start by the end of 2027.
- In 2025, Güralp supported the continued expansion of the OhioSeis earthquake-monitoring network in the United States. The network has deployed 9 Güralp 40T sensors and 10 Certis sensors, with another 4 Certis stations planned during 2025.
- The upgraded network is designed to detect earthquakes as small as magnitude 1. OhioSeis also reported 93% network data availability in 2023, compared with its target of 80%, supporting the reliability of connected seismic monitoring systems.
Report Scope
| Report Features | Description |
|---|---|
| Market Value (2025) | USD 1.4 Billion |
| Forecast Revenue (2035) | USD 3.4 Billion |
| CAGR (2026-2035) | 9.0% |
| Base Year for Estimation | 2025 |
| Historic Period | 2020-2024 |
| Forecast Period | 2026-2035 |
| Report Coverage | Revenue Forecast, Market Dynamics, Competitive Landscape, Recent Developments |
| Segments Covered | By Type – (Intelligent, Normal); By Technology – (Networked Detection Systems, MEMS-based Sensors, Seismometers); By Application – (Industrial Facilities, Apartment, House, Office Building, Transportation Infrastructure, Other); By End-User – (Governments, Private Sector, Research Institutions) |
| Regional Analysis | North America – US, Canada; Europe – Germany, France, The UK, Spain, Italy, Rest of Europe; Asia Pacific – China, Japan, South Korea, India, Australia, Singapore, Rest of APAC; Latin America – Brazil, Mexico, Rest of Latin America; Middle East & Africa – GCC, South Africa, Rest of MEA |
| Competitive Landscape | Azbil, Omron, Sercel, Güralp, REF TEK, Tokyo Sokushin, Meisei Electric, Colibrys, DJB Instruments, Dytran Instruments, GEObit Instruments, Dynamic Technologies, JDS Products, Ubukata Industries, QMI Manufacturing, Beeper, Dai-ichi Seiko, Senba Denki Kazai |
| Customization Scope | Customization for segments, region/country-level will be provided. Moreover, additional customization can be done based on the requirements. |
| Purchase Options | We have three licenses to opt for: Single User License, Multi-User License (Up to 5 Users), Corporate Use License (Unlimited Users and Printable PDF) |





































