


Report Overview
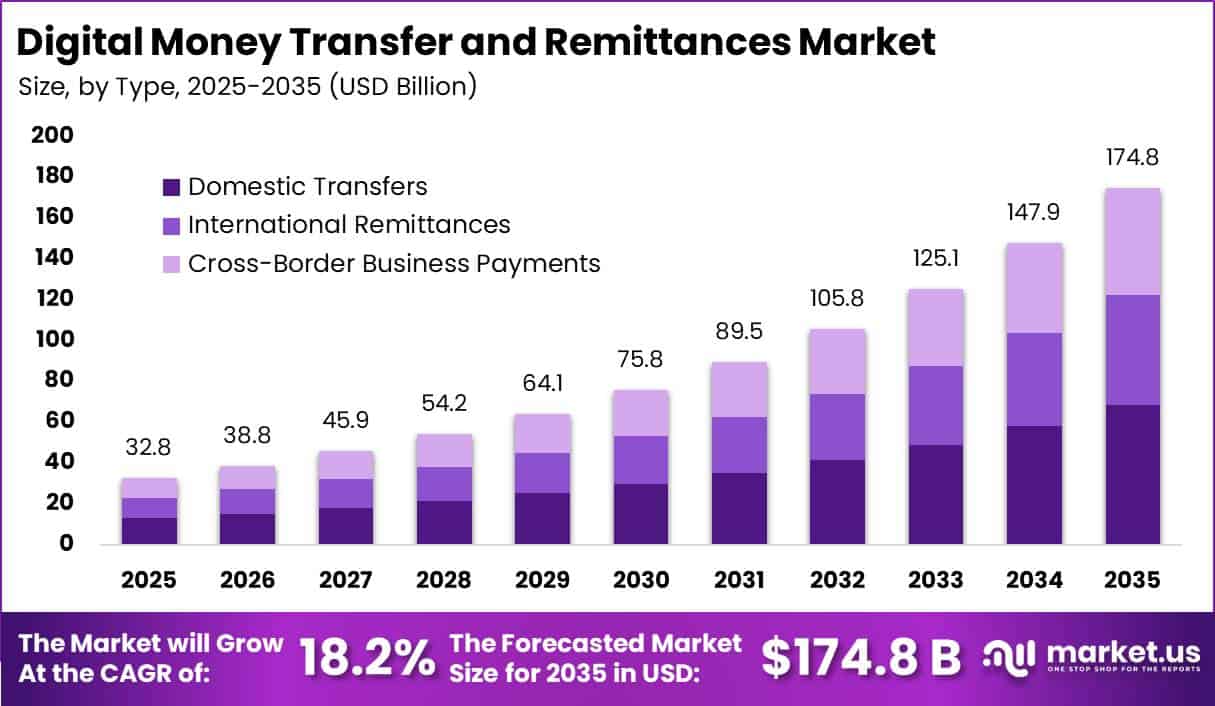
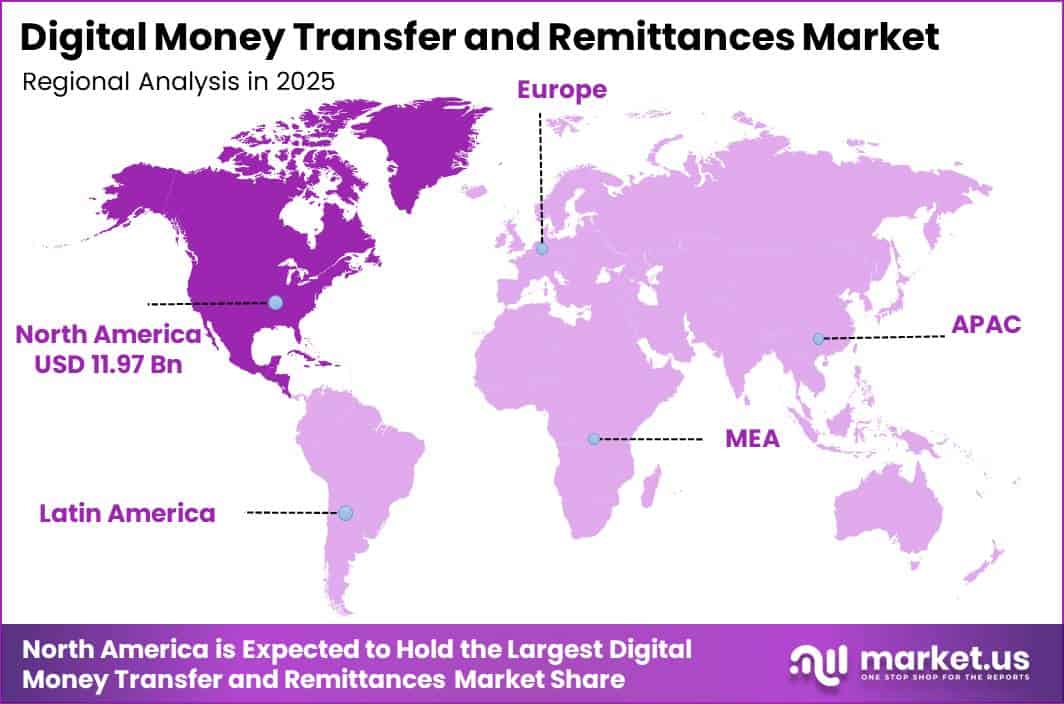
In 2025, the Global Digital Money Transfer And Remittances Market was valued at USD 32.8 billion. The market is projected to grow at a CAGR of 18.2% during 2026–2035, reaching approximately USD 174.8 billion by 2035. North America dominated the global market in 2025, accounting for more than 36.5% of the total market share and generating approximately USD 11.9 billion in revenue.
This growth is supported by rising global remittance flows and the wider use of digital payment channels. According to the World Bank, officially recorded remittances to low- and middle-income countries are projected to reach USD 685 billion in 2024, compared with USD 465 billion in 2017. This represents a 47% increase over seven years and 5.8% growth in 2024.
Total worldwide remittance flows are expected to reach USD 905 billion, while remittances have grown 57% as foreign direct investment declined 41%. These trends are encouraging users to shift from cash and informal transfers to mobile apps, digital wallets, and API-based platforms.
North America leads, supported by strong outbound remittance activity and high digital payment adoption. High-income countries generated USD 219 billion in remittance outflows in 2024, while foreign-born employment in the United States remained 11% above pre-pandemic levels. World Bank Findex data also show that adults making digital merchant payments increased from 35% in 2021 to 42% in 2024.
Key Takeaway
- The Digital Money Transfer And Remittances Market is expected to grow from USD 32.8 billion in 2025 to USD 174.8 billion by 2035, at a CAGR of 18.2%.
- International remittances led the market with a 39.2% share, driven by frequent cross-border money transfers.
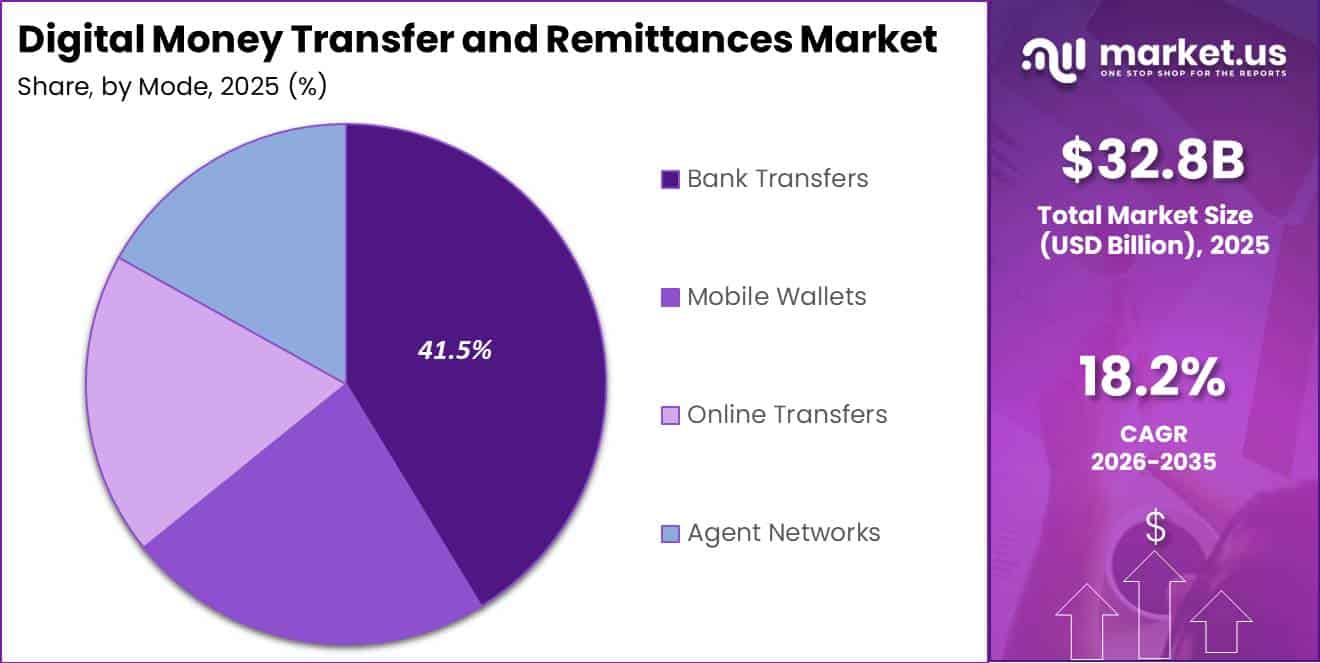
- Bank transfers accounted for a leading 41.5% share, supported by their reliability and integration with formal financial systems.
- Personal remittances captured a dominant 47.5% share, mainly due to regular household support payments.
- North America dominated the market with a 36.5% share and generated approximately USD 11.9 billion in revenue in 2025.
By Type
International remittances held a leading 39.2% share of the Digital Money Transfer And Remittances market, supported by the large and recurring movement of money across international borders. According to the World Bank, remittance flows to low- and middle-income countries are expected to reach USD 685 billion in 2024, while worldwide flows are projected at USD 905 billion.
South Asia is forecast to receive USD 207 billion, followed by Latin America and the Caribbean with USD 163 billion. India, Mexico, China, the Philippines, and Pakistan together receive more than USD 278 billion, showing the strong dependence of migrant households on regular cross-border transfers. Cost savings are also accelerating the shift toward digital platforms. Sending USD 200 through traditional channels costs an average of 6.4%, compared with 5% through digital remittance services.
This lower cost encourages users to adopt mobile applications and online transfer platforms. At the same time, banks and money transfer operators are digitising identity verification, foreign exchange, compliance, and Know Your Customer processes. These improvements make international transfers faster, more secure, and easier to track, while moving transactions away from cash-based and informal channels. Together, high transfer volumes and lower digital costs reinforce the segment’s 39.2% market leadership.
By Mode
Bank transfers held a leading 41.5% share of the Digital Money Transfer And Remittances market because they remain the main channel for moving money through formal financial systems. According to the Global Findex database, 76% of adults worldwide had an account with a bank or regulated financial institution in 2021, representing approximately 3.9 billion people, compared with 51% in 2011.
This broad account ownership means that salaries, government payments, business income, and household funds are commonly received through bank accounts, making bank-to-bank transfers a preferred option for domestic and international remittances.
The Federal Reserve’s FRED database also indicates that foreign-born employment in the United States exceeded 29 million workers by mid-2026. This large migrant workforce supports regular transfers from bank deposits to recipients in their home countries. Bank transfers also combine foreign exchange conversion, identity verification, compliance checks, and deposit security within one regulated process.
By Application
Personal remittances held a leading 47.5% share of the Digital Money Transfer And Remittances market because most cross-border transfers are made to support household expenses. According to the Migration Policy Institute, international migrants sent USD 656 billion to low- and middle-income countries in 2023.
These inflows represented more than 10% of GDP in several economies, including Guatemala at 19.1%, Nepal at 33.1%, and Pakistan at 9.4%. Families mainly use this money for food, housing, education, and healthcare rather than business-related payments. During 2023–2024, India received approximately USD 137.7 billion in remittances, followed by Mexico with USD 67.6 billion and the Philippines with USD 40.3 billion.
These figures represent tens of millions of recurring personal transactions that are well suited to mobile applications and low-cost digital platforms. Migrant workers commonly send USD 200–300 each month from their wages to support relatives at home. As migration and urban employment increase, these regular transfers provide stable transaction volumes.
Key Market Segments
By Type
- Domestic Transfers
- International Remittances
- Cross-Border Business Payments
By Mode
- Online Transfers
- Mobile Wallets
- Bank Transfers
- Agent Networks
By Application
- Personal Remittances
- Business Payments
- Government Transfers
- Retail Purchases
Geopolitical Impact Analysis
Geopolitical tensions are increasing the operating and infrastructure costs of digital money transfer and remittance providers. According to the International Energy Agency, data centres consumed about 415 TWh of electricity in 2024, equal to nearly 1.5% of global electricity demand. Their power consumption is projected to rise by 15% annually between 2024 and 2030, more than 4 times faster than overall electricity demand.
Regional conflicts and energy supply restrictions can cause wholesale electricity prices to fluctuate by 10–20%, directly raising costs for cloud platforms, payment processors, card networks, and bank transfer systems. UNCTAD also reported that digitally deliverable services trade reached USD 4.2 trillion in 2023 and represented more than half of global services exports.
This growing dependence on cross-border digital infrastructure exposes remittance companies to sanctions, data-localisation rules, cybersecurity requirements, and licensing restrictions that can add several percentage points to compliance and hosting expenses.
Security disruptions are also affecting the supply of payment terminals, cards, and networking equipment. OECD and ITF analysis found that average container ship delays increased from 5.1 days in November 2023 to 6.0 days in January 2024. Red Sea diversions also extended some shipping routes from 30 days to more than 40 days around the Cape of Good Hope, adding over 10 days to delivery schedules.
Longer transit times and higher fuel costs increase the landed price of POS terminals and connectivity equipment used by remittance agents. Consequently, providers may increase transaction fees, delay branch expansion, or prioritise digital-only transfer corridors.
Regional Analysis
North America Leads While Asia Pacific Expands Rapidly
North America held a dominant 36.5% share of the global Digital Money Transfer And Remittances market in 2025, representing approximately USD 11.9 billion in revenue. This leadership is supported by high financial inclusion, widespread mobile and online banking adoption, and strong outward remittance flows from the United States and Canada.
The region has a large migrant workforce, high disposable incomes, and frequent transfers to recipients across Latin America and Asia. These factors generate steady demand for bank transfers, digital wallets, and mobile remittance applications. North America also benefits from mature card networks, established digital identity systems, and a broad presence of regulated money transfer operators.
Asia Pacific is expected to record the fastest growth due to its position as a major remittance-receiving region and an important source of migrant labour. Increasing smartphone usage, wider internet access, real-time payment systems, and interoperable QR networks are encouraging consumers to move from cash-based agents to digital channels.
Strong remittance inflows into India, the Philippines, Bangladesh, and Vietnam, together with rising intra-regional migration, are increasing demand for affordable cross-border payment services. As providers introduce local-language applications, lower transaction fees, and connect with domestic instant-payment systems, Asia Pacific is expected to gain a larger share of the global market.
Key Regions and Countries
North America
- US
- Canada
Europe
- Germany
- France
- The UK
- Spain
- Italy
- Rest of Europe
Asia Pacific
- China
- Japan
- South Korea
- India
- Australia
- Rest of APAC
Latin America
- Brazil
- Mexico
- Rest of Latin America
Middle East & Africa
- GCC
- South Africa
- Rest of MEA
Market Dynamics
Drivers
| Driver | (~) % CAGR | Geographic Relevance | Impact Timeline |
|---|---|---|---|
| EU Instant Payments Regulation compliance rollout | +3.1% | Europe | Short term (2 years or less) |
| Rising formal remittance corridor volumes | +2.6% | Global, South Asia, MENA | Short term (2 years or less) |
| Smartphone-led digital wallet penetration | +2.4% | Asia Pacific, Sub-Saharan Africa | Medium term (2 to 4 years) |
| Bank-fintech API integration for cross-border rails | +1.9% | North America, Europe | Short term (2 years or less) |
| Federal Reserve rate-cut cycle easing dollar funding costs | +1.2% | North America, Latin America | Short term (2 years or less) |
| Migration-driven outbound worker remittance base | +1.5% | Gulf Cooperation Council, North America | Medium term (2 to 4 years) |
EU Instant Payments Regulation compliance rollout
The main cause is the European Central Bank’s binding Instant Payments Regulation. Euro-area banks were required to receive instant credit transfers by 9 January 2025 and send them by 9 October 2025, forcing thousands of payment service providers to upgrade their infrastructure quickly.
The regulation reduces settlement time from multi-day processing to under 10 seconds, limiting float income from delayed payments and encouraging volume-based or subscription-style fee models.
Banks have reportedly allocated an additional 15% to 20% of their annual payment-technology budgets to meet these requirements. Meanwhile, customer acquisition costs for digital remittance providers may decline by 8% to 12%, as faster settlement reduces transaction abandonment caused by long waiting periods. This shift was already developing during the 2 years before the 2026 baseline, supported by the expansion of PSD2 open-banking APIs across 27 EU member states.
Restraints
| Restraint | (~) % CAGR | Geographic Relevance | Impact Timeline |
|---|---|---|---|
| Tightened capital controls on outbound remittance limits | -2.8% | South Asia, select emerging markets | Short term (2 years or less) |
| Elevated correspondent-banking de-risking exits | -1.7% | Sub-Saharan Africa, Caribbean | Short term (2 years or less) |
| FATF-aligned enhanced due diligence cost burden | -1.3% | Global | Short term (2 years or less) |
| Sanctions-driven corridor freezes | -0.9% | Eastern Europe, Middle East | Short term (2 years or less) |
Tightened capital controls on outbound remittance limits
The main constraint comes from regulatory limits under India’s Liberalised Remittance Scheme. The Reserve Bank of India maintains an annual outward remittance cap of USD 250,000 per resident individual, while a 20% tax collected at source applies to eligible non-education and non-medical remittances above INR 700,000. These measures restrict discretionary outbound transfers and may reduce average ticket sizes by an estimated 10% to 14% as users split payments or move toward informal channels.
Smaller and fragmented transfers increase fixed processing costs and weaken the take-rate economics of digital remittance providers. Companies must also add real-time tax-withholding calculations and corridor-specific compliance systems to their platforms. This requirement may increase engineering overhead by approximately 3% to 5% per transaction corridor, while profit margins on affected transfers could decline by a similar level.
Challenges
| Challenge | (~) % CAGR | Geographic Relevance | Mitigation Horizon |
|---|---|---|---|
| Fragmented AML compliance talent shortage | -1.4% | Global | Medium term (2 to 4 years) |
| Legacy core-banking interoperability gaps | -1.1% | North America, Europe | Medium term (2 to 4 years) |
| FX rate volatility eroding margin predictability | -1.0% | Global, emerging markets | Short term (2 years or less) |
| Last-mile cash payout infrastructure gaps | -0.8% | Sub-Saharan Africa, rural Asia Pacific | Long term (4 years or more) |
| Cybersecurity and fraud-detection scaling burden | -0.7% | Global | Medium term (2 to 4 years) |
Fragmented AML compliance talent shortage
The structural vulnerability comes from a continuing shortage of skilled compliance professionals. Updated Financial Action Task Force guidance has expanded due-diligence requirements, while payments firms face an estimated shortage of 20,000 to 25,000 qualified transaction-monitoring analysts worldwide. This workforce gap increases operational pressure and slows the review of flagged transactions.
Average case-review backlogs can extend by 15 to 20 days for each flagged transaction batch. High false-positive alert volumes also consume an estimated 25% to 30% of compliance department operating budgets. To address this challenge, providers must invest in machine-learning screening tools and stronger cross-border data-sharing systems, or rising compliance costs may continue to limit long-term margin growth.
Opportunities
| Opportunity | (~) % CAGR | Geographic Relevance | Execution Window |
|---|---|---|---|
| Embedded remittance APIs within super-app ecosystems | +2.2% | Asia Pacific, Middle East | Medium term (2 to 4 years) |
| SMB cross-border payables adjacent expansion | +1.8% | North America, Europe | Medium term (2 to 4 years) |
| Stablecoin-settlement rail pilots for wholesale corridors | +1.5% | Global | Long term (4 years or more) |
| Unbanked-to-digital-wallet conversion in frontier markets | +1.6% | Sub-Saharan Africa, South Asia | Long term (4 years or more) |
| M&A roll-up of regional money transfer operators | +1.1% | Latin America, Caribbean | Medium term (2 to 4 years) |
Embedded remittance APIs within super-app ecosystems
This remains an untapped market opportunity because embedding remittance services into non-financial super-apps, ride-hailing, e-commerce, and social platforms has not yet been implemented at scale. Unlike established bank-fintech API integrations, super-app distribution could reduce customer acquisition costs by an estimated 30% to 40% by using existing users and pre-verified identity data.
Cross-selling remittance services to platforms with hundreds of millions of monthly active users could create a low-cost distribution channel without major additional marketing spending. Shared technology and payment infrastructure may also improve gross margins by 4 to 6 percentage points once transaction volumes reach sufficient scale, while serving mobile-first users who currently need a separate application for international transfers.
Key Players Analysis
Tier-1 companies in the Digital Money Transfer and Remittances market include Western Union, Euronet Worldwide, MoneyGram, Wise, PayPal, and Remitly. Western Union generated USD 4.2 billion in revenue in 2024, including USD 3.8 billion from consumer money transfers, representing about 90% of total revenue.
Euronet Worldwide’s Ria and Xe money transfer operations recorded USD 1.6 billion in revenue and USD 201 million in operating income, contributing nearly 42% of group revenue. Remitly reported USD 1.2 billion in 2024 revenue and projected USD 1.94–1.96 billion for 2025, indicating around 19–20% annual growth.
Wise generated approximately GBP 1.05 billion, or USD 1.3 billion, in FY24 income and processed more than GBP 118 billion in transfers. Together, Tier-1 providers are estimated to control 45–55% of global digital remittance revenue. Western Union holds a high-single-digit to low-teens share, while other major providers generally hold low-single-digit shares.
Tier-2 companies, including TransferGo, Instarem, OrbitRemit, TNG Wallet, and VayuPay, mainly target specific migrant corridors. These firms typically generate less than USD 200 million annually but often achieve double-digit transaction growth. They compete through lower fees, faster payments, simple applications, and partnerships with banks, wallets, and card networks.
Top Key Players in the Market
- Western Union Holdings Inc.
- Euronet Worldwide Inc.
- Ria Financial Services
- PayPal
- TransferWise
- OrbitRemit Limited
- MoneyGram
- Remitly
- VayuPay
- TransferGo
- Instarem
- Tng Wallet
Recent Developments
- In 2026, Wise reported that its payment infrastructure served 19 million consumers and businesses worldwide. The company processed USD 243 billion in cross-border transactions, reflecting 31% annual growth. Net revenue increased by 19% to USD 2.5 billion, supported by higher customer activity and wider use of its international payment accounts. Wise also reported that 75% of fourth-quarter transfers were completed within 20 seconds.
- In 2025, Western Union agreed to acquire International Money Express in an all-cash transaction valued at approximately USD 500 million. The acquisition is expected to add 6 million Intermex customers to Western Union’s existing remittance network. It will also strengthen the company’s position across important Latin American and Caribbean money transfer corridors. Western Union expects the transaction to generate around USD 30 million in annual cost synergies within 24 months. The deal supports its strategy of expanding transaction volumes, customer reach, and operating efficiency.
- In 2025, Euronet Worldwide’s Ria and Xe brands announced a collaboration with Google to improve access to international money transfer services. Their combined infrastructure connected with 3.2 billion mobile-wallet accounts and 4 billion bank accounts. The network also included 624,000 physical locations across nearly 200 countries and territories.
Report Scope
| Report Features | Description |
|---|---|
| Market Value (2025) | USD 32.8 Billion |
| Forecast Revenue (2035) | USD 174.8 Billion |
| CAGR (2026-2035) | 18.2% |
| Base Year for Estimation | 2025 |
| Historic Period | 2020-2024 |
| Forecast Period | 2026-2035 |
| Report Coverage | Revenue Forecast, Market Dynamics, Competitive Landscape, Recent Developments |
| Segments Covered | By Type (Domestic Transfers, International Remittances, Cross-Border Business Payments); By Mode (Online Transfers, Mobile Wallets, Bank Transfers, Agent Networks); By Application (Personal Remittances, Business Payments, Government Transfers, Retail Purchases) |
| Regional Analysis | North America – US, Canada; Europe – Germany, France, The UK, Spain, Italy, Rest of Europe; Asia Pacific – China, Japan, South Korea, India, Australia, Singapore, Rest of APAC; Latin America – Brazil, Mexico, Rest of Latin America; Middle East & Africa – GCC, South Africa, Rest of MEA |
| Competitive Landscape | Western Union Holdings Inc., Euronet Worldwide Inc., Ria Financial Services, PayPal, TransferWise, OrbitRemit Limited, MoneyGram, Remitly, VayuPay, TransferGo, Instarem, Tng Wallet |
| Customization Scope | Customization for segments, region/country-level will be provided. Moreover, additional customization can be done based on the requirements. |
| Purchase Options | We have three licenses to opt for: Single User License, Multi-User License (Up to 5 Users), Corporate Use License (Unlimited Users and Printable PDF) |





























