


Market Overview
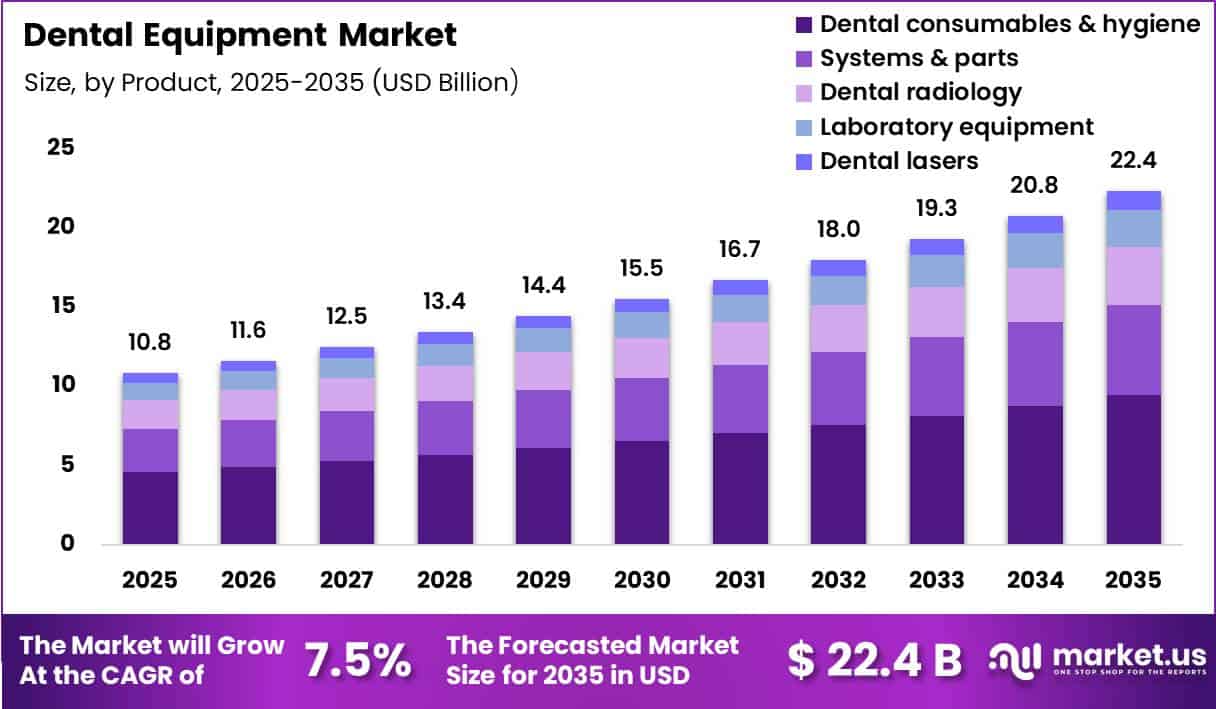
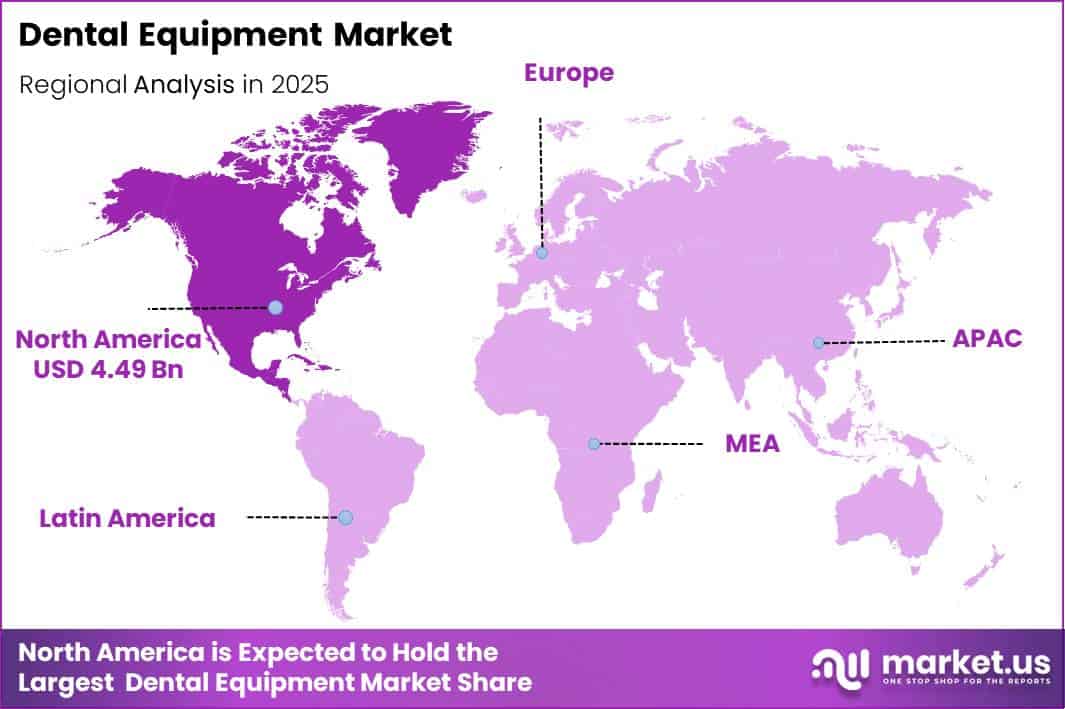
The Global Dental Equipment Market size is expected to be worth around US$ 22.4 Billion by 2035 from US$ 10.8 Billion in 2025, growing at a CAGR of 7.5% during the forecast period from 2026 to 2035. In 2025, North America led the market, achieving over 41.5% share with a revenue of US$ 4.49 Billion.
The global dental equipment market is witnessing steady expansion driven by the rising burden of oral diseases, increasing demand for preventive dental care, and rapid adoption of advanced clinical technologies.
Dental equipment includes dental imaging systems, dental chairs, handpieces, sterilization equipment, CAD/CAM systems, lasers, diagnostic devices, and laboratory equipment used for diagnosis, treatment, restoration, and oral surgery procedures.
The growing need for efficient dental services is supported by the increasing prevalence of oral health conditions worldwide, with the World Health Organization (WHO) estimating that oral diseases affect nearly 3.7 billion people globally, making dental care infrastructure and equipment essential components of healthcare systems.
Technological advancements are transforming dental practices through digital dentistry solutions, including 3D imaging, intraoral scanners, artificial intelligence-assisted diagnostics, and computer-aided manufacturing technologies.
These innovations enable faster diagnosis, improved treatment accuracy, and enhanced patient outcomes. Rising awareness regarding early detection and preventive treatment is also encouraging dental clinics and hospitals to upgrade equipment capabilities.
The market is further supported by the increasing demand for restorative and cosmetic dentistry procedures, ageing populations, and expansion of dental services in emerging healthcare systems.
Untreated dental caries remains a major global concern, affecting approximately 2.5 billion people, while severe gum disease impacts around 1 billion individuals worldwide, creating significant demand for advanced dental diagnostic and treatment equipment.
Government initiatives promoting oral health integration, infection control standards, and improved access to dental services are expected to encourage investments in modern dental infrastructure.
The continued shift toward digital workflows, minimally invasive procedures, and patient-centred dental care is positioning dental equipment as a critical segment within global healthcare technology
Key Takeaways
- Market Size: The Global Dental Equipment Market size was US$ 10.8 Billion in 2025. The market is estimated to grow to US$ 22.4 Billion by 2035.
- Market Share: The Compound Annual Growth Rate (CAGR) of the market from 2026 to 2035 will be 7.5%.
- Product: Dental Consumables & Hygiene has the largest market share, accounting for 42.2% of total product segment revenue.
- End User: Dental Hospitals lead the segment, accounting for 61.2% of total end-user revenue.
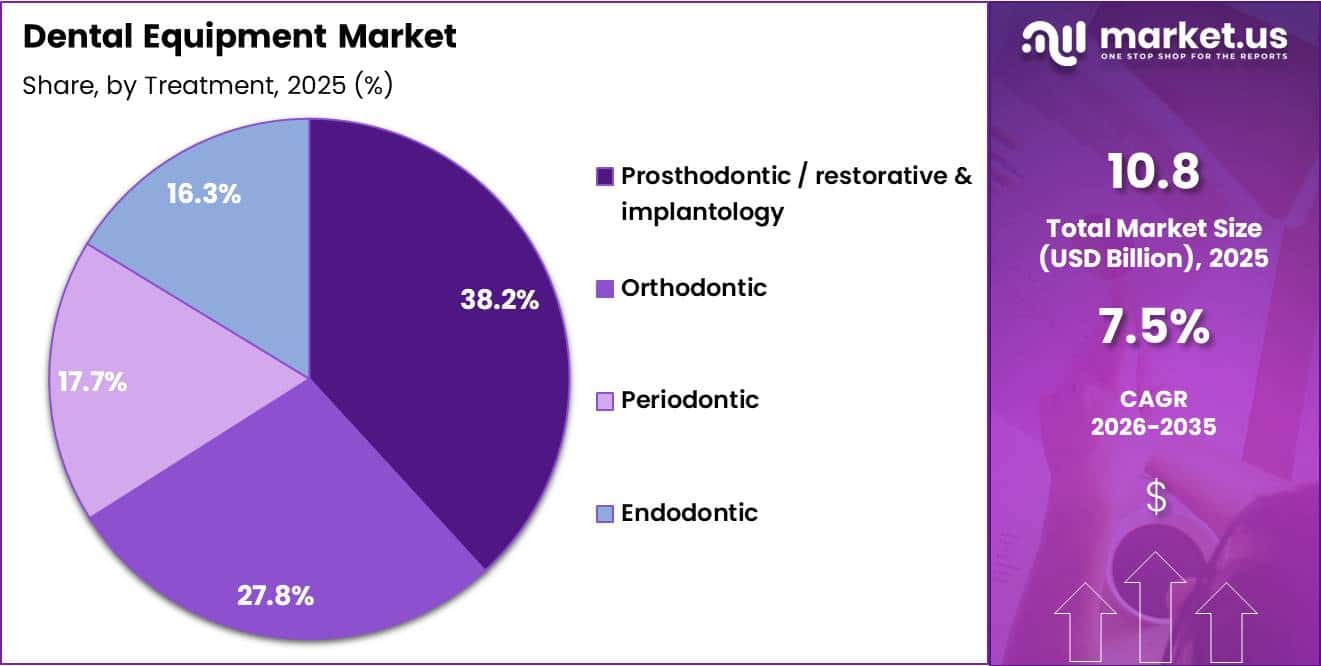
- Treatment: Prosthodontic/Restorative & Implantology leads the segment, accounting for 38.2% of total treatment segment revenue.
- Regional: North America is the dominant regional market, accounting for 41.5% of global revenue, holding US$ 4.49 billion in revenue in 2025.
Product Type Analysis
Based on product type, the global dental equipment market is segmented into dental consumables & hygiene products, systems & parts, dental radiology equipment, laboratory equipment, and dental lasers.
Dental consumables & hygiene segments dominated the market with a 42.2% share in 2025, supported by continuous demand for infection prevention products, disposable dental materials, oral care supplies, and routine clinical procedures. The growing number of dental visits and increasing focus on maintaining strict sterilization protocols in dental facilities are strengthening demand for consumables.
Systems & parts accounted for 25.6% of the market in 2025, driven by replacement demand for dental chairs, delivery units, handpieces, and advanced treatment systems as clinics modernize their infrastructure.
Dental radiology equipment represented 16.4%, supported by increased adoption of digital X-ray systems, cone-beam computed tomography (CBCT), and advanced imaging solutions that improve diagnostic accuracy.
Laboratory equipment held a 10.4% share, benefiting from the expansion of digital dental laboratories, CAD/CAM workflows, and customized prosthetic manufacturing. Meanwhile, dental lasers accounted for 5.4%, with adoption increasing in minimally invasive procedures such as soft tissue management, periodontal treatments, and cosmetic dentistry.
Overall, the shift toward digital dentistry and technologically advanced clinical workflows is expected to support future growth across all product categories.
End-user Analysis
Based on end-user, the global dental equipment market is segmented into dental hospitals, dental clinics, dental laboratories, and other users, including academia, research institutions, and public healthcare facilities.
Dental hospitals dominated the market with a 61.2% share in 2025, owing to their extensive adoption of advanced dental systems, diagnostic imaging equipment, surgical instruments, and specialized treatment technologies.
These facilities perform a high volume of complex procedures, including oral surgery, implantology, restorative treatments, and emergency dental care, driving demand for comprehensive equipment solutions.
Dental clinics represent a significant segment, supported by the global expansion of private dental practices and increasing demand for preventive, cosmetic, and general dental services. Independent clinics are increasingly investing in compact digital equipment, intraoral scanners, and chairside CAD/CAM technologies to improve treatment efficiency and patient experience.
Dental laboratories contribute to market growth through rising demand for customized dental restorations, prosthetics, and digitally manufactured dental products. The adoption of advanced laboratory equipment, including milling systems and 3D printing technologies, is enhancing production accuracy and workflow efficiency.
The other segment, including academia, research centers, and public dental programs, is supported by investments in dental education, clinical research, and government initiatives aimed at improving oral healthcare access.
Treatment Analysis
Based on treatment application, the global dental equipment market is categorized into prosthodontic/restorative & implantology, orthodontic, periodontic, and endodontic treatments.
Prosthodontic/restorative & implantology segments dominated the market with a 38.2% share in 2025, driven by increasing demand for dental implants, crowns, bridges, dentures, and aesthetic restoration procedures.
Rising awareness regarding oral aesthetics, tooth replacement solutions, and advanced restorative techniques is encouraging dental professionals to adopt sophisticated equipment for precision-based treatments.
Orthodontic treatments accounted for 27.8% of the market, supported by growing demand for braces, clear aligners, digital orthodontic planning, and imaging technologies. Increasing adoption of computer-assisted orthodontic solutions is improving treatment customization and patient outcomes.
Periodontic treatments represented 17.7%, with demand supported by the high prevalence of gum diseases and the growing use of specialized periodontal equipment, including dental lasers and ultrasonic instruments for minimally invasive procedures.
Endodontic treatments held a 16.3% share, driven by the continued need for root canal procedures and advanced tools such as rotary instruments, apex locators, and digital imaging systems that improve treatment accuracy.
The increasing adoption of minimally invasive dentistry, digital workflows, and patient-focused treatment approaches is expected to strengthen demand across all dental treatment segments.
Key Market Segments
By Product
- Dental Consumables & Hygiene
- Systems & Parts
- Dental Radiology
- Laboratory Equipment
- Dental Lasers
By End User
- Dental Hospitals
- Dental Clinics
- Dental Laboratories
- Others (Academia, Research, Public)
By Treatment
- Prosthodontic/Restorative & Implantology
- Orthodontic
- Periodontic
- Endodontic
Driver
Digital Chairside Dentistry Accelerates Restorative Workflow Adoption
The strongest 2026 commercial driver is the migration from analogue impressions and multi-visit restorative workflows toward intraoral scanning, CAD/CAM design, and same-day or near-same-day treatment chains, because it raises equipment revenue per operatory rather than only expanding patient volume.
FDA has long recognised optical impression systems for CAD/CAM restorations as a defined device class, and recent academic evidence shows AI-enabled intraoral scanning improves precision and reduces distortion across full-arch and whole-arch deviation measurements, which lowers remakes and makes scanner-plus-software bundles easier to justify at the clinic level.
In practical unit economics terms, a clinic that replaces even 2 to 3 remakes per month and compresses crown turnaround from multiple visits to one workflow captures more chair utilization, fewer impression consumables, and higher patient acceptance, which economic logic disproportionately benefits imaging systems, milling units, scanners, and integrated software ecosystems rather than standalone low-tech instruments.
This is why the demand effect is concentrated in North America, Western Europe, Japan, South Korea, and premium urban private networks in Asia, where markets already have the case mix, financing access, and prosthetic volume needed to absorb capital expenditure and monetize workflow speed within 12 to 24 months.
| Driver | (~) % Impact on CAGR Forecast | Geographic Relevance | Impact Timeline |
|---|---|---|---|
| Digital chairside dentistry shift | +1.9% | North America core, EU, Japan, South Korea, urban China, GCC private clinics | Short term (≤ 2 years) |
| Oral disease burden and ageing treatment load | +1.6% | Global, broad-based; strongest in North America, EU, India, China, Brazil | Medium term (2-4 years) |
| Medical-dental integration and reimbursement widening | +1.2% | U.S. core, Canada selective, EU public-system spill-over | Short term (≤ 2 years) |
| Diabetes-periodontal linkage boosting procedural intensity | +0.9% | U.S., EU5, India, China, Gulf states, Latin America metros | Medium term (2-4 years) |
| Prevention and primary-care oral health expansion | +0.8% | LMIC public systems, U.S. safety net, ASEAN, Africa, South Asia | Long-term (≥ 4 years) |
| Compliance-led replacement of legacy imaging and workflow systems | +1.1% | U.S., EU, UK, Australia, advanced APAC | Short term (≤ 2 years) |
Challenge
Interface Stability Challenges Limit Solid-State Battery Durability
Interface stability and durability bottlenecks arise from the intrinsic complexity of solid solid contact between electrodes and solid electrolytes, where interfacial resistance commonly measures 2 to 4 times higher than liquid systems.
Such as 100 to 150 Ω·cm² versus 30 to 60 Ω·cm² under fast charge conditions, contributing to localized heating, uneven lithium deposition, and accelerated capacity fade beyond 600 to 800 full cycles, which still trails the 1,000 plus cycle expectations for next generation EV packs.
Even though new interfacial engineering approaches such as intelligent protective layers or semi solid hybrid electrolytes can suppress dendrite growth and enable 12 minute fast charging at current densities above 8 mA/cm².
Field relevant test matrices covering temperature ranges from -20°C to 50°C and mechanical shocks up to 30 to 40 g remain incomplete, forcing OEMs to deploy conservative charge rate limits and over engineering safety margins that add 5% to 10% extra inactive material and 20 to 30 kg per vehicle pack.
Over the next 4 to 8 years, firms must invest in integrated multi-physics modelling and large-scale cycling databases with tens of thousands of cell-level test points, embedding real-time impedance and strain sensors into modules to tune charge protocols dynamically while gradually reducing interface resistance below 70 Ω·cm² and demonstrating less than 10% capacity loss after 1,500 to 2,000 cycles.
Achieving these benchmarks will be essential for extending warranty structures toward 300,000 to 500,000 km for mass market EV platforms without requiring oversized pack buffers that dilute the cost advantage of solid-state architectures.
| Challenge | (~) % CAGR Friction Drag | Geographic Relevance | Mitigation Horizon |
|---|---|---|---|
| Scale-up manufacturing learning gap | -1.6% | North America, EU, East Asia | Long-term (≥ 4 years) |
| Interface stability & durability bottlenecks | -1.4% | EV hubs, APAC electronics corridors | Long-term (≥ 4 years) |
| Raw material purity & supply variability | -1.2% | East Asia cathode belt, EU import hubs | Medium term (2-4 years) |
| Capital-intensive pilot line economics | -1.0% | North America core, EU industrial clusters | Medium term (2-4 years) |
| Talent density in electrochemistry & manufacturing | -0.8% | Japan, Korea, the US, Germany | Long-term (≥ 4 years) |
| Regulatory qualification & safety validation cycles | -0.7% | US, EU, and China auto regulators | Medium term (2-4 years) |
Restraints
Prolonged Approval Cycles Delay Dental Device Market Expansion
Beyond the pure regulatory cost burden, the tempo and predictability of device approvals have deteriorated, with MDR-linked notified body bottlenecks and stricter FDA scrutiny for higher-risk dental implants and software-driven tools translating into materially lengthened time to market.
In Europe, notified body capacity constraints mean many dental OEMs now face CE marking timelines of 18 to 24 months for upgraded implant systems or advanced imaging devices, versus 9 to 12 months earlier in the decade in high complexity categories requiring new clinical data, this can stretch to 30 months, creating a 1 to 1.5 year revenue gap on product refresh cycles and a cumulative NPV erosion of 8% to 12% for planned launches over 2026 to 2030.
In the US, increased emphasis on performance testing, cybersecurity validation, and software reliability for smart dental devices can add 20% to 30% more testing protocols and roughly USD 0.5 to 1.0 million in incremental validation and documentation costs per device family.
While recent warning letters around dental laboratories underscore FDA’s willingness to intervene and slow down market entry when manufacturing or labelling practices fall short.
These elongated cycles force manufacturers and distributors to carry higher bridging inventories of legacy equipment, tying up working capital equivalent to 10% to 15% of annual sales and raising storage and obsolescence risk, while clinics postpone upgrades waiting for certified next-generation systems, leaving a demand trough that could suppress the market CAGR by approximately 0.9 % points over the medium term.
| Restraint | (~) % Impact on CAGR Forecast | Geographic Relevance | Impact Timeline |
|---|---|---|---|
| Stricter device regulations & compliance overhead | -1.4% | EU, North America core | Medium term (2–4 years) |
| Prolonged approval & certification cycles | -0.9% | EU, North America, Japan | Medium term (2–4 years) |
| CapEx caution in dental practices | -1.2% | North America, EU, selective APAC | Short term (≤ 2 years) |
| Supply chain cost inflation & lead-time volatility | -0.8% | Global, APAC corridors | Short term (≤ 2 years) |
| Limited reimbursement & coverage for dental services | -0.7% | North America, selected OECD | Long-term (≥ 4 years) |
| Persistent unmet oral health needs in low-income markets | -0.6% | Emerging APAC, Latin America, Africa | Long-term (≥ 4 years) |
Opportunity
AI-Powered Chairside Diagnostics Expand Dental Technology Growth
AI-powered chairside diagnostics platforms represent a distinct future opportunity because current baseline dental equipment growth is driven largely by conventional imaging and treatment devices, whereas systematic monetization of AI decision support at the point of care remains nascent and fragmented.
With WHO estimating that nearly 3.5 to 3.7 billion people are affected by oral diseases and that untreated caries in permanent teeth is the most common health condition globally, even modest improvements in early detection at chairside can unlock substantial incremental value that current forecasts do not fully capture.
A realistic upside scenario assumes that by 2030, 25% to 30% of dental chairs in North America and the EU deploy AI modules integrated into intraoral scanners, 2D/3D imaging, and charting systems, enabling a 10% to 15% reduction in missed or late diagnoses and a 5% to 8% uplift in complex restorative and periodontal procedures per practice due to earlier and more confident treatment planning.
Commercially, this creates a monetizable hardware-software stack where vendors can sell annual AI licenses priced at 3% to 5% of equipment value, such as USD 8,000 to 15,000 per clinic per year, pushing lifetime revenue per installed unit up by 20% to 25% while maintaining gross margins above 60% due to software scalability.
Because AI oral diagnostics also align with emerging payer and government priorities around quality, prevention, and standardized documentation, manufacturers can tap into new reimbursement-linked revenue streams and data partnerships, such as risk scoring tools for insurers and public health dashboards, adding an estimated 2.0 % points to market CAGR between 2028 and 2035 relative to a hardware-only baseline.
| Opportunity | (~) % Potential CAGR Upside | Geographic Relevance | Execution Window |
|---|---|---|---|
| AI-powered chairside diagnostics platforms | +2.0% | North America, EU, urban APAC | Medium term (2-4 years) |
| Preventive-focused equipment bundles for underserved segments | +1.5% | Latin America, Africa, rural APAC | Medium term (2-4 years) |
| Integrated digital dentistry ecosystems (scanner–CAD–CAM–CBCT) | +2.3% | North America core, EU, East Asia | Short term (≤ 2 years) |
| Home-based oral monitoring and tele-dentistry hardware | +1.8% | North America, EU, high-connectivity APAC | Long-term (≥ 4 years) |
| Geriatric and long-term care dental equipment solutions | +1.2% | EU, North America, Japan | Medium term (2-4 years) |
| Value-based and outcomes-linked equipment financing models | +1.0% | North America, EU | Short to medium term (≤ 4 years) |
Regional Analysis
In 2025, North America led the market, achieving over 41.5% share with a revenue of US$ 4.49 billion. The global dental equipment market is expanding across major regions due to rising oral disease prevalence, increasing dental care expenditure, technological advancements, and growing adoption of digital dentistry solutions.
North America represents a leading market, supported by well-established dental healthcare infrastructure, high adoption of advanced diagnostic and treatment technologies, and strong demand for cosmetic and restorative dental procedures.
The presence of specialized dental hospitals and clinics, along with favorable reimbursement frameworks and increasing investments in digital dental solutions, continues to drive regional growth.
Europe holds a significant position in the global dental equipment market, supported by increasing awareness of preventive oral healthcare, an aging population requiring restorative treatments, and widespread adoption of advanced dental technologies.
Countries across the region are focusing on modernizing dental facilities with digital imaging systems, CAD/CAM technologies, and minimally invasive treatment equipment.
Asia-Pacific is expected to witness strong growth during the forecast period, driven by expanding healthcare infrastructure, rising disposable income, increasing dental tourism, and improving access to dental services. Growing investments in dental clinics, hospitals, and educational institutions are accelerating equipment adoption across emerging economies.
Latin America and the Middle East & Africa are also experiencing gradual market expansion due to improving healthcare systems, government initiatives supporting oral health awareness, and increasing private-sector investments in dental facilities.
However, limited access to advanced dental technologies and healthcare infrastructure gaps remain challenges in some developing areas. Overall, regional growth is being shaped by digital transformation, preventive care initiatives, and rising demand for advanced dental treatments.
Key Regions and Countries
North America
- The US
- Canada
Europe
- Germany
- France
- The U.K.
- Italy
- Spain
- Russia & CIS
- Rest of Europe
Asia Pacific
- China
- India
- Japan
- South Korea
- ASEAN
- Australia & New Zealand
- Rest of Asia Pacific
Middle East & Africa
- GCC
- South Africa
- Rest of Middle East & Africa
Latin America
- Brazil
- Mexico
- Rest of Latin America
Key Player Analysis
Suppliers in the global dental equipment market seek competitive advantage through digital dentistry platform integration connecting intraoral scanning, CAD/CAM milling, 3D printing, and digital radiography within unified chairside and laboratory workflow ecosystems that reduce manual impression and analogue laboratory steps while improving restoration precision, patient experience, and practice throughput.
Key strategic focus areas include cone beam computed tomography (CBCT) imaging system development enabling three-dimensional diagnostic imaging for implant planning, endodontic assessment, and orthodontic evaluation beyond conventional two-dimensional radiography capability.
Dental laser system advancement targeting hard and soft tissue applications with improved precision and reduced patient discomfort versus conventional rotary instrumentation, and clear aligner digital workflow integration enabling orthodontic treatment planning, aligner fabrication, and progress monitoring within connected digital practice management platforms.
Companies continue investing in dental practitioner training and certification programs, dealer distribution network development, ensuring geographic market coverage depth, and equipment financing and leasing program development, reducing capital investment barriers for independent dental practice and clinic institutional buyers.
The progressive adoption of digital dentistry technologies, including intraoral scanners, digital radiography, and CAD/CAM chairside systems as standard practice equipment rather than premium differentiators, is structurally elevating average capital equipment investment per dental practice and expanding the total addressable market for connected digital dental technology ecosystems through the forecast period to 2035.
Top Key Players
- 3M (3M ESPE)
- A-dec Inc.
- BIOLASE Inc.
- DENTSPLY SIRONA Inc.
- Envista Holdings Corporation
- GC Corporation
- Henry Schein Inc.
- Ivoclar Vivadent AG
- Midmark Corporation
- Patterson Companies Inc.
- Planmeca Oy
- Straumann Group
- Vatech Co., Ltd.
- W&H Group
- Zimmer Biomet Holdings Inc.
- Other Key Players
Recent Developments
- In January 2026, DENTSPLY SIRONA launched its next-generation DS Core digital dentistry platform integrating intraoral scanning, AI-powered treatment planning, and CAD/CAM restoration design across North American and European dental hospital and clinic institutional buyers seeking unified digital workflow capability.
- In February 2026, Straumann Group expanded its implant and digital prosthetic portfolio through the launch of an enhanced chairside milling unit targeting dental clinic and laboratory institutional buyers seeking same-day implant crown fabrication capability within integrated digital implantology workflow programs.
- In March 2026, Planmeca Oy secured a multi-year dental equipment supply agreement with a leading European dental hospital group covering CBCT imaging systems, dental units, and digital radiography equipment procurement across its regional institutional facility network.
- In May 2026, Vatech Co., Ltd. expanded its digital panoramic and CBCT dental radiography system distribution across Asia Pacific dental hospital and clinic institutional buyers, targeting growing diagnostic imaging adoption among dental practices upgrading from conventional film-based radiography to digital imaging infrastructure.
Report Scope
| Report Features | Description |
|---|---|
| Market Value (2025) | US$ 10.8 Billion |
| Forecast Revenue (2035) | US$ 22.4 Billion |
| CAGR (2026-2035) | 7.5% |
| Base Year for Estimation | 2025 |
| Historic Period | 2020-2024 |
| Forecast Period | 2026-2035 |
| Report Coverage | Revenue Forecast, Market Dynamics, Competitive Landscape, Recent Developments |
| Segments Covered | By Product (Dental Consumables & Hygiene, Systems & Parts, Dental Radiology, Laboratory Equipment, Dental Lasers), By End User (Dental Hospitals, Dental Clinics, Dental Laboratories, Others — Academia, Research, Public), By Treatment (Prosthodontic/Restorative & Implantology, Orthodontic, Periodontic, Endodontic) |
| Regional Analysis | North America – The US, Canada; Europe – Germany, France, U.K., Italy, Spain, Russia & CIS, Rest of Europe; Asia Pacific – China, India, Japan, South Korea, ASEAN, Australia & New Zealand, Rest of Asia Pacific; Middle East & Africa – GCC, South Africa, Rest of Middle East & Africa; Latin America – Brazil, Mexico, Rest of Latin America |
| Competitive Landscape | 3M (3M ESPE), A-dec Inc., BIOLASE Inc., DENTSPLY SIRONA Inc., Envista Holdings Corporation, GC Corporation, Henry Schein Inc., Ivoclar Vivadent AG, Midmark Corporation, Patterson Companies Inc., Planmeca Oy, Straumann Group, Vatech Co., Ltd., W&H Group, Zimmer Biomet Holdings Inc., Other Key Players |
| Customization Scope | Customization for segments, region/country-level will be provided. Moreover, additional customization can be done based on the requirements. |
| Purchase Options | We have three licenses to opt for: Single User License, Multi-User License (Up to 5 Users), Corporate Use License (Unlimited User and Printable PDF) |





































