


Report Overview
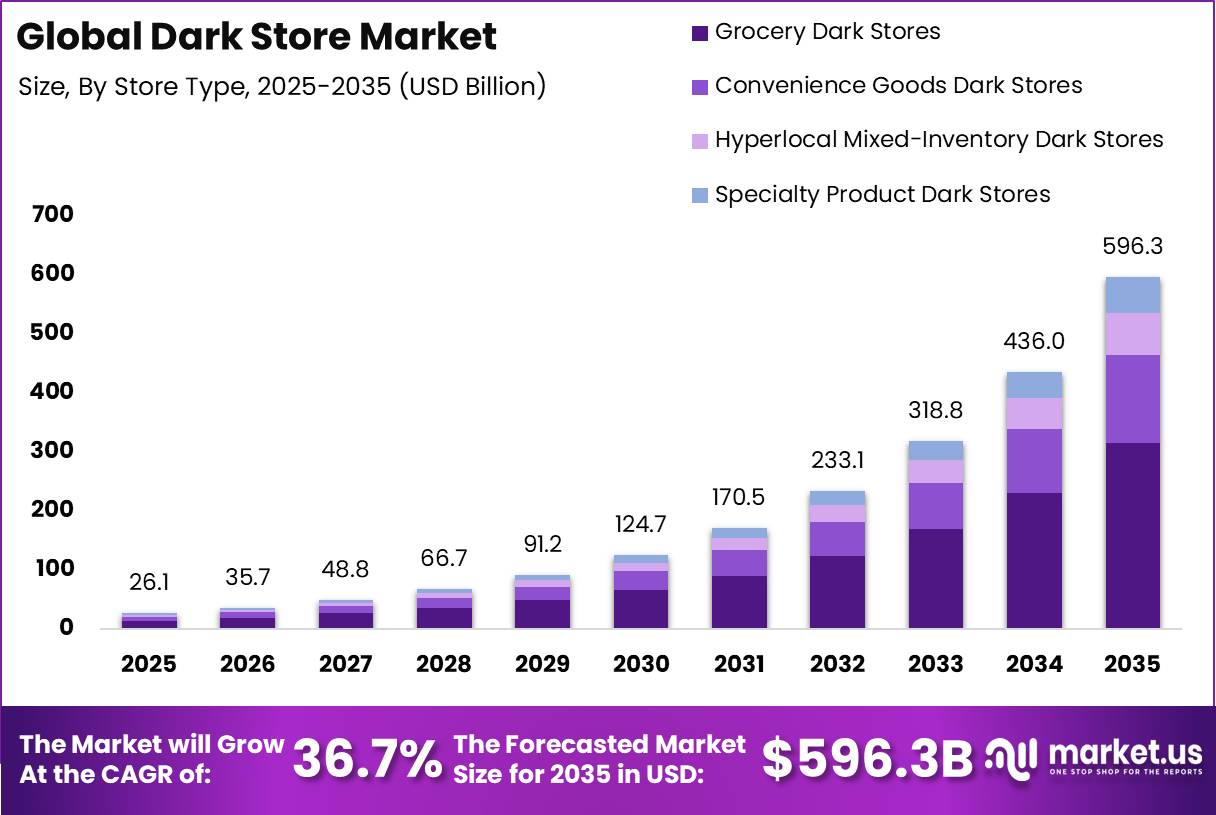
Global Dark Store Market size is expected to be worth around USD 596.3 Billion by 2035 from USD 26.1 Billion in 2025, growing at a CAGR of 36.7% during the forecast period 2026 to 2035.
A dark store operates as a fulfillment-only retail site closed to walk-in shoppers and dedicated to picking and packing online orders. Operators design these locations for order density rather than customer browsing. This means layout, staffing, and inventory choices all prioritize speed over presentation. Retailers use this model to shorten last-mile delivery windows.
Key Takeaways
- Global Dark Store Market size is projected to reach USD 596.3 Billion by 2035, up from USD 26.1 Billion in 2025.
- The market is set to expand at a CAGR of 36.7% between 2026 and 2035.
- Grocery Dark Stores lead the By Store Type segment with a 52.80% share.
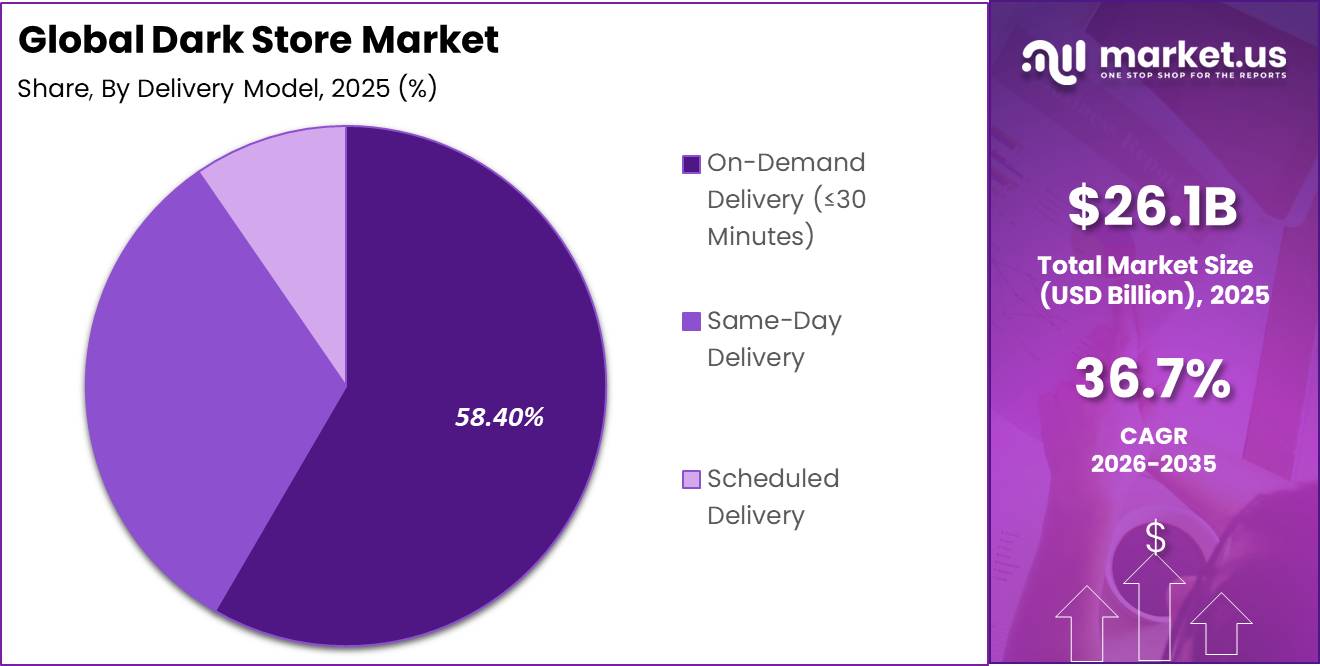
- On-Demand Delivery (≤30 Minutes) leads the By Delivery Model segment with a 58.40% share.
- Micro-Fulfillment Centers (MFCs) lead the By Fulfillment Type segment with a 61.70% share.
- Grocery and Daily Essentials lead the By End Use segment with a 56.30% share.
- B2C (Business-to-Consumer) leads the By Business Model segment with a 67.90% share.
- Retailer-Owned Dark Stores lead the By Ownership Type segment with a 54.60% share.
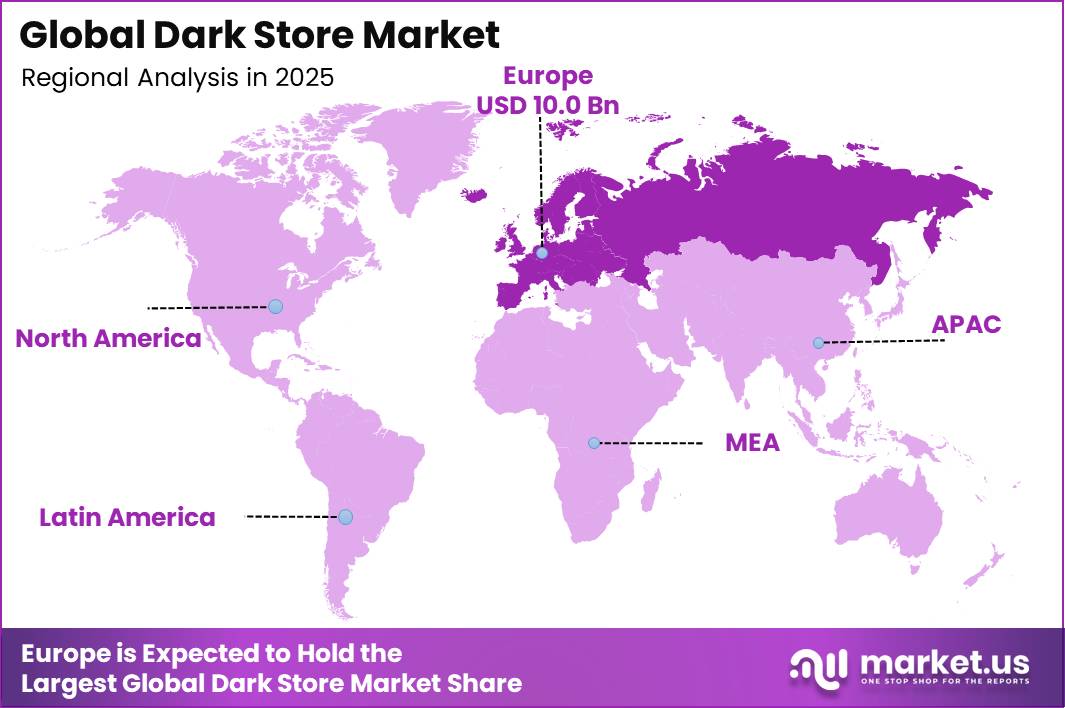
- Europe dominates the regional landscape with a 38.20% share, valued at USD 10.0 Billion.
Instead of relying on traditional store footprints, operators now convert warehouse and micro-fulfillment space into order-processing hubs. This creates a distinct operating model built around delivery radius rather than foot traffic. Amazon disclosed a 4 Billion dollar investment in its rural delivery network to widen rapid fulfillment coverage. This signals that large retailers view dense, localized fulfillment infrastructure as a long-term competitive asset rather than a short-term delivery fix.
According to Amazon, the company delivered more than 13 Billion items globally through same-day or next-day delivery during 2025. This scale demonstrates that ultra-fast fulfillment has moved from a niche offering to a core retail expectation. As reported by Amazon, US Prime members received more than 8 Billion items through same-day or next-day delivery in 2025, a gain of over 30% versus the prior year. This growth rate shows demand for rapid delivery is accelerating faster than overall retail sales, pushing more operators to add dark store capacity.
Store Type Analysis
Grocery Dark Stores dominate with 52.80% due to daily food demand repeatability.
Grocery dark stores lead because people buy food and staples again and again, which creates steady, high-frequency orders that keep these sites busy all day. In the EU, online shopping keeps rising, and 74% of internet users shopped online for personal use in 2021, giving grocery operators a large and loyal customer base to serve quickly. Food and daily items also carry small basket sizes that suit fast local picking, so grocery dark stores fill first.
Hyperlocal mixed-inventory dark stores now grow fastest because they blend groceries, personal care, and small general goods under one roof, letting one order cover many needs. This model matches India’s booming quick-commerce demand, where the sector jumped roughly 80% in value during 2020 as digital habits spread. Mixed inventory raises the average order value and cuts the cost of running separate sites, so operators expand these flexible stores rapidly across dense urban zones where varied, small-batch buying happens every hour of the day.
Delivery Model Analysis
On-Demand Delivery dominates with 58.40% due to instant urban convenience expectations.
On-demand delivery under 30 minutes leads because shoppers in crowded cities now expect goods almost instantly, and dark stores sit close enough to make this speed real. India shows how strong this pull is: the country’s e-commerce revenue was set to climb from US$39 billion in 2017 toward US$120 billion in 2020, growing near 51% yearly, the fastest pace worldwide. This appetite for speed pushes operators to place small stores within a few kilometers of buyers so riders reach doors within minutes.
On-demand is also the fastest-growing model, since each quick order builds a habit that raises repeat buying and lifts total volume. India’s online retail market alone reached about US$17.8 billion, proving how deep the base for rapid fulfillment already runs. Faster promises also help stores win customers from slower rivals, so firms invest heavily in tight delivery windows. As more people trust minute-level service, on-demand keeps both the biggest share and the steepest climb.
Fulfillment Type Analysis
Micro-Fulfillment Centers dominate with 61.70% due to compact automated urban picking.
Micro-fulfillment centers lead because their small footprint fits inside busy cities, letting operators store thousands of items just steps from customers and pack orders in minutes. These sites often run from 3,000 to about 10,000 square feet, so rent stays low while location stays prime, a mix that pure warehouses cannot match. Automation inside these centers speeds picking and cuts errors, which matters when delivery windows are tight.
MFCs also grow fastest because e-commerce keeps expanding and demands ever-closer stock. In the United States, online sales reached US$326.7 billion in the first quarter of 2026 and made up 16.9% of all retail, showing how much volume now flows through digital channels that MFCs serve. As orders rise, retailers add more of these compact hubs to shrink last-mile distance and lower fuel costs. Their blend of small size, speed, and low delivery cost makes MFCs the clear engine of dark store fulfillment and the segment expanding at the quickest rate.
End Use Analysis
Grocery & Daily Essentials dominate with 56.30% due to constant household consumption cycles.
Grocery and daily essentials lead end use because households run out of milk, bread, and cleaning items constantly, creating orders that repeat weekly and sometimes daily. This steady churn gives dark stores a reliable volume base that no other category matches. India’s online grocery market showed this force clearly, expanding to US$2.66 billion in 2020 as families shifted routine shopping online during the pandemic. Everyday goods also move fast, so stock turns quickly and shelves rarely sit idle.
Pharmaceuticals and healthcare now grow fastest because people increasingly order medicines and wellness products to their doors for privacy and convenience. India had close to 50 e-pharmacies operating, and the segment was projected to grow around 44% each year toward US$4.5 billion by 2025. Aging populations, chronic conditions, and doctor e-prescriptions push more health orders through dark stores. Because medicines need speed and careful handling, dark stores fit this need well, letting healthcare climb sharply while groceries hold the largest overall share of demand.
Business Model Analysis
B2C dominates with 67.90% due to direct mass consumer reach.
The B2C model leads because dark stores were built to serve everyday shoppers directly, matching the huge base of individual buyers who want fast home delivery. India’s e-retail sector shows the scale of this consumer pull, with gross merchandise value projected to rise more than 18% each year to reach about US$170 billion by 2030. Millions of single-household orders create the frequent, small-basket demand that dark stores handle best, so B2C captures most volume. B2B, selling to shops and small businesses, now grows fastest because kirana stores, cafes, and offices increasingly restock through quick digital channels rather than slow wholesalers.
India’s B2B online marketplace alone represents a US$200 billion opportunity by 2030, signaling strong room to expand. Business buyers order larger, more predictable volumes, which improves route efficiency and margins for operators. As firms chase steadier demand and better economics, they open more B2B lines from the same dark stores. This makes B2B the quickest riser while B2C keeps its commanding lead in overall share.
Ownership Type Analysis
Retailer-Owned Dark Stores dominate with 54.60% due to full supply-chain control.
Retailer-owned dark stores lead because large chains already hold buying power, brand trust, and supplier links, so running their own sites keeps costs and quality under one roof. Owning the store lets retailers control stock, pricing, and delivery promises without splitting margins with outside partners. Europe shows why big grocers invest here, as online made up about 16% of total retail sales across France, Germany, Italy, Spain, and the UK in 2024, pushing chains to build dedicated fulfillment.
Third-party logistics operated dark stores now grow fastest because many brands prefer to outsource fulfillment and focus on selling. The global 3PL sector reached roughly US$1.4 trillion in 2025, proving how widely companies now trust specialists to run warehousing and delivery. Outsourcing lets newer or smaller sellers enter dark store retail without heavy upfront spending on buildings and staff. As speed pressure rises and capital stays tight, more firms hand operations to 3PL experts. This drives the fastest ownership growth while established retailers keep the biggest share.
Key Market Segments
By Store Type
- Grocery Dark Stores
- Convenience Goods Dark Stores
- Hyperlocal Mixed-Inventory Dark Stores
- Specialty Product Dark Stores
By Delivery Model
- On-Demand Delivery (≤30 Minutes)
- Same-Day Delivery
- Scheduled Delivery
By Fulfillment Type
- Micro-Fulfillment Centers (MFCs)
- Standalone Dark Stores
- Hybrid Fulfillment Centers
By End Use
- Grocery & Daily Essentials
- Personal Care & Household Products
- Pharmaceuticals & Healthcare
- Electronics & Miscellaneous Products
By Business Model
- B2C (Business-to-Consumer)
- B2B (Business-to-Business)
By Ownership Type
- Retailer-Owned Dark Stores
- Third-Party Logistics (3PL) Operated Dark Stores
- Marketplace-Owned Dark Stores
Regional Analysis
Europe Dominates the Dark Store Market with a Market Share of 38.20%, Valued at USD 10.0 Billion
Europe leads the Dark Store Market because dense city centers keep delivery radii short and order density high. Mature grocery retail chains across Germany, France, and the UK have already built distribution networks that convert easily into micro-fulfillment sites. This structural advantage keeps per-order delivery costs lower than in less dense regions.
North America follows Europe as operators expand rapid grocery delivery coverage. In August 2025, Amazon extended same-day grocery delivery to more than 1,000 US cities and towns through its local fulfillment network. This expansion signals large retailers are treating rapid delivery as a baseline service rather than a premium feature across the region.
Asia-Pacific is expanding fastest among all regions in the Dark Store Market. Rising smartphone use and dense residential formats across major cities support rapid order growth. This means operators entering Asia-Pacific early can secure prime micro-fulfillment locations before competition raises real estate costs.
Key Regions and Countries
North America
- US
- Canada
Europe
- Germany
- France
- The UK
- Spain
- Italy
- Rest of Europe
Asia Pacific
- China
- Japan
- South Korea
- India
- Australia
- Rest of APAC
Latin America
- Brazil
- Mexico
- Rest of Latin America
Middle East and Africa
- GCC
- South Africa
- Rest of MEA
Drivers
India’s Unified Payments Interface processed approximately 228 Billion transactions in 2025, with monthly volumes consistently above 20 Billion in the second half of the year. This instant payment rail covers most quick commerce order values, which typically fall between INR 300 and INR 1,500.
UPI already accounts for more than 75% of all digital payment volume in India and now connects to more than 20 additional countries. This means quick commerce platforms process orders faster and with fewer failed transactions, directly supporting dark store order throughput.
| Driver | (~) % Impact | Geographic Relevance | Impact Timeline |
|---|---|---|---|
| Internet & Smartphone Penetration | +2.8% | India, Southeast Asia, LATAM, MENA | Short term (≤ 2 years) |
| UPI & Digital Payments Infrastructure | +2.3% | India core → Southeast Asia, Africa | Short term (≤ 2 years) |
| Urbanization & High-Density City Formation | +2.6% | Global — South Asia, APAC, MENA, Africa | Medium term (2–4 years) |
| AI-Driven Inventory Forecasting | +2.1% | India, North America, EU | Medium term (2–4 years) |
| Global Institutional Capital Accelerating Scaling | +1.9% | India, Southeast Asia, EU | Medium term (2–4 years) |
| Consumer Habituation to Sub-30-Min Delivery | +2.4% | India metros, EU, North America, SEA | Long term (≥ 4 years) |
Restraints
Dark store operators serving European Union customers must follow GDPR rules when handling personal data. The regulation requires privacy by design under Article 25 and mandates breach notification to regulators within 72 hours of discovery.
Serious GDPR violations can trigger fines up to €20 Million or 4% of global annual turnover, whichever is higher. In June 2025, the EU agreed on updated rules to streamline cross-border enforcement. This raises compliance costs for platforms operating across multiple EU jurisdictions at once.
| Restraint | (~) % Impact | Geographic Relevance | Impact Timeline |
|---|---|---|---|
| EU Platform Work Directive — Gig Worker Reclassification | -2.8% | EU 27 member states (deadline Dec 2026) | Short term (≤ 2 years) |
| French & Dutch Municipal Dark Store Zoning Bans | -2.1% | France, Netherlands, Belgium, Spain | Short term (≤ 2 years) |
| GDPR Compliance Cost & Enforcement Escalation | -1.7% | EU, UK, EEA | Medium term (2–4 years) |
| €40+ AOV Break-Even Ceiling in European Markets | -2.3% | EU, UK, Australia | Medium term (2–4 years) |
| Urban Nuisance Legislation & Resident Eviction Rights | -1.9% | EU major cities, UK, North America | Medium term (2–4 years) |
| GCC Halal & Data Localization Compliance Framework | -1.5% | Saudi Arabia, UAE, Qatar, Kuwait | Long term (≥ 4 years) |
Challenges
Rapid quick commerce growth is pushing up demand for strategically located urban warehouse space. India’s dark store footprint reached approximately 24 Million square feet in 2023 and is projected to reach 37.6 Million square feet by 2027.
Dark stores can command rental premiums of up to 25% over standard retail properties because of strict location needs. Rates typically range between ₹35 and ₹250 per square foot monthly depending on the city. This makes securing well-located sites near dense neighborhoods increasingly competitive for new entrants.
| Challenge | (~) % Friction Drag | Geographic Relevance | Mitigation Horizon |
|---|---|---|---|
| Gig Delivery Workforce Attrition & Pay Compression | -2.6% | India all metros, Tier 2 expansion zones | Short term (≤ 2 years) |
| Break-Even Order Value Threshold Structural Pressure | -2.1% | India, EU, North America | Short term (≤ 2 years) |
| Urban Real Estate Premium & Space Scarcity | -1.8% | India Tier 1 metros, EU, North America | Medium term (2–4 years) |
| Perishable SKU Spoilage & Cold Chain Inventory Waste | -1.7% | Global — India, EU, Southeast Asia | Medium term (2–4 years) |
| Retail Cybersecurity Exposure & Data Breach Risk | -1.5% | North America, EU, India | Medium term (2–4 years) |
| Last-Mile Traffic Congestion Eroding Delivery SLAs | -1.9% | Global — India metros, EU, SEA | Long term (≥ 4 years) |
Opportunities
India’s quick commerce sector is expanding beyond groceries into higher-value categories. Beauty and personal care recorded approximately 140% year-on-year growth in 2026, while non-grocery products reached 26% of one leading platform’s gross merchandise value, up from 9% a year earlier.
India’s total retail market reached approximately USD 883 Billion in FY2024, pointing to a large addressable base beyond grocery. Categories such as electronics and fashion typically carry higher margins than grocery items. This gives platforms room to diversify revenue and reduce reliance on low-margin grocery sales.
| Opportunity | (~) % Potential Incremental Upside | Geographic Relevance | Execution Window |
|---|---|---|---|
| Non-Grocery Category Expansion (Electronics & Fashion) | +3.1% | India, EU, North America, Southeast Asia | Short term (≤ 2 years) |
| Quick Commerce Retail Media Network Monetization | +2.4% | India, North America, EU | Short term (≤ 2 years) |
| Tier 2 & Tier 3 City Dark Store Penetration | +3.4% | India, Southeast Asia, LATAM | Medium term (2–4 years) |
| Rapid 10-Minute Pharmacy & Healthcare Dark Stores | +2.8% | India, Southeast Asia, EU | Medium term (2–4 years) |
| Fulfillment-as-a-Service (FaaS) for D2C Brands | +2.2% | India, North America, EU | Medium term (2–4 years) |
| B2B Enterprise & Office Q-Commerce Supply Model | +1.9% | North America, EU, India metros | Long term (≥ 4 years) |
Key Company Insights
Getir built its position as one of the earliest ultra-fast grocery delivery operators running dense urban dark store networks. In February 2026, Uber agreed to acquire Getir’s grocery-delivery business, adding its dark stores and rapid-fulfillment assets to Uber Eats. This consolidation shows independent quick commerce operators face pressure to merge with larger platforms for survival.
Gorillas entered the market as a rapid grocery delivery challenger focused on European city centers with compact dark store formats. Its early expansion pushed rivals to shorten delivery windows across dense metro areas. This competitive pressure raised the baseline speed expectation across the wider European dark store market.
Key Players
- Getir
- Gorillas
- Flink
- Zapp
- GoPuff
- Blinkit
- Zepto
- Instacart
- DoorDash
- Uber Eats
- Tesco
- Carrefour
- Walmart
- Mercadona
- REWE Group
Recent Developments
- August 2025 – Amazon expanded same-day grocery delivery to more than 1,000 US cities and towns through its local fulfillment network.
- March 2026 – Amazon advanced Project Kobe, a retail format combining large-format stores with AutoStore robotic warehouse systems for high-speed order fulfillment.
- July 2025 – Walmart expanded testing of dedicated dark-store and micro-fulfillment operations to improve online grocery fulfillment.
Report Scope
| Report Features | Description |
|---|---|
| Market Value (2025) | USD 26.1 Billion |
| Forecast Revenue (2035) | USD 596.3 Billion |
| CAGR (2026-2035) | 36.7% |
| Base Year for Estimation | 2025 |
| Historic Period | 2020-2024 |
| Forecast Period | 2026-2035 |
| Report Coverage | Revenue Forecast, Market Dynamics, Market Opportunity Analysis, Technology and Innovation Landscape, Competitive Landscape, Recent Developments |
| Segments Covered | By Store Type (Grocery Dark Stores, Convenience Goods Dark Stores, Hyperlocal Mixed-Inventory Dark Stores, Specialty Product Dark Stores), By Delivery Model (On-Demand Delivery, Same-Day Delivery, Scheduled Delivery), By Fulfillment Type (Micro-Fulfillment Centers, Standalone Dark Stores, Hybrid Fulfillment Centers), By End Use (Grocery & Daily Essentials, Personal Care & Household Products, Pharmaceuticals & Healthcare, Electronics & Miscellaneous Products), By Business Model (B2C, B2B), By Ownership Type (Retailer-Owned, Third-Party Logistics Operated, Marketplace-Owned) |
| Regional Analysis | North America (US and Canada), Europe (Germany, France, The UK, Spain, Italy, and Rest of Europe), Asia Pacific (China, Japan, South Korea, India, Australia, and Rest of APAC), Latin America (Brazil, Mexico, and Rest of Latin America), Middle East and Africa (GCC, South Africa, and Rest of MEA) |
| Competitive Landscape | Getir, Gorillas, Flink, Zapp, GoPuff, Blinkit, Zepto, Instacart, DoorDash, Uber Eats, Tesco, Carrefour, Walmart, Mercadona, REWE Group |
| Customization Scope | Customization for segments, region/country-level will be provided. Additional customization can be done based on requirements. |
| Purchase Options | We have three licenses to opt for: Single User License, Multi-User License (Up to 5 Users), Corporate Use License (Unlimited User and Printable PDF) |





































