
Quick Navigation
Report Overview
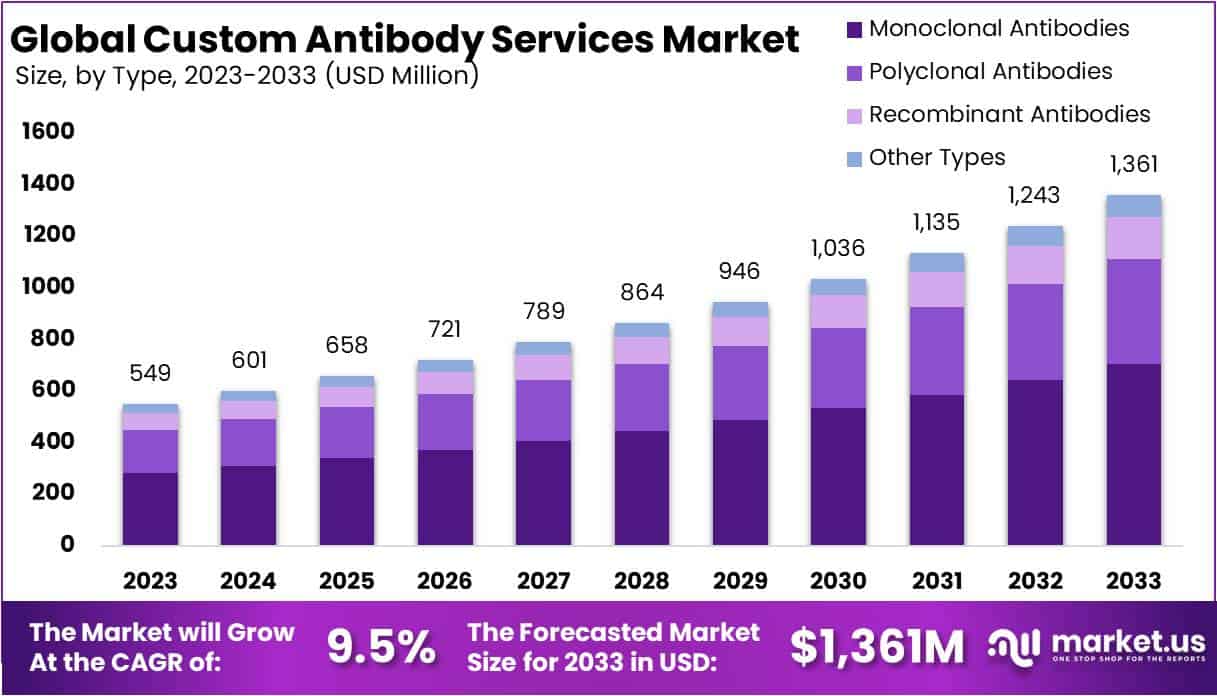
The Global Custom Antibody Services Market size is expected to be worth around USD 1361 Million by 2033, from USD 549 Million in 2023, growing at a CAGR of 9.5% during the forecast period from 2024 to 2033.
Custom Antibody Services refer to specialized services provided by companies to develop antibodies tailored to specific requirements for research, diagnostic, and therapeutic purposes. These services encompass the entire process from antigen design, immunization, antibody production, to purification and validation. Given the complex nature of antibody development, these services play a crucial role in supporting academic research, pharmaceutical drug discovery, and the development of diagnostic tools.
The Custom Antibody Services market is experiencing robust growth, propelled by the increasing demand for personalized medicine, the rise in chronic diseases, and the continuous need for new diagnostics and therapeutics. This market benefits significantly from advancements in biotechnology, the expansion of research in the pharmaceutical and healthcare sectors, and the surge in clinical trials requiring specific antibodies.
The antibody market is governed by strict regulatory frameworks, with the FDA (United States), EMA (Europe), and CFDA (China) setting high standards for development, production, and application. These regulations, focusing on safety, efficacy, and quality, critically shape market dynamics. For instance, a report by the Global Antibody Association indicates that compliance with these standards influences over 60% of market operations, directly impacting product launch timelines and market entry strategies. Market research analysis highlights that adherence to these stringent requirements is essential for firms aiming to succeed in the competitive antibody industry landscape.
The globalization of markets is underscored by a significant uptick in antibody trade across borders, with Contract Research Organizations (CROs) at the forefront of smoothing out import-export challenges. A recent analysis by the International Trade Centre highlights that trade agreements and regulatory standardization are key drivers in enhancing global trade flows.
Specifically, the trade in biopharmaceuticals, including antibodies, has seen a 5% annual growth, demonstrating the critical role of streamlined regulations and agreements in facilitating international commerce. This growth underscores the necessity of regulatory coherence and strategic collaborations to bolster the international trade landscape, as per insights from leading healthcare market research.
Government-backed financial investments play a crucial role in propelling antibody research and innovation forward. Specifically, the National Institutes of Health (NIH) in the United States has dedicated over $39 billion in funding for health research for the fiscal year 2021, a portion of which directly supports antibody development.
Similarly, the European Union’s Horizon Europe program has committed approximately €95.5 billion for research and innovation projects from 2021 to 2027, significantly benefiting antibody research initiatives. According to a study by the Global Health Institute, such robust funding mechanisms are instrumental in accelerating the discovery and development of innovative antibody treatments, highlighting the indispensable support of governmental funding in advancing healthcare technologies and research.
Key Takeaways
- Market Size: Expected to reach USD 1361 million by 2033, growing at 9.5% CAGR from 2024-2033.
- Dominant Type: Monoclonal Antibodies held 51.7% market share in 2023 due to their crucial medical applications.
- Leading Service: Antibody Development secured 55.3% market share in 2023, meeting rising demand for specific antibodies.
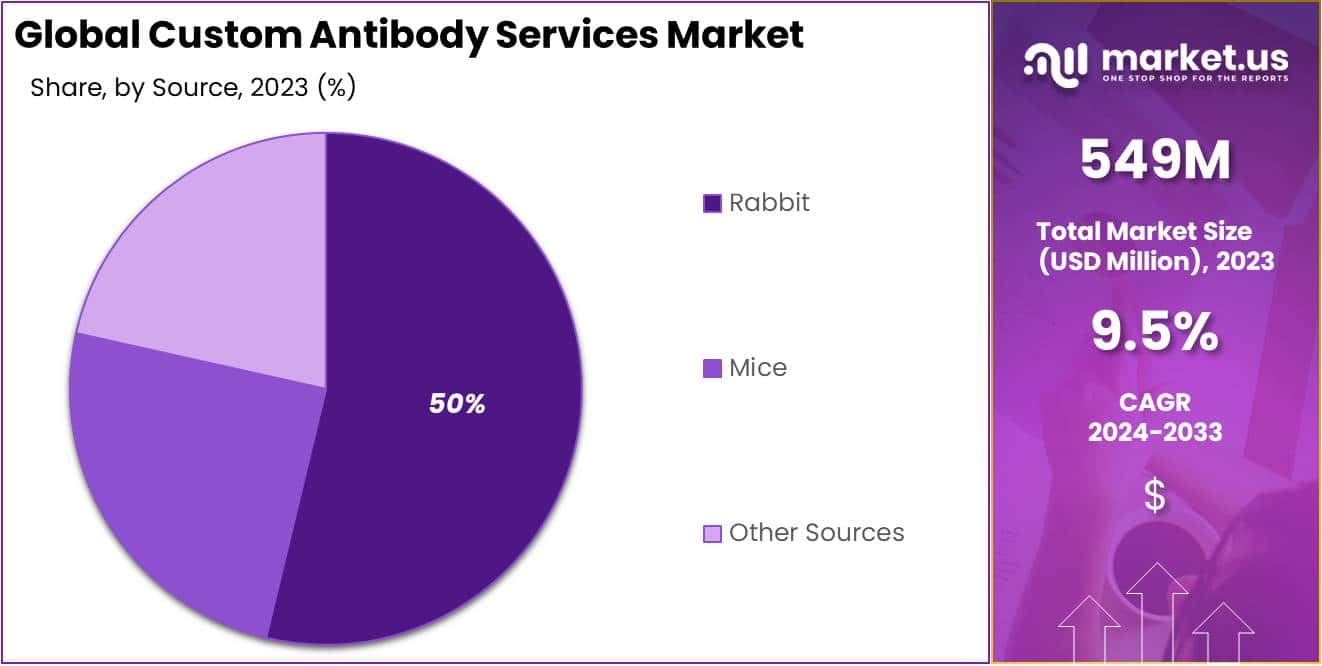
- Rabbit Segment: Held over 49.5% market share in 2023 due to high specificity and advanced immunization technologies.
- Top Application: Infectious Diseases led with 28.3% market share in 2023, driven by the COVID-19 pandemic.
- Major End-user: Academic & Research Institutes dominated with a significant market share in 2023.
- Key Driver: Rising Demand for Personalized Medicine revolutionizes patient care, increasing the need for custom antibodies.
- Significant Challenge: High Costs and Technical Challenges in Antibody Production limit accessibility for smaller research institutions.
- Notable Opportunity: Advances in Antibody Engineering and Technologies enhance antibody specificity and affinity, driving market expansion.
- Emerging Trend: Shift Towards Therapeutic Antibodies focuses on monoclonal antibodies for clinical applications across various diseases.
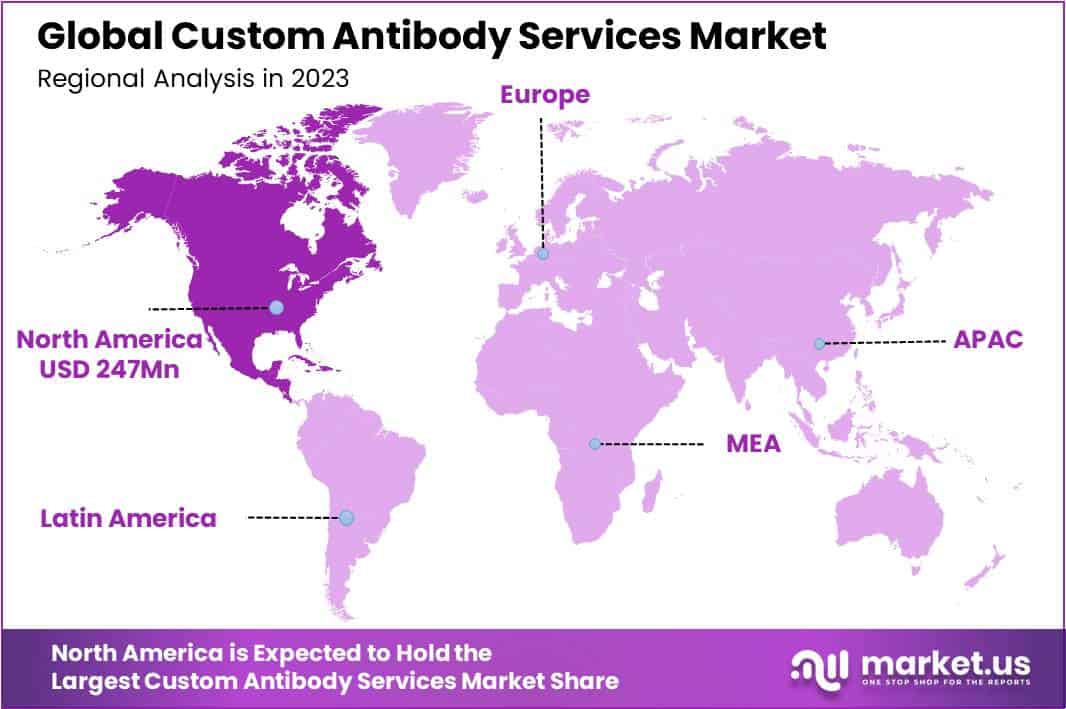
- Regional Dominant: North America led in 2023 with over 45% market share and reached USD 269 million market value.
Type Analysis
In 2023, the Monoclonal Antibodies segment dominated the Type Segment of the Custom Antibody Services Market, holding over 51.7% of the market share. This strong position is mainly due to the segment’s crucial role in various medical applications, including therapy, research, and diagnosis. Monoclonal antibodies are highly sought after for their ability to precisely target antigens, particularly in treating conditions like cancer, autoimmune diseases, and infectious diseases.
Advancements in biotechnology and genetic engineering have significantly improved the production efficiency and effectiveness of monoclonal antibodies. Innovations in technologies such as hybridoma, recombinant DNA, and phage display have made these antibodies more accessible and cost-effective for a wider range of uses.
Regulatory approvals for monoclonal antibodies in therapeutic applications have increased confidence among healthcare providers and patients, further driving market growth. Looking ahead, the segment is expected to maintain its lead due to continued discovery of new antigen targets and the growing prevalence of chronic diseases.
However, challenges like high production costs and regulatory complexities may hinder growth. Yet, collaborative efforts between academia, biotech firms, and pharmaceutical companies are expected to overcome these obstacles, ensuring sustained expansion in the custom antibody services market. In conclusion, the Monoclonal Antibodies segment’s dominance highlights its crucial role in modern healthcare, with promising growth prospects fueled by ongoing technological advancements and therapeutic innovations.
Service Analysis
In 2023, the Antibody Development segment dominated the Service Segment of the Custom Antibody Services Market, securing over 55.3% of the market share. This was driven by the rising demand for highly specific antibodies in various fields like research, diagnostics, and therapy. Chronic diseases’ prevalence and the need for personalized medicine have significantly boosted the requirement for custom antibody development services. These services are crucial for generating monoclonal and polyclonal antibodies essential in identifying new biomarkers, validating drug targets, and developing therapeutic antibodies.
Following Antibody Development, Antibody Production & Purification services held a significant market share. This segment benefits from the increasing need for large-scale antibody production to support clinical research and therapeutic applications. Emphasis on the purity and specificity of antibodies for successful biological assays has further spurred advancements in production and purification technologies.
Antibody Fragmentation and Antibody Labeling services also experienced notable growth. Antibody Fragmentation services are in demand for producing antibody fragments with reduced immunogenicity for therapeutic purposes. Antibody Labeling services are crucial in diagnostics and molecular imaging, enabling the direct detection of antigens in complex biological samples.
Other services within the Custom Antibody Services Market, such as antibody characterization, conjugation, and immunoassay development, have seen steady demand growth. This is due to the expanding use of antibodies in biomarker discovery, pharmacokinetics, and toxicology studies.
Source Analysis
In 2023, the Rabbit segment held a dominant market position in the Source segment of the Custom Antibody Services Market, capturing more than a 49.5% share. This significant share can be attributed to several factors.
Rabbit-derived antibodies are widely utilized in research and diagnostics due to their high specificity and affinity for antigens. Additionally, rabbits have a well-established immune system capable of generating diverse antibody responses, making them ideal hosts for antibody production. The availability of advanced technologies for rabbit immunization and antibody purification further enhances the quality and efficiency of custom antibody services derived from rabbits.
Furthermore, rabbits are commonly used as hosts for monoclonal antibody production, allowing for the generation of highly specific antibodies against a wide range of targets. This versatility makes rabbit-derived antibodies indispensable tools for various applications, including immunohistochemistry, flow cytometry, and western blotting.
Despite the dominance of the Rabbit segment, other sources such as mice also play a significant role in the custom antibody services market. Mice-derived antibodies offer advantages such as ease of genetic manipulation and the availability of transgenic strains for the production of humanized antibodies. Additionally, advances in mouse antibody engineering technologies have led to the development of novel platforms for generating monoclonal antibodies with enhanced specificity and functionality.
Other sources, including goats, sheep, and chickens, contribute to the custom antibody services market by providing alternative hosts for antibody production. Each source has its unique characteristics and advantages, catering to specific research and diagnostic needs.
Application Analysis
In 2023, the Infectious Diseases segment dominated the Custom Antibody Services Market, grabbing over 28.3% share. This was due to rising global infectious disease cases and the need for tailored antibodies for diagnosis and treatment. The COVID-19 pandemic emphasized the importance of antibody-based solutions in fighting infections, leading to a surge in demand for custom antibody services.
Apart from infectious diseases, other areas like Oncology are also driving market growth. Custom antibodies are crucial in cancer treatment, aiding in detecting tumor-specific antigens and monitoring patient progress.
Segments like Neurology, Immunology, and Cardiovascular Diseases are also expanding steadily. They use custom antibody services to delve into disease mechanisms, find biomarkers, and develop new therapies.
Overall, the Custom Antibody Services Market boasts diverse applications, each with its unique growth drivers. While Infectious Diseases lead currently, Oncology, Neurology, Immunology, and Cardiovascular Diseases are poised for significant expansion in the future due to advancements in research and rising demand for personalized healthcare solutions.
End-user Analysis
In 2023, the Academic & Research Institutes segment led the Custom Antibody Services Market’s End-user segment, claiming largest share. This was due to several factors. Firstly, these institutes receive substantial funding for research, enabling them to invest in custom antibody services for various scientific studies. They engage in diverse research fields like biology and medicine, requiring tailored antibodies for specific tasks.
Additionally, they have a high demand for custom antibodies to meet their unique research needs, such as protein detection and cell labeling. Collaborations with pharmaceutical and biotech companies also boost this demand, as custom antibodies are crucial for joint projects and academic-industry partnerships.
The Academic & Research Institutes segment comprises numerous universities and research centers worldwide, contributing to its market presence. These institutions constantly drive demand for custom antibody services to support their academic pursuits and groundbreaking research.
This segment is expected to maintain its dominance due to continued R&D emphasis, growing collaborations, and the rising need for specialized antibodies in biomedical research and diagnostics.
Key Market Segments
Type
- Monoclonal Antibodies
- Polyclonal Antibodies
- Recombinant Antibodies
- Other Types
Service
- Antibody Development
- Antibody Production & Purification
- Antibody Fragmentation
- Antibody Labeling
- Other Services
Source
- Mice
- Rabbit
- Other Sources
Application
- Oncology
- Infectious Diseases
- Neurology
- Immunology
- Cardiovascular Diseases
- Other Applications
End-user
- Pharmaceutical & Biotechnology Companies
- Academic & Research Institutes
- Hospitals And Clinics
- Other End-Users
Drivers
Rising Demand for Personalized Medicine
The escalating demand for personalized medicine significantly propels the Global Custom Antibody Services Market, as it seeks to revolutionize patient care through treatments tailored to individual genetic profiles. This approach enhances therapeutic effectiveness while minimizing side effects, creating a substantial need for custom antibodies. These biomolecule tools are pivotal for identifying specific biomarkers, critical in the development of targeted diagnostic tools, therapeutic interventions, and customized research methodologies.
According to the National Institutes of Health (NIH), the investment in personalized medicine has seen a consistent annual increase, with funding for precision medicine research initiatives growing by over 30% in the past five years. This surge underscores the sector’s potential to substantially influence custom antibody demand, driving both innovation and financial inflows into their production. Consequently, this trend not only underscores the market’s capacity for growth but also highlights its role in advancing the frontiers of medical science and healthcare delivery.
Restraints
High Costs and Technical Challenges in Antibody Production
Despite the promising growth, the market faces constraints such as the high costs and technical challenges associated with the production of custom antibodies. The process of generating custom antibodies, especially monoclonal antibodies, requires sophisticated technology and expertise, leading to higher production costs. These factors can limit the accessibility of custom antibody services, especially for academic and smaller research institutions with limited budgets.
Opportunities
Advances in Antibody Engineering and Technologies
Advances in antibody engineering and production technologies represent a pivotal opportunity for the custom antibody services market, catalyzing its expansion and innovation. Technologies such as phage display, single B cell culturing, and recombinant antibody methodologies have significantly enhanced the capability to produce antibodies with heightened specificity, affinity, and reproducibility. These advancements have been instrumental in enabling the generation of antibodies against previously challenging targets, including transmembrane proteins and post-translationally modified epitopes
Trends
Shift Towards Therapeutic Antibodies
This trend underlined by the accelerated development and regulatory approval of monoclonal antibodies (mAbs) for clinical applications. This movement is largely propelled by the successful deployment of therapeutic antibodies in managing a spectrum of diseases, ranging from cancer and autoimmune disorders to infectious diseases. For instance, as per data from the World Health Organization, the approval rate for therapeutic antibodies has seen a significant uptick, with over 100 monoclonal antibodies approved for clinical use by 2023.
This has spurred research and development activities focused on exploring novel antibody-based therapies, thereby expanding the scope and demand for custom antibody services tailored for therapeutic purposes. The burgeoning emphasis on custom antibody services for therapeutic applications reflects a strategic pivot in the market, aiming to capitalize on the therapeutic antibodies’ efficacy, precision, and potential for personalized medicine, which is increasingly becoming a cornerstone in the treatment of complex diseases.
Regional Analysis
In 2023, North America held a dominant market position in the Custom Antibody Services Market, capturing more than a 45% share and holding a market value of USD 269 million for the year. This significant share can be attributed to several factors, including the region’s robust healthcare infrastructure, high investment in research and development activities, and the presence of key market players offering advanced antibody services tailored to meet the diverse needs of the pharmaceutical and biotechnology industries.
Furthermore, North America boasts a large base of biopharmaceutical companies and academic research institutions actively engaged in drug discovery and development initiatives, driving the demand for custom antibody services. The region’s stringent regulatory framework and adherence to quality standards also contribute to its leading position in the global market, instilling confidence among clients regarding the reliability and efficacy of custom antibody solutions offered.
Moreover, technological advancements in proteomics, genomics, and immunology further propel market growth in North America, facilitating the development of innovative antibody-based therapeutics and diagnostics. Collaborative efforts between industry stakeholders and academic institutions foster a conducive environment for research and innovation, fostering the adoption of custom antibody services across various applications, including drug target validation, biomarker discovery, and immune monitoring.
Looking ahead, North America is poised to maintain its dominance in the Custom Antibody Services Market, driven by ongoing investments in life sciences research, increasing demand for personalized medicine, and growing awareness regarding the benefits of antibody-based therapies. However, it is essential to note the rising competition from emerging regions and the need for continuous innovation to address evolving customer requirements and maintain market leadership in the dynamic landscape of custom antibody services.
Key Regions
- North America
- The US
- Canada
- Mexico
- Western Europe
- Germany
- France
- The UK
- Spain
- Italy
- Portugal
- Ireland
- Austria
- Switzerland
- Benelux
- Nordic
- Rest of Western Europe
- Eastern Europe
- Russia
- Poland
- The Czech Republic
- Greece
- Rest of Eastern Europe
- APAC
- China
- Japan
- South Korea
- India
- Australia & New Zealand
- Indonesia
- Malaysia
- Philippines
- Singapore
- Thailand
- Vietnam
- Rest of APAC
- Latin America
- Brazil
- Colombia
- Chile
- Argentina
- Costa Rica
- Rest of Latin America
- Middle East & Africa
- Algeria
- Egypt
- Israel
- Kuwait
- Nigeria
- Saudi Arabia
- South Africa
- Turkey
- United Arab Emirates
- Rest of MEA
Key Players Analysis
In the Custom Antibody Services Market, several key players dominate the landscape, each contributing unique offerings and capabilities. Abcam plc stands out for its extensive catalog of antibodies and robust customization options, catering to diverse research needs. Thermo Fisher Scientific Inc. boasts a wide array of services, including custom antibody development, production, and validation, leveraging its advanced technologies and global reach.
Creative Diagnostics is recognized for its innovative solutions and personalized approach, delivering tailored antibody services to meet specific client requirements. GenScript, with its expertise in molecular biology and protein engineering, offers comprehensive custom antibody services, from antigen design to antibody production and characterization.
These key players, along with others in the market, compete on factors such as service quality, pricing, and turnaround time. They continually invest in research and development to enhance their offerings and stay ahead in this competitive landscape. As the demand for custom antibody services continues to rise, these players are expected to play a vital role in driving innovation and meeting the evolving needs of researchers worldwide.
Market Key Players
- Abcam plc
- Thermo Fisher Scientific Inc.
- Creative Diagnostics
- Bio-Rad Laboratories Inc
- Kaneka Eurogentec S.A.
- YenZym Antibodies LLC.
- Labcorp Drug Development
- LifeSpan BioSciences Inc
- GenScript
Recent Developments
- In November 2023, Abcam plc successfully completed the acquisition of AbCellerate, a prominent player in the in vitro pharmacology services sector, for a total of £35 million. This strategic move by Abcam significantly broadens its portfolio within the drug discovery market while simultaneously reinforcing its presence in the custom antibody services segment.
- In October 2023, Bio-Rad Laboratories Inc. made waves with the introduction of its groundbreaking Precision Ab platform. Leveraging cutting-edge machine learning capabilities, this platform revolutionizes the design and optimization of custom antibodies, promising quicker turnaround times and superior antibody quality compared to traditional methodologies.
- In September 2023, Kaneka Eurogentec S.A. embarked on a strategic collaboration with Sengenics Corporation, a distinguished provider of humanized antibody development solutions. This partnership enables Kaneka Eurogentec to extend its service offerings by granting clients access to Sengenics’ innovative antibody humanization technologies.
Report Scope
| Report Features | Description |
|---|---|
| Market Value (2023) | USD 549 Mn |
| Forecast Revenue (2033) | USD 1361 Mn |
| CAGR (2024-2033) | 9.5% |
| Base Year for Estimation | 2023 |
| Historic Period | 2018-2022 |
| Forecast Period | 2024-2033 |
| Report Coverage | Revenue Forecast, Market Dynamics, COVID-19 Impact, Competitive Landscape, Recent Developments |
| Segments Covered | By Type (Monoclonal Antibodies, Polyclonal Antibodies, Recombinant Antibodies, Other Types), By Service (Antibody Development, Antibody Production & Purification, Antibody Fragmentation, Antibody Labeling, Other Services), By Source (Mice, Rabbit, Other Sources), By Application (Oncology, Infectious Diseases, Neurology, Immunology, Cardiovascular Diseases, Other Applications), By End-user (Pharmaceutical & Biotechnology Companies, Academic & Research Institutes, Hospitals And Clinics, Other End-Users) |
| Regional Analysis | North America – The US, Canada, & Mexico; Western Europe – Germany, France, The UK, Spain, Italy, Portugal, Ireland, Austria, Switzerland, Benelux, Nordic, & Rest of Western Europe; Eastern Europe – Russia, Poland, The Czech Republic, Greece, & Rest of Eastern Europe; APAC – China, Japan, South Korea, India, Australia & New Zealand, Indonesia, Malaysia, Philippines, Singapore, Thailand, Vietnam, & Rest of APAC; Latin America – Brazil, Colombia, Chile, Argentina, Costa Rica, & Rest of Latin America; Middle East & Africa – Algeria, Egypt, Israel, Kuwait, Nigeria, Saudi Arabia, South Africa, Turkey, United Arab Emirates, & Rest of MEA |
| Competitive Landscape | Abcam plc, Thermo Fisher Scientific Inc., Creative Diagnostics, Bio-Rad Laboratories Inc, Kaneka Eurogentec S.A., YenZym Antibodies LLC., Labcorp Drug Development, LifeSpan BioSciences Inc, GenScript |
| Customization Scope | Customization for segments, region/country-level will be provided. Moreover, additional customization can be done based on the requirements. |
| Purchase Options | We have three licenses to opt for: Single User License, Multi-User License (Up to 5 Users), Corporate Use License (Unlimited User and Printable PDF) |
Frequently Asked Questions (FAQ)
The Custom Antibody Services market size is USD 549 million in 2023.
The Custom Antibody Services market is expected to grow at a CAGR of 9.5% (2024-2033).
Market.US has segmented the Custom Antibody Services market by geographic (North America, Europe, APAC, South America, and Middle East and Africa). By Type (Monoclonal Antibodies, Polyclonal Antibodies, Recombinant Antibodies, Other Types), By Service (Antibody Development, Antibody Production & Purification, Antibody Fragmentation, Antibody Labeling, Other Services), By Source (Mice, Rabbit, Other Sources), By Application (Oncology, Infectious Diseases, Neurology, Immunology, Cardiovascular Diseases, Other Applications), By End-user (Pharmaceutical & Biotechnology Companies, Academic & Research Institutes, Hospitals And Clinics, Other End-Users)
Abcam plc, Thermo Fisher Scientific Inc., Creative Diagnostics, Bio-Rad Laboratories Inc, Kaneka Eurogentec S.A., YenZym Antibodies LLC., Labcorp Drug Development, LifeSpan BioSciences Inc, GenScript
North America is expected to account for the highest revenue share of 45% and boasting an impressive market value of USD 269 million. Therefore, the Custom Antibody Services industry in North America is expected to garner significant business opportunities over the forecast period.
The US, Canada, India, China, UK, Japan, & Germany are key areas of operation for the Custom Antibody Services Market.


