
Global Connected TVs Market Size, Share and Analysis Report By Panel Type (LCD, OLED, QLED), By Screen Size (32 Inches, 32–40 Inches, 40–48 Inches, 48–55 Inches, 55–65 Inches, Above 65 Inches), By Smart Features (Voice Control, Gesture Control, Content Streaming, Gaming, Smart Home Integration, Others), By Operating System (Android TV, Tizen OS, webOS, Fire TV OS, Roku OS, Others), By Connectivity Feature (Wi-Fi, Bluetooth, Ethernet, HDMI, USB, Others), By Regional Analysis, Global Trends and Opportunity, Future Outlook By 2025-2035
- Published date: Feb. 2026
- Report ID: 178509
- Number of Pages: 325
- Format:
-
keyboard_arrow_up
Quick Navigation
- Report Overview
- Top Market Takeaways
- By Panel Type: OLED
- By Screen Size: 32-40 Inches
- By Smart Features: Voice Control
- By Operating System: Android TV
- By Connectivity Feature: Wi-Fi
- By Geography: North America
- Increasing Adoption Technologies
- Investment Opportunities
- Emerging Trends Analysis
- Opportunity Analysis
- Drivers Impact Analysis
- Restraint Impact Analysis
- Key Market Segments
- Investor Type Impact Matrix
- Technology Enablement Analysis
- Competitive Analysis
- Recent Developments
- Report Scope
Report Overview
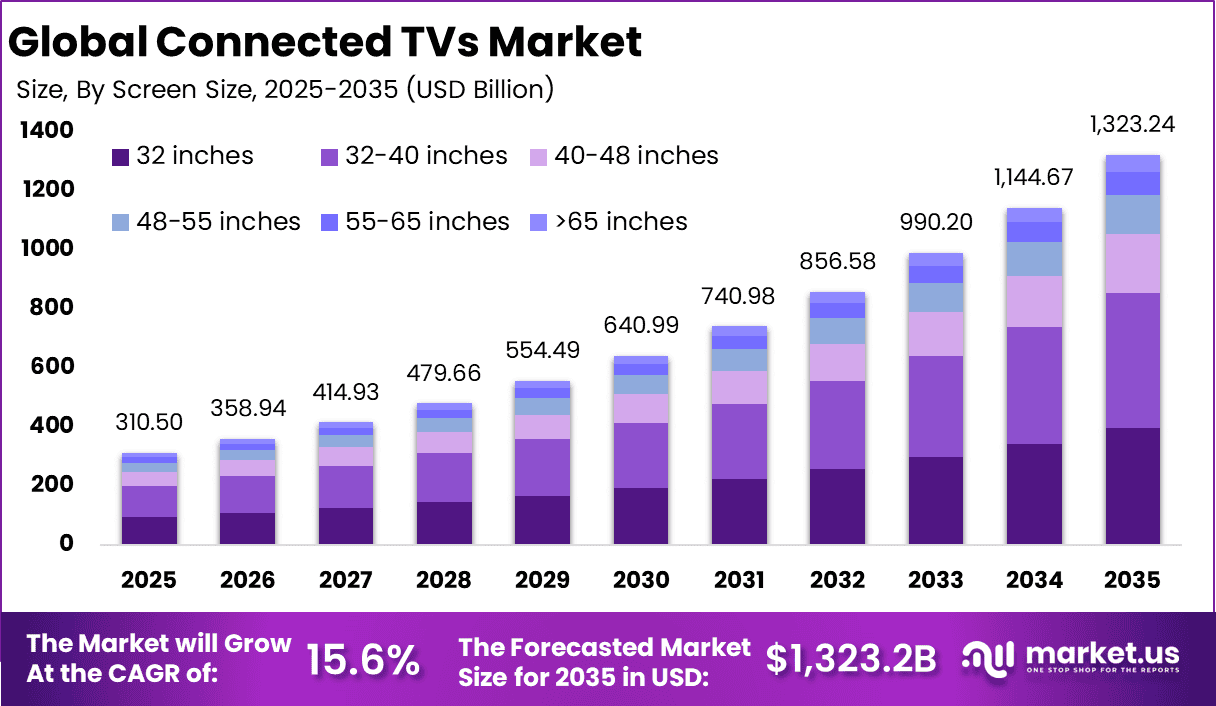
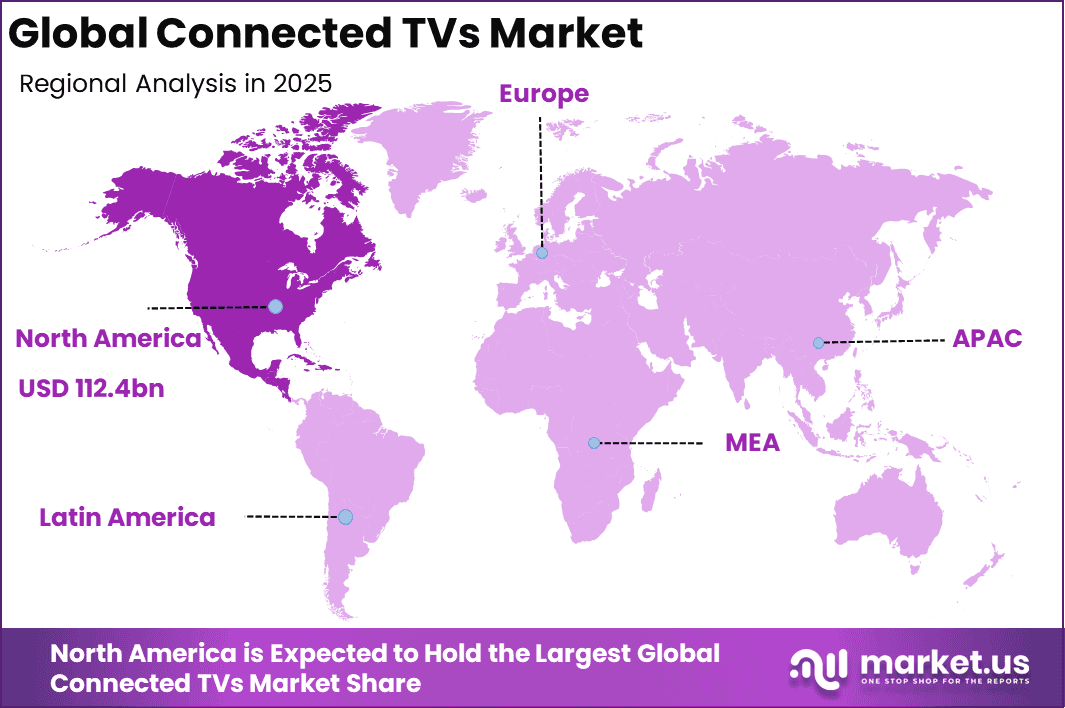
The Global Connected TVs Market size is expected to be worth around USD 1,323.2 Billion By 2035, from USD 310.5 billion in 2025, growing at a CAGR of 15.6% during the forecast period from 2026 to 2035. North America held a dominant Market position, capturing more than a 36.2% share, holding USD 112.4 Billion revenue.
The connected TVs market refers to television devices that connect to the internet and support online content streaming and interactive services. These televisions combine traditional broadcast capabilities with internet access to deliver video on demand, applications, and multimedia content. The market is driven by consumer demand for digital entertainment, personalization, and access to diverse content libraries. As online streaming services expand, connected TVs have become central to the home entertainment ecosystem.
Connected TVs enable users to stream content from a variety of platforms without the need for external media players. These devices often integrate smart software interfaces that support apps, voice control, and personalized recommendations. The ability to update features over the internet extends the lifespan and value of connected TVs. Consumer preferences for smart home integration and digital experiences shape the market trajectory and adoption patterns.
One of the principal driving factors for the connected TVs market is the rapid increase in online video consumption. Viewers are shifting from traditional broadcast television toward streaming services that provide flexibility in viewing choices. This shift has created significant demand for televisions capable of delivering internet-enabled content. Manufacturers are responding by embedding smart capabilities into a large portion of new TV models.
According to Aidigital, as of 2024, approximately 115 million U.S. households, representing around 88%, owned at least one connected TV device. This reflects a substantial increase compared to roughly 50% household penetration recorded a decade earlier, indicating steady adoption of internet enabled television platforms.
In total, about 234 million individuals in the United States used connected TV in 2024, accounting for 70.5% of the overall population. The scale of viewership highlights the continued shift toward digital streaming environments and reinforces the importance of CTV as a primary channel for content distribution and advertising engagement.
Demand for connected TVs is shaped by evolving consumer entertainment habits that favor on-demand content. Users are increasingly subscribing to multiple streaming services to access diverse movies, series, and live content. Connected TVs simplify access to these services with built-in apps and intuitive interfaces. The convenience of a single device that supports both traditional channels and streaming apps fosters stronger consumer demand.
Top Market Takeaways
- OLED panels accounted for 60.7% share, reflecting strong consumer preference for superior picture quality, contrast, and energy efficiency.
- Screen sizes between 32 to 40 inches held 34.7% share, supported by high demand in mid sized households and urban apartments.
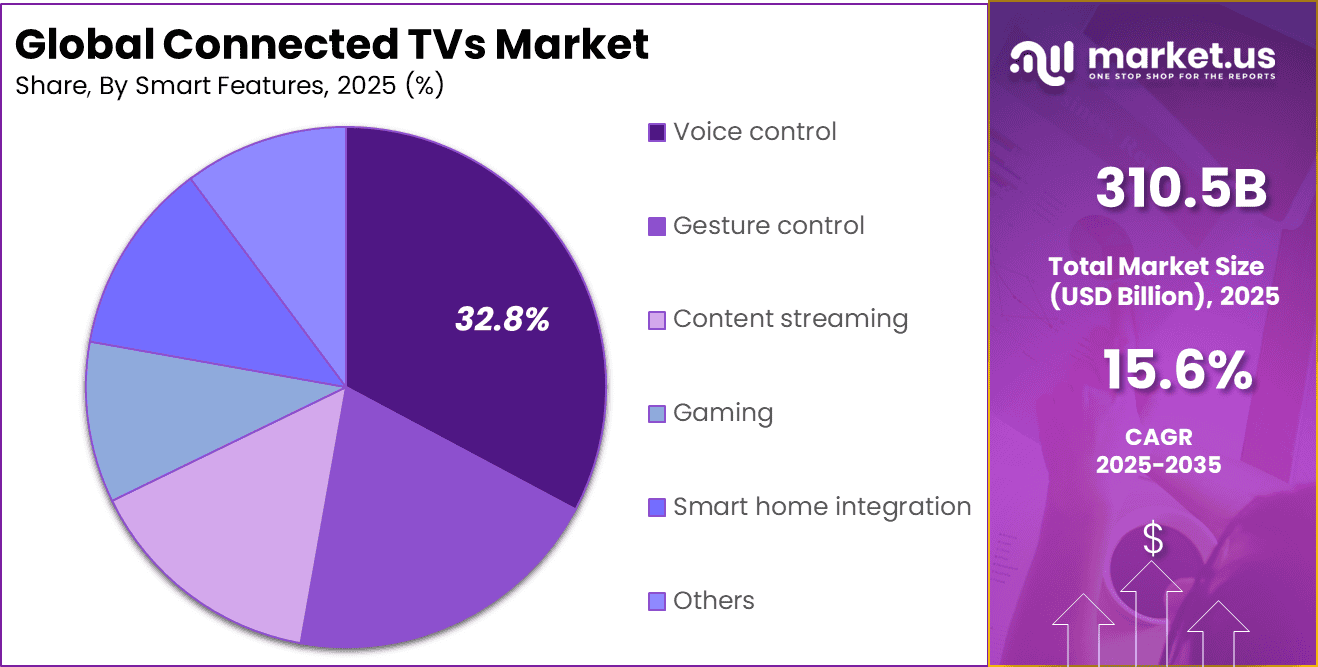
- Voice control features represented 32.8% adoption, driven by increasing integration of smart assistants and hands free functionality.
- Android TV captured 30.0% share among operating systems, supported by its open ecosystem and wide application compatibility.
- Wi Fi connectivity accounted for 35.5% share, reflecting the growing need for seamless streaming and internet enabled entertainment.
- North America held 36.2% of the global market, supported by high broadband penetration and strong streaming consumption trends.
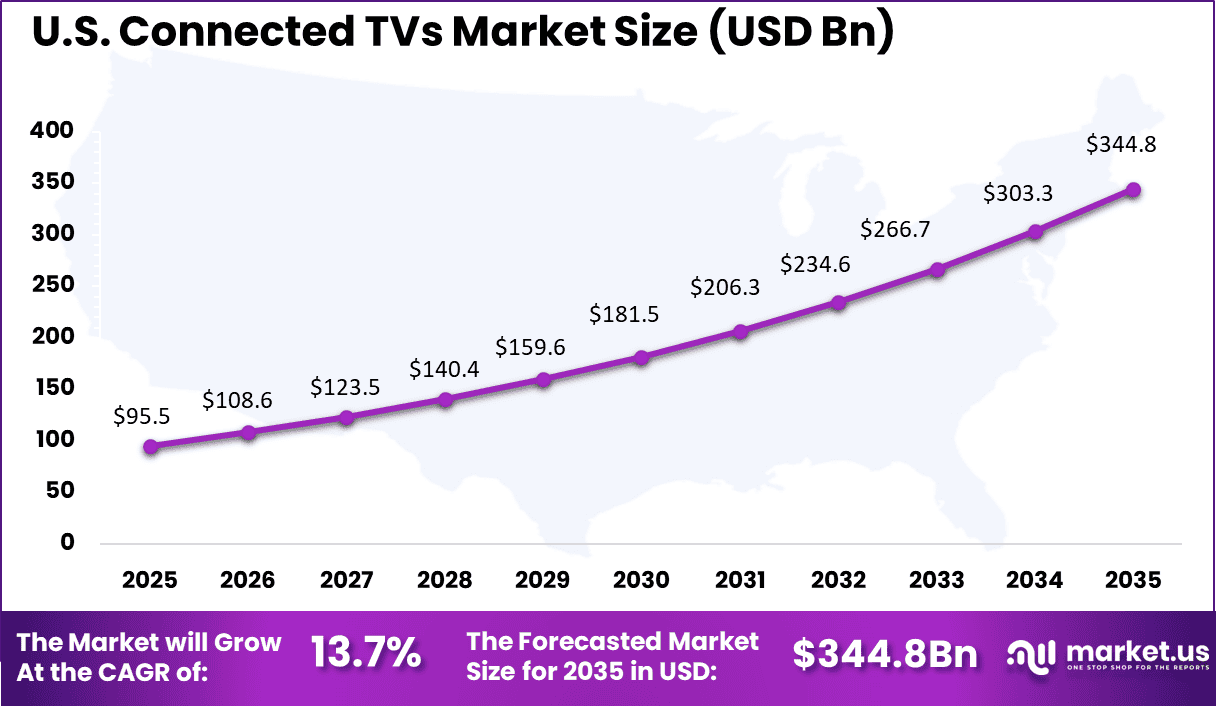
- The United States generated USD 95.54 billion in revenue and is expanding at a 13.7% CAGR, driven by rising smart home adoption and content subscription growth.
By Panel Type: OLED
OLED panels account for 60.7% of the connected TVs market, reflecting strong consumer preference for superior display quality. OLED technology delivers deeper contrast levels, enhanced color accuracy, and thinner screen designs. As streaming platforms increasingly offer high-definition and ultra-high-definition content, demand for premium viewing experiences has intensified. Consumers are willing to invest in advanced panel technologies that provide immersive home entertainment.
Manufacturers continue to refine OLED production processes to improve durability and brightness performance. Energy efficiency and design flexibility also support wider adoption across premium television segments. The segment’s dominance indicates that picture quality remains a decisive factor in purchase decisions. As content consumption shifts toward cinematic streaming and gaming, OLED panels maintain a leading position.
By Screen Size: 32-40 Inches
The 32-40 inch category holds 34.7% share, driven by demand for compact yet feature-rich televisions. This size range is particularly suitable for urban households, bedrooms, and secondary viewing spaces. Consumers in emerging and developed markets alike favor televisions that balance affordability and performance. The segment remains attractive due to practical installation requirements and competitive pricing.
Mid-sized screens also align with rising adoption of smart functionality in entry-level and mid-tier devices. Many consumers prioritize connectivity and streaming capabilities over ultra-large screen formats. Retail distribution channels often promote this category due to its broad appeal. As housing patterns shift toward smaller living spaces in metropolitan regions, this segment continues to maintain steady demand.
By Smart Features: Voice Control
Voice control represents 32.8% of smart feature adoption, highlighting the growing role of hands-free interaction in home entertainment systems. Consumers increasingly expect seamless integration between televisions and digital assistants. Voice-enabled controls simplify content search, application navigation, and smart home integration. This functionality enhances convenience and user engagement.
The growth of voice-based interfaces is supported by improvements in natural language recognition and multilingual capabilities. Integration with connected home ecosystems further strengthens this segment. As consumers adopt more smart devices, centralized voice control through televisions becomes practical. The feature is gradually evolving from an added benefit to a standard expectation.
By Operating System: Android TV
Android TV accounts for 30.0% share, supported by its open ecosystem and broad application compatibility. The platform enables access to a wide range of streaming services and applications through integrated app stores. Manufacturers benefit from flexible customization options and software updates. This operating system also supports integration with mobile devices and other smart technologies.
User familiarity with the Android ecosystem contributes to steady adoption rates. Seamless synchronization with smartphones and smart home devices enhances overall user experience. The platform’s adaptability across price segments strengthens its market presence. As content ecosystems expand, operating system flexibility remains a competitive factor.
By Connectivity Feature: Wi-Fi
Wi-Fi connectivity holds 35.5% share, reflecting its essential role in enabling streaming and application access. Wireless connectivity eliminates the need for complex cabling setups within households. High-speed broadband adoption has directly influenced the expansion of connected TV usage. Stable Wi-Fi performance supports uninterrupted streaming of high-resolution content.
Advancements in wireless standards continue to improve bandwidth and reduce latency. Consumers increasingly rely on wireless networks for gaming, streaming, and content sharing. Integration with routers and mesh systems enhances coverage across larger homes. As digital content consumption grows, Wi-Fi remains a core connectivity feature.
By Geography: North America
North America represents 36.2% of the connected TVs market, supported by high digital media consumption and broadband penetration. Households in the region demonstrate strong adoption of streaming services and smart home technologies.
The United States contributes significantly, with a market value of USD 95.54 Bn and a CAGR of 13.7%. Consumer demand is driven by preference for advanced display technology and integrated smart features. Regional growth is supported by established retail networks and strong consumer purchasing power. Continuous upgrades in home entertainment systems sustain replacement demand.
Increasing Adoption Technologies
Technological advancements have supported broader adoption of connected TVs by enhancing performance and usability. Improvements in display technologies, such as high definition and ultra high definition panels, elevate the viewing experience. These enhancements attract consumers seeking superior image quality for streaming content. Manufacturers are also incorporating advanced processors that improve responsiveness and support complex applications.
Another important technology driving adoption is the integration of smart operating systems and app ecosystems. Operating platforms that support a wide range of streaming services and features make connected TVs more versatile. Voice recognition and AI-based recommendations further personalize content delivery. These technological enhancements improve user interaction and contribute to increased adoption rates.
Consumers adopt connected TVs to gain direct access to internet-based entertainment without additional devices. This integration reduces hardware requirements and simplifies setup in home environments. Users appreciate the convenience of accessing streaming platforms, music apps, and interactive services through a single interface. The adoption aligns with broader preferences for integrated and connected home technology.
Another key reason for adoption is ongoing software support and feature updates. Connected TVs can receive new functions and security improvements over time through internet updates. This capability extends device longevity and maintains relevance with evolving digital services. The ability to keep pace with content provider innovations reinforces the value of connected TVs for consumers.
Investment Opportunities
Investment opportunities in the connected TVs market can be found in hardware innovation and software ecosystems. Manufacturers that develop high performance displays and efficient smart platforms are positioned to meet growing consumer expectations. There are also opportunities to invest in content distribution partnerships that expand the appeal of connected TVs. Such collaborations can enhance device attractiveness and support market penetration.
Another area for investment is application development tailored for connected TV environments. Developers that create engaging, optimized experiences for large screen interfaces can improve content accessibility. Investment in services that support seamless connectivity and integration with smart home setups also has potential. As consumer demand continues to grow, investments in both technology development and supporting services are likely to yield sustained value.
Emerging Trends Analysis
A prominent trend shaping the Connected TVs market is the growing adoption of advanced display and platform technologies that enhance viewing experiences and integrate entertainment with smart home ecosystems. Connected TVs increasingly support features such as 4K and 8K resolution, AI-enabled discovery tools, voice assistants, and cross-device content synchronization, responding to consumer demand for immersive and interactive content consumption.
These enhancements enable devices to serve not only as screens for streaming services but also as central hubs within connected households, supporting broader digital lifestyles. This convergence of entertainment and smart home functionality is expected to drive further differentiation among device manufacturers. In addition to technology upgrades, digital advertising is emerging as a significant influence on market evolution.
Connected TV platforms are becoming important channels for targeted advertising owing to their ability to combine traditional television reach with internet-based data analytics. Advertising models that leverage user preferences and viewing behavior allow marketers to deliver personalized ad experiences, shifting a portion of ad budgets toward connected TV channels. This trend is reshaping how content monetization and audience engagement strategies are developed across media ecosystems.
Opportunity Analysis
A significant opportunity in the Connected TVs market is emerging from the integration of advanced advertising ecosystems that connect traditional television viewing with digital performance platforms. Strategic collaborations between connected TV manufacturers and advertising technology providers are enabling the deployment of data driven, measurable ad solutions that extend beyond the hardware environment. This integration supports more targeted campaign execution and improved attribution across devices.
Further opportunities emerge from expanding markets in developing regions with increasing internet access and growing consumer interest in digital media. As broadband infrastructure improves and streaming services proliferate, the appeal of connected TVs rises even in price-sensitive economies. Manufacturers and service providers that tailor offerings to local preferences, content needs, and affordability can capture incremental growth.
Drivers Impact Analysis
Driver Impact on CAGR Forecast (~%) Geographic Relevance Impact Timeline Expansion of OTT Streaming Platforms +3.1% North America, Europe, Asia Pacific Immediate to Medium Term Growth in Programmatic CTV Advertising +2.6% North America Short to Medium Term Increasing Smart Home Ecosystem Integration +2.0% North America, Asia Pacific Medium Term Rising 4K and 8K Content Availability +1.5% Global Medium Term Affordable Smart TV Pricing +1.1% Asia Pacific, Latin America Immediate Restraint Impact Analysis
Restraint Impact on CAGR Forecast (~%) Geographic Relevance Impact Timeline Content Fragmentation and Subscription Fatigue -2.2% North America, Europe Short Term Supply Chain and Semiconductor Constraints -1.6% Global Short to Medium Term Data Privacy and Advertising Regulations -1.1% Europe, North America Medium Term Price Sensitivity in Emerging Markets -0.8% Latin America, Africa Immediate Platform Ecosystem Competition -0.5% Global Ongoing Key Market Segments
By Panel Type
- LCD
- OLED
- QLED
By Screen Size
- 32 inches
- 32-40 inches
- 40-48 inches
- 48-55 inches
- 55-65 inches
- >65 inches
By Smart Features
- Voice control
- Gesture control
- Content streaming
- Gaming
- Smart home integration
- Others
By Operating System
- Android TV
- Tizen OS
- webOS
- Fire TV OS
- Roku OS
- Others
By Connectivity Feature
- Wi-Fi
- Bluetooth
- Ethernet
- HDMI
- USB
- Others
Regional Analysis and Coverage
- North America
- US
- Canada
- Europe
- Germany
- France
- The UK
- Spain
- Italy
- Russia
- Netherlands
- Rest of Europe
- Asia Pacific
- China
- Japan
- South Korea
- India
- Australia
- Singapore
- Thailand
- Vietnam
- Rest of Latin America
- Latin America
- Brazil
- Mexico
- Rest of Latin America
- Middle East & Africa
- South Africa
- Saudi Arabia
- UAE
- Rest of MEA
Investor Type Impact Matrix
Investor Type Impact on CAGR Forecast (~%) Geographic Relevance Investment Horizon Consumer Electronics Manufacturers +2.4% Global Long Term Media and Streaming Companies +2.0% North America, Europe Medium Term Digital Advertising Firms +1.5% North America Short to Medium Term Private Equity in Smart Hardware +1.0% Asia Pacific Medium Term Venture Capital in CTV Adtech +0.7% North America Medium Term Technology Enablement Analysis
Technology Enabler Impact on CAGR Forecast (~%) Geographic Relevance Impact Timeline AI Based Content Recommendation Engines +2.8% Global Immediate Advanced Programmatic Advertising Platforms +2.3% North America Short Term 5G and High Speed Broadband Penetration +1.9% Asia Pacific, North America Medium Term Cloud Based Smart TV Operating Systems +1.4% Global Medium Term Voice and Smart Assistant Integration +0.9% North America, Europe Immediate Competitive Analysis
Global television manufacturers such as Samsung Electronics, LG Electronics, Sony Corporation, Panasonic Corporation, and Philips dominate the connected TVs market. These companies integrate smart operating systems, voice control, and streaming services into high-resolution displays. Their focus on OLED and QLED technologies enhances picture quality and user experience. Demand is driven by rising OTT consumption and home entertainment upgrades.
Emerging and value-focused manufacturers such as TCL Technology, Xiaomi Corporation, Hisense Group, Skyworth, Sharp Electronics, and Haier Group expand adoption through competitive pricing and integrated smart features. These vendors benefit from strong distribution in Asia Pacific and emerging markets. Adoption is supported by affordable large-screen options and smart ecosystem compatibility.
Platform-centric and streaming ecosystem players such as Roku strengthen the software layer of connected TVs. These platforms offer content aggregation, advertising integration, and user analytics. Manufacturers increasingly partner with operating system providers to enhance app availability and monetization models. Other vendors contribute to innovation in display technology and smart connectivity. This competitive landscape supports sustained growth in connected TV adoption globally.
Top Key Players in the Market
- Samsung Electronics
- LG Electronics
- Sony Corporation
- Panasonic Corporation
- Philips
- TCL Technology
- Xiaomi Corporation
- Hisense Group
- Sharp Electronics
- Roku
- Skyworth
- Haier Group
- Others
Recent Developments
- December, 2025 – Samsung Electronics expanded its 2026 Connected TV lineup with AI-powered Neo QLED 8K models featuring Neural Quantum Processor 8K and AI Motion Enhancer Pro, targeting premium home theater upgrades while growing its Tizen OS ecosystem with Matter-enabled smart home integration.
- November, 2025 – TCL Technology reported 2025 global CTV shipments up 8% to 28.5 million units, driven by Google TV adoption on Roku TCL and Mini LED models, capturing 12.8% U.S. market share while launching 110-inch QD-Mini LED for luxury segment.
- October, 2025 – Sony Corporation refreshed Bravia 9 QLED with XR Backlight Master Drive and Cognitive Processor XR, emphasizing IMAX Enhanced certification and PlayStation 5 optimization to defend premium positioning as Google TV gains Android TV converts.
Report Scope
Report Features Description Market Value (2025) USD 310.5 Bn Forecast Revenue (2035) USD 1,323.2 Bn CAGR(2026-2035) 15.6% Base Year for Estimation 2025 Historic Period 2020-2024 Forecast Period 2026-2035 Report Coverage Revenue forecast, AI impact on Market trends, Share Insights, Company ranking, competitive landscape, Recent Developments, Market Dynamics and Emerging Trends Segments Covered By Panel Type (LCD, OLED, QLED), By Screen Size (32 Inches, 32–40 Inches, 40–48 Inches, 48–55 Inches, 55–65 Inches, Above 65 Inches), By Smart Features (Voice Control, Gesture Control, Content Streaming, Gaming, Smart Home Integration, Others), By Operating System (Android TV, Tizen OS, webOS, Fire TV OS, Roku OS, Others), By Connectivity Feature (Wi-Fi, Bluetooth, Ethernet, HDMI, USB, Others) Regional Analysis North America – US, Canada; Europe – Germany, France, The UK, Spain, Italy, Russia, Netherlands, Rest of Europe; Asia Pacific – China, Japan, South Korea, India, New Zealand, Singapore, Thailand, Vietnam, Rest of Latin America; Latin America – Brazil, Mexico, Rest of Latin America; Middle East & Africa – South Africa, Saudi Arabia, UAE, Rest of MEA Competitive Landscape Samsung Electronics, LG Electronics, Sony Corporation, Panasonic Corporation, Philips, TCL Technology, Xiaomi Corporation, Hisense Group, Sharp Electronics, Roku, Skyworth, Haier Group, Other Customization Scope Customization for segments, region/country-level will be provided. Moreover, additional customization can be done based on the requirements. Purchase Options We have three license to opt for: Single User License, Multi-User License (Up to 5 Users), Corporate Use License (Unlimited User and Printable PDF) 
-
-
- Samsung Electronics
- LG Electronics
- Sony Corporation
- Panasonic Corporation
- Philips
- TCL Technology
- Xiaomi Corporation
- Hisense Group
- Sharp Electronics
- Roku
- Skyworth
- Haier Group
- Others
Our Clients
- 178509
- Feb. 2026


