


Report Overview
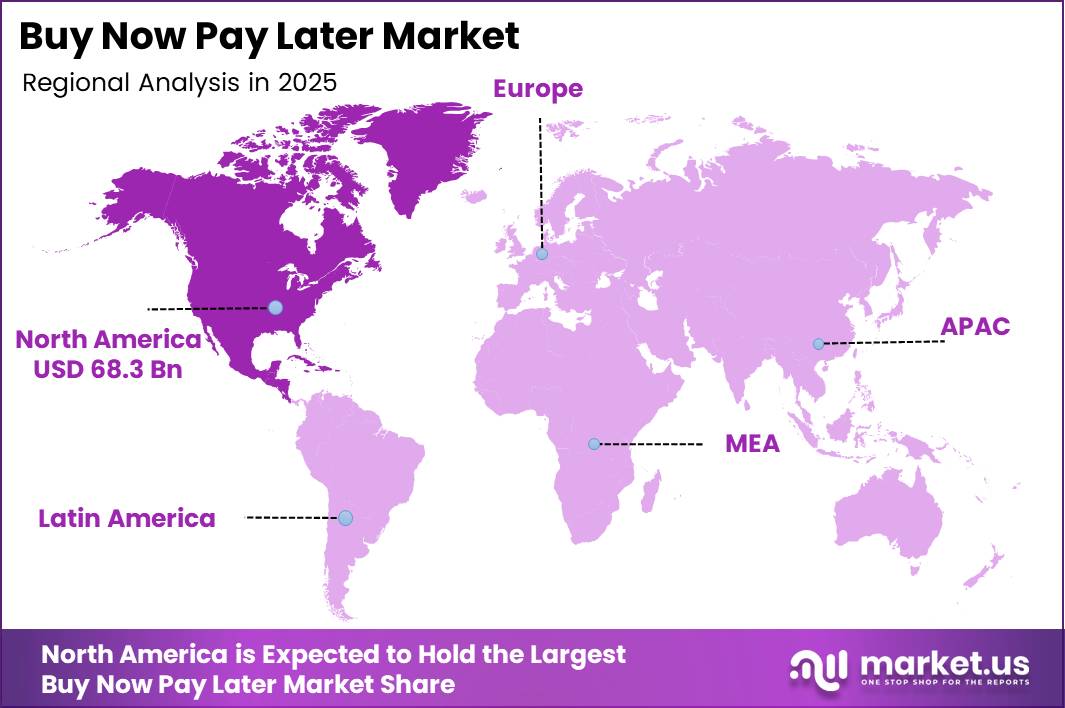
In 2025, the Global Buy Now Pay Later Market was valued at USD 235.6 billion. The market is projected to grow at a CAGR of 22.3% during 2026–2035, reaching approximately USD 1,182.8 billion by 2035. North America dominated the global market in 2025, accounting for more than 29.0% of the total market share and generating approximately USD 68.3 billion in revenue.
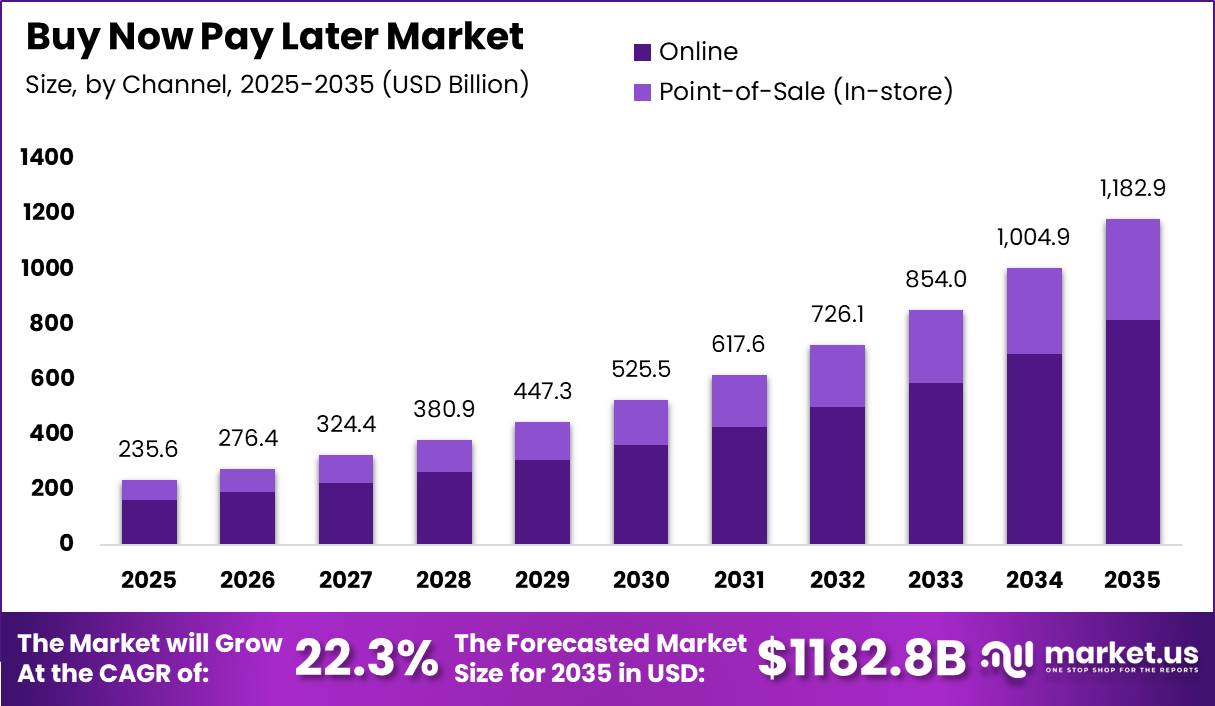
This strong expansion is supported by the rapid growth of digital payments, e-commerce, mobile applications, and consumer credit services. BNPL solutions are increasingly integrated into online checkout systems and digital wallets, allowing providers to benefit directly from rising online transaction volumes. Global e-commerce sales reached nearly USD 6.4 trillion in 2025, representing around 20% of total retail transactions worldwide. Even a 5–6% BNPL share of online payments could generate hundreds of billions of dollars in financed purchases.
North America accounted for the largest share of global revenue in 2025. The region benefits from high online spending, widespread card usage, developed fintech infrastructure, and strong merchant adoption of instalment payment services. The United States remains a major contributor due to its large e-commerce market and growing use of embedded finance solutions across retail, travel, healthcare, and everyday purchases.
PayPal reported that its BNPL total payment volume exceeded USD 25 billion in 2024, increasing by approximately 30% year-on-year. This performance shows how quickly BNPL services can expand when connected to established digital wallets and merchant networks. As more consumer spending moves online, every increase in BNPL adoption can add tens of billions of dollars in transaction value, supporting the market’s expected rise beyond USD 1.1 trillion by 2035.
Key Takeaway
- The BNPL market was valued at USD 235.6 billion in 2025 and is projected to reach USD 1182.8 billion by 2035, growing at a CAGR of 22.3%.
- The online channel accounted for 69% of the BNPL market due to direct checkout integration.
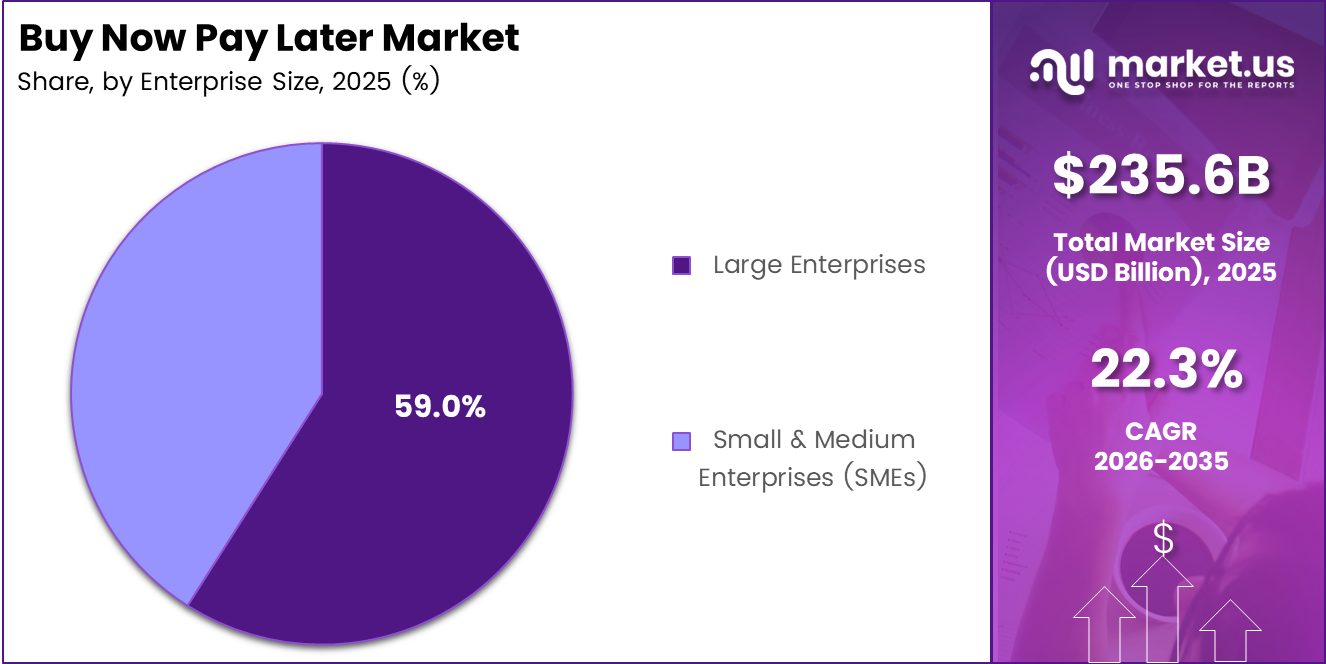
- Large enterprises accounted for approximately 59% of BNPL adoption, while SMEs are the fastest-growing customer segment.
- Retail accounted for approximately 75.9% of BNPL end-use adoption, while healthcare is the fastest-growing end-use segment.
- Millennials aged 29–44 accounted for approximately 46% of BNPL usage, while Generation Z is the fastest-growing age segment.
- Fintech providers accounted for approximately 59% of the BNPL market, while banks are the fastest-growing provider segment.
- North America led the global market in 2025 with over 29.0% share and approximately USD 68.3 billion in revenue.
By Channel
The Online channel accounted for 69% of the BNPL market, mainly because instalment services are directly integrated into website and mobile app checkouts. UNCTAD reported that business e-commerce sales reached approximately USD 27 trillion in 2022 across 43 economies, representing a 25% increase compared with 2019. This value further increased to nearly USD 28 trillion by 2024.
Such large online spending volumes encourage merchants to offer BNPL options to improve purchase completion rates and increase average basket values. The Consumer Financial Protection Bureau reported that BNPL is commonly used through online retailers and lender applications, while BNPL app users spend around 72% more per transaction than regular online shoppers.
Point-of-sale BNPL is also expanding rapidly, with device-based solutions growing at nearly 24% CAGR. This growth is supported by the wider installation of card terminals and QR-based payment systems at physical stores. In advanced economies, cashless payments reached 361 card transactions per person per year in 2024.
By Enterprise Size
Large enterprises accounted for approximately 59% of BNPL adoption because they manage substantial sales volumes and have the resources to integrate instalment payment options across multiple markets and sales channels. In OECD economies, large companies generate nearly 40–50% of total business-sector value added.
Small and medium enterprises are the fastest-growing BNPL customer segment because they continue to face major financing and cash-flow challenges. The global MSME credit gap in developing economies is estimated at approximately USD 5.2 trillion, equal to nearly 19% of their combined GDP.
Broader estimates covering formal and informal MSMEs range from USD 2.1–2.6 trillion. SMEs represent more than 99% of businesses and around 60% of employment in many economies, but only about 27% report access to a loan.
By End-Use Industry
Retail accounted for approximately 75.9% of BNPL end-use adoption, supported by its widespread use across fashion, electronics, household products, and other everyday consumer purchases. Globally, retail generates more than 70% of BNPL revenue because the sector combines high transaction volumes with strong consumer demand for flexible payment options.
Retailers promote BNPL at online and physical checkouts to improve sales conversion, reduce cart abandonment, and increase average order value, which can rise by around 15–40%. Consumers also use instalment plans to purchase higher-priced goods while managing short-term cash flow more effectively.
Healthcare is the fastest-growing BNPL end-use segment, with device-based solutions expanding at nearly 21% CAGR. Growth is driven by rising out-of-pocket expenses for dental care, optical services, fertility treatment, elective procedures, medicines, and other medical needs. CFPB data showed that health and everyday necessity categories increased their share of BNPL gross merchandise value from 1.5% in 2019 to 8.8% in 2021.
Transaction value across everyday spending categories also rose from USD 3.2 million to USD 229.2 million during the same period. By allowing patients to divide medical bills into smaller instalments, BNPL improves payment affordability and supports stronger adoption across clinics, hospitals, pharmacies, and digital healthcare platforms.
By Age Group
Millennials aged 29–44 accounted for approximately 46% of BNPL usage, supported by their strong purchasing power, high digital shopping activity, and preference for flexible credit. In the United States, consumers aged 25–44 represent more than half of BNPL users, including 24% in the 25–34 group and 31% in the 35–44 group.
Younger Millennials aged 25–33 are more than 2 times as likely as the average adult to use BNPL and over-index by 102% in lender portfolios. Older Millennials aged 34–40 over-index by 61%. This group commonly uses BNPL for housing needs, family expenses, travel, and retail purchases valued between USD 100 and USD 1,000.
Generation Z consumers aged 18–28 represent the fastest-growing BNPL segment, with device-based usage expanding at nearly 25.1% CAGR. Around 37% of adults aged 18–24 financed at least 1 purchase through BNPL in 2022, nearly 2 times the participation rate of older groups. BNPL usage among 18–24-year-olds has also exceeded 60% in some countries.
By Provider
Fintech providers accounted for approximately 59% of the BNPL market because they entered the sector early and developed digital-first platforms for e-commerce websites, mobile applications, and digital wallets. Specialist providers such as Afterpay, Klarna, and Affirm collectively processed an estimated USD 316 billion in BNPL spending in 2023, with this value projected to reach nearly USD 450 billion by 2027.
These companies offer simple onboarding, instant credit checks, and app-based repayment systems that can be easily integrated into merchant checkout pages. Fintech BNPL also provides measurable benefits to retailers, as one study found that offering instalment payments increased purchase incidence by around 9 percentage points and raised average basket size by approximately 10%.
Banks are the fastest-growing BNPL provider segment, with device-based solutions expanding at nearly 21% CAGR. Around 21% of U.S. consumers with a credit record used BNPL at least once in 2022, compared with 18% in 2021. Banks and card networks are responding by launching card-based instalment plans and BNPL services within mobile banking applications.
Key Market Segments
By Channel
- Online
- Point-of-Sale (In-store)
By Enterprise Size
- Large Enterprises
- Small & Medium Enterprises (SMEs)
By End-Use Industry
- Retail
- Consumer Electronics
- Fashion & Garment
- Others
- Healthcare
- Leisure & Entertainment
- Automotive
- Home Improvement
- Media & Entertainment
- Others
By Age Group
- Generation Z (18-28 Years)
- Millennials (29-44 Years)
- Generation X (45-60 Years)
- Baby Boomers (61-79 Years)
- Silent Generation (80 Years and Above)
By Provider
- Fintechs
- Banks (Fastest Growing)
- Others
Geopolitical Impact Analysis
Rising geopolitical tensions are increasing the cost and uncertainty of the supply chains supporting BNPL purchases, particularly across consumer electronics, fashion, and household goods. IMF data showed that traffic through the Bab al-Mandab Strait fell to 46% of its previous-year level by January 2024, while Suez Canal passages declined to 63%.
Ship diversions around the Cape of Good Hope increased by 70%, extending Asia–Europe delivery routes. Rerouting a typical Far East–Europe round trip can add around 20 sailing days, increase fuel use by approximately 33%, and raise total voyage costs by as much as USD 1.7 million. Avoiding the Suez Canal can also add nearly USD 272 per 40-foot container.
Trade policy uncertainty, particularly between the United States and China, is also changing electronics supply chains. U.S. duties on major electronics categories under HS 84 and HS 85 increased from low single digits through additional Section 301 tariffs of 7.5–25% on several Chinese products. This encouraged manufacturers to shift production toward Vietnam, Malaysia, and other ASEAN economies.
The U.S. trade deficit with China in these categories declined by around USD 70 billion, while its deficit with ASEAN increased by approximately USD 80 billion. This included a USD 21 billion rise in laptop and tablet imports and a USD 24 billion increase in processors, displays, and integrated circuits. These shifts raise inventory and working-capital risks, strengthening merchant demand for BNPL across online and physical stores.
Regional Analysis
North America held a dominant position in the global Buy Now Pay Later market, accounting for approximately 29.0% of total revenue and reaching an estimated value of USD 68.3 billion in 2025. The region’s leadership is supported by high online spending, widespread credit card use, developed digital wallet infrastructure, and strong merchant adoption of embedded instalment services.
Major e-commerce platforms and omnichannel retailers across the United States and Canada integrate BNPL options directly into websites, mobile applications, and checkout systems. This allows consumers to divide purchases into short-term payments across retail, travel, healthcare, and other everyday services, generating high transaction volumes for BNPL providers.
Asia Pacific is expected to be the fastest-growing regional market, driven by increasing smartphone ownership, expanding e-commerce activity, and wider adoption of digital payments. Markets such as China, India, Indonesia, and other Southeast Asian countries have large consumer populations that increasingly use mobile wallets, super-apps, and online shopping platforms.
Key Regions and Countries
North America
- US
- Canada
Europe
- Germany
- France
- The UK
- Spain
- Italy
- Rest of Europe
Asia Pacific
- China
- Japan
- South Korea
- India
- Australia
- Rest of APAC
Latin America
- Brazil
- Mexico
- Rest of Latin America
Middle East & Africa
- GCC
- South Africa
- Rest of MEA
Market Dynamics
Drivers
| Driver | (~) % CAGR | Geographic Relevance | Impact Timeline |
|---|---|---|---|
| Rapid e-commerce & digital payments adoption | +4.0% | Global | Short term (2 years or less) |
| Embedded BNPL in wallets & super-apps | +3.0% | North America, Asia Pacific, Europe | Medium term (2 to 4 years) |
| Retailers seeking higher conversion & basket size | +2.5% | Global | Short term (2 years or less) |
| Bank & card-network entry into BNPL | +1.5% | North America, Europe | Medium term (2 to 4 years) |
| Expansion into non-retail verticals | +1.3% | Global | Long term (4 years or more) |
Rapid e-commerce & digital payments adoption
UNCTAD reported that global business e-commerce sales reached around USD 27 trillion in 2022, increasing by roughly 25% from pre-pandemic levels and continuing to expand through 2025. World Bank Global Findex data also show that the share of adults making digital payments rose from about 35% in 2014 to nearly 57% in 2021, while several advanced economies exceeded 90%.
Household internet access in advanced economies now surpasses 85%, and mobile broadband subscriptions exceed 100 per 100 inhabitants. This allows BNPL providers to reach consumers through online and mobile channels at very low distribution cost. By converting a larger share of digital checkout transactions into short-term instalment plans, these trends could add an estimated 4.0 percentage points to the baseline CAGR.
Restraints
| Restraint | (~) % CAGR | Geographic Relevance | Impact Timeline |
|---|---|---|---|
| High interest-rate environment & funding costs | -3.5% | Global | Short term (2 years or less) |
| Tightening consumer-credit regulation | -2.8% | North America, Europe | Medium term (2 to 4 years) |
| Elevated default rates in certain cohorts | -2.0% | Global (more acute in emerging markets) | Short term (2 years or less) |
| Limited profitability of pure-play BNPL models | -1.7% | Global | Medium term (2 to 4 years) |
| Bank & card competition compressing merchant fees | -1.5% | North America, Europe | Long term (4 years or more) |
High interest-rate environment & funding costs
Average policy rates across advanced economies increased by roughly 300 basis points between 2021 and 2024. The U.S. federal funds rate remained within a 5.0–5.5% range, while several European benchmark rates exceeded 3%. This raised funding costs for BNPL providers that depend on bank credit lines, securitisations, and wholesale financing.
Consumer credit funding spreads also widened by around 80–120 basis points, while charge-off rates for non-prime instalment loans increased from approximately 2% to more than 3.5% in some markets. BNPL companies generally earn merchant fees in the mid-single-digit percentage of gross merchandise value while offering many interest-free consumer plans.
Higher borrowing costs and credit losses therefore reduce margins and limit aggressive expansion. Providers may tighten approval standards, increase minimum purchase values, and reduce exposure to higher-risk customers. Overall, the elevated interest-rate environment could create an estimated 3.5-percentage-point negative impact on the baseline CAGR as companies prioritise profitability and funding stability over transaction growth.
Challenges
| Challenge | (~) % CAGR | Geographic Relevance | Mitigation Horizon |
|---|---|---|---|
| Complex multi-jurisdiction compliance | -2.7% | Global | Medium term (2 to 4 years) |
| Credit-risk modelling thin-file users | -2.2% | Emerging markets, younger cohorts | Long term (4 years or more) |
| Merchant integration & legacy IT constraints | -1.8% | Global | Medium term (2 to 4 years) |
| Consumer awareness & financial literacy gaps | -1.5% | Global (more acute in emerging markets) | Long term (4 years or more) |
| Data privacy & cross-border data rules | -1.3% | Europe, Asia Pacific | Medium term (2 to 4 years) |
Complex multi-jurisdiction compliance
More than 60 jurisdictions now apply specific rules or supervisory guidance to short-term credit and BNPL products. Requirements differ across the European Union, the United Kingdom, and the United States, particularly for affordability checks, credit disclosures, late fees, and dispute handling. Some emerging economies also score below 50 out of 100 for regulatory predictability, increasing the risk of sudden policy changes.
This fragmented environment forces BNPL providers to maintain different products, legal processes, and compliance systems across markets. It can add several percentage points to operating expenses, increase legal and customer-service staffing, and delay new product launches by several quarters. Overall, regulatory complexity may create an estimated 2.7-percentage-point negative impact on potential CAGR by shifting investment away from expansion and toward compliance infrastructure.
Opportunities
| Opportunity | (~) % CAGR | Geographic Relevance | Execution Window |
|---|---|---|---|
| BNPL embedded into everyday bill payments | +3.2% | Global | Medium term (2 to 4 years) |
| Expansion into healthcare & education fees | +2.5% | North America, Europe, Asia Pacific | Long term (4 years or more) |
| SME-focused BNPL for B2B purchases | +2.0% | Global (especially emerging markets) | Medium term (2 to 4 years) |
| Bank–fintech partnerships & white-label BNPL | +1.8% | Global | Short term (2 years or less) |
| Integration with loyalty & subscription models | +1.5% | Global | Long term (4 years or more) |
BNPL embedded into everyday bill payments
World Bank data show that households in many economies spend more than 30–40% of their budgets on recurring costs such as utilities, telecom services, rent, and insurance. Most of these payments still use direct debit, cash, or standard cards without instalment options. Meanwhile, digital wallet and account-to-account bill payments are growing by around 15–20% annually, while some Asia Pacific markets have recorded more than 50% year-on-year growth in instant payments.
Late-payment rates among lower-income customers can reach 5–10%, while collection costs account for low-single-digit shares of billed revenue. Allowing customers to divide bills into 3–6 instalments could reduce arrears, improve customer retention, and lower collection expenses. At scale, recurring-payment BNPL could add around 3.2 percentage points to the baseline CAGR and improve contribution margins by several percentage points compared with retail-focused BNPL portfolios.
Key Players Analysis
Tier-1 BNPL companies include Klarna, Afterpay, Affirm, and PayPal, which collectively handle a major share of global transaction volume. Klarna generated approximately USD 2.8 billion in revenue in 2024, held nearly 48% of Europe’s BNPL market, and represented more than 70% of global BNPL website integrations.
Its estimated global app-based volume share was around 25–30%. Afterpay processed nearly USD 27.3 billion in annual payments and generated USD 1.04 billion in revenue and USD 755 million in gross profit in 2023, giving it a low-to-mid-teens global volume share. Affirm’s revenue increased from USD 1.14 billion in 2023 to USD 1.66 billion for the fiscal year ending June 30, 2024. Its merchant and card network revenue exceeded USD 600 million, while its estimated U.S. issuance share reached 10–12%.
PayPal supports instalment products across more than 400 million active accounts and signed an agreement covering approximately USD 7 billion of Pay in 4 loans over 2 years. Tier-2 providers generally record below USD 500 million in annual revenue and hold low-single-digit global shares.
Zip generated AUD 632 million, or around USD 410 million, in FY2023, while Sezzle reported mid-single-digit-billion merchandise volume and nearly USD 140 million in revenue. Many challengers invest a high-single-digit revenue share in technology while targeting default rates of 2–3%. Over the next 3–5 years, leading regional providers could capture 3–5% shares in their domestic markets.
Top Key Players in the Market
- Klarna
- Afterpay
- Affirm, Inc.
- PayPal
- Zip Co., Ltd.
- Sezzle
- Splitit Payments, Ltd.
- Zilch
- Laybuy
- Atome
- Kredivo
- Akulaku PayLater
- Tamara
- Tabby
- Alma
- Riverty
- Sunbit
- Uplift
- Citizens Pay
- Revolut Pay Later
- Perpay Inc.
- Openpay
- LatitudePay Financial Services
Recent Developments
- In February 2026, the UK Financial Conduct Authority finalised rules for Deferred Payment Credit, commonly known as BNPL, which took effect on 15 July 2026. Third-party BNPL lenders must now hold FCA authorisation or temporary permission, conduct proportionate affordability checks, provide clearer borrowing information, and give customers access to the Financial Ombudsman Service and applicable Section 75 protection.
- In November 2025, PayPal and KKR renewed their European BNPL financing partnership through a replenishing loan commitment of up to EUR 6 billion. The agreement allows KKR-managed funds to purchase up to EUR 65 billion of eligible PayPal BNPL receivables originated in France, Germany, Italy, Spain, and the United Kingdom through March 2028, supporting PayPal’s balance-sheet-light growth strategy.
- In March 2025, Klarna partnered with OnePay to exclusively power instalment loans for Walmart customers in the United States. The service was designed for Walmart’s online and physical checkout channels, allowing approved customers to select repayment periods ranging from 3 to 36 months.
Report Scope
| Report Features | Description |
|---|---|
| Market Value (2025) | USD 235.6 Billion |
| Forecast Revenue (2035) | USD 1,182.8 Billion |
| CAGR (2026-2035) | 22.3% |
| Base Year for Estimation | 2025 |
| Historic Period | 2020-2024 |
| Forecast Period | 2026-2035 |
| Report Coverage | Revenue Forecast, Market Dynamics, Competitive Landscape, Recent Developments |
| Segments Covered | By Channel (Online, Point-of-Sale); By Enterprise Size (Large Enterprises, SMEs); By End-Use Industry (Retail, Healthcare, Leisure & Entertainment, Automotive, Home Improvement, Media & Entertainment, Others); By Age Group (Generation Z, Millennials, Generation X, Baby Boomers, Silent Generation); By Provider (Fintechs, Banks, Others) |
| Regional Analysis | North America – US, Canada; Europe – Germany, France, The UK, Spain, Italy, Rest of Europe; Asia Pacific – China, Japan, South Korea, India, Australia, Singapore, Rest of APAC; Latin America – Brazil, Mexico, Rest of Latin America; Middle East & Africa – GCC, South Africa, Rest of MEA |
| Competitive Landscape | Klarna, Afterpay, Affirm, Inc., PayPal, Zip Co., Ltd., Sezzle, Splitit Payments, Ltd., Zilch, Laybuy, Atome, Kredivo, Akulaku PayLater, Tamara, Tabby, Alma, Riverty, Sunbit, Uplift, Citizens Pay, Revolut Pay Later, Perpay Inc., Openpay, LatitudePay Financial Services |
| Customization Scope | Customization for segments, region/country-level will be provided. Moreover, additional customization can be done based on the requirements. |
| Purchase Options | We have three licenses to opt for: Single User License, Multi-User License (Up to 5 Users), Corporate Use License (Unlimited Users and Printable PDF) |





























