


Report Overview
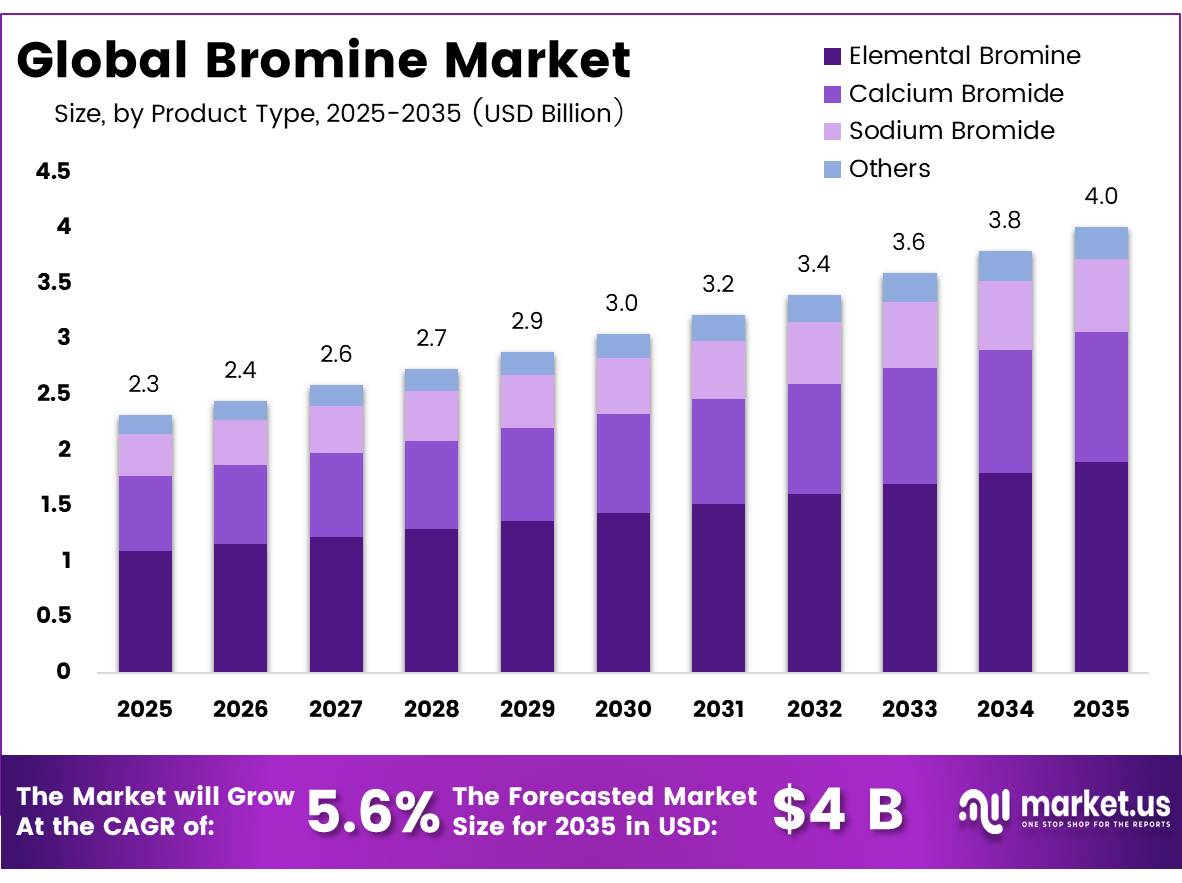
In 2025, the Global Bromine Market was valued at USD 2.3 billion, and between 2026 and 2035, this market is estimated to register a CAGR of 5.6%, reaching about USD 4 billion by 2035. In 2025, Europe held a dominant market position, capturing more than a 42.7% share, holding USD 0.99 Billion revenue.
The global bromine market is projected to grow from approximately US$2.3 billion to US$4.0 billion, supported by steady demand from electronics, construction, oil and gas drilling, and power generation industries. Brominated flame retardants (BFRs) remain the largest application segment, widely used in electronic devices, printed circuit boards, cables, insulation materials, and building components. Demand is being reinforced by the rapid expansion of electronics manufacturing worldwide.
- According to the UN Global E-waste Monitor 2024, global e-waste reached 62 million metric tons in 2022 and is expected to increase to 82 million metric tons by 2030, reflecting the growing production and consumption of electronic products that require flame-retardant materials. The construction sector is another major demand driver, particularly in Europe, where the industry employs around 15 million people and contributes nearly 10% of regional GDP.
- Strict fire-safety regulations continue to support the use of bromine-based flame retardants in insulation, wiring, and construction materials. Reflecting this strong industrial demand, global bromine production increased from about 400,000 metric tons in 2024 to nearly 430,000 metric tons in 2025.
On the supply side, production remains concentrated around the Dead Sea region. Israel increased bromine output from approximately 140,000 metric tons in 2024 to 200,000 metric tons in 2025, while Jordan recorded strong production growth and China maintained output at around 90,000–100,000 metric tons. Beyond flame retardants, bromine demand is supported by the oil and gas industry, where calcium bromide and zinc bromide clear brine fluids are essential for deep-well drilling operations.
Global upstream oil and gas investment exceeded US$600 billion in 2024, creating sustained demand for these products. Additional consumption comes from mercury emission control systems used in coal-fired power plants. With coal still accounting for more than 40% of global electricity generation and environmental regulations becoming stricter, bromine-based technologies continue to gain importance. These diverse demand sources across multiple industries provide a strong foundation for the market’s forecast CAGR of 5.6% during the outlook period.
Key Takeaways
- The global Bromine market was valued at USD 2.3 billion in 2025.
- The global Bromine market is projected to grow at a CAGR of 5.6% and is estimated to reach USD 4 billion by 2035.
- On the basis of product type, Elemental Bromine dominated the market, constituting 47.3% of the total market share.
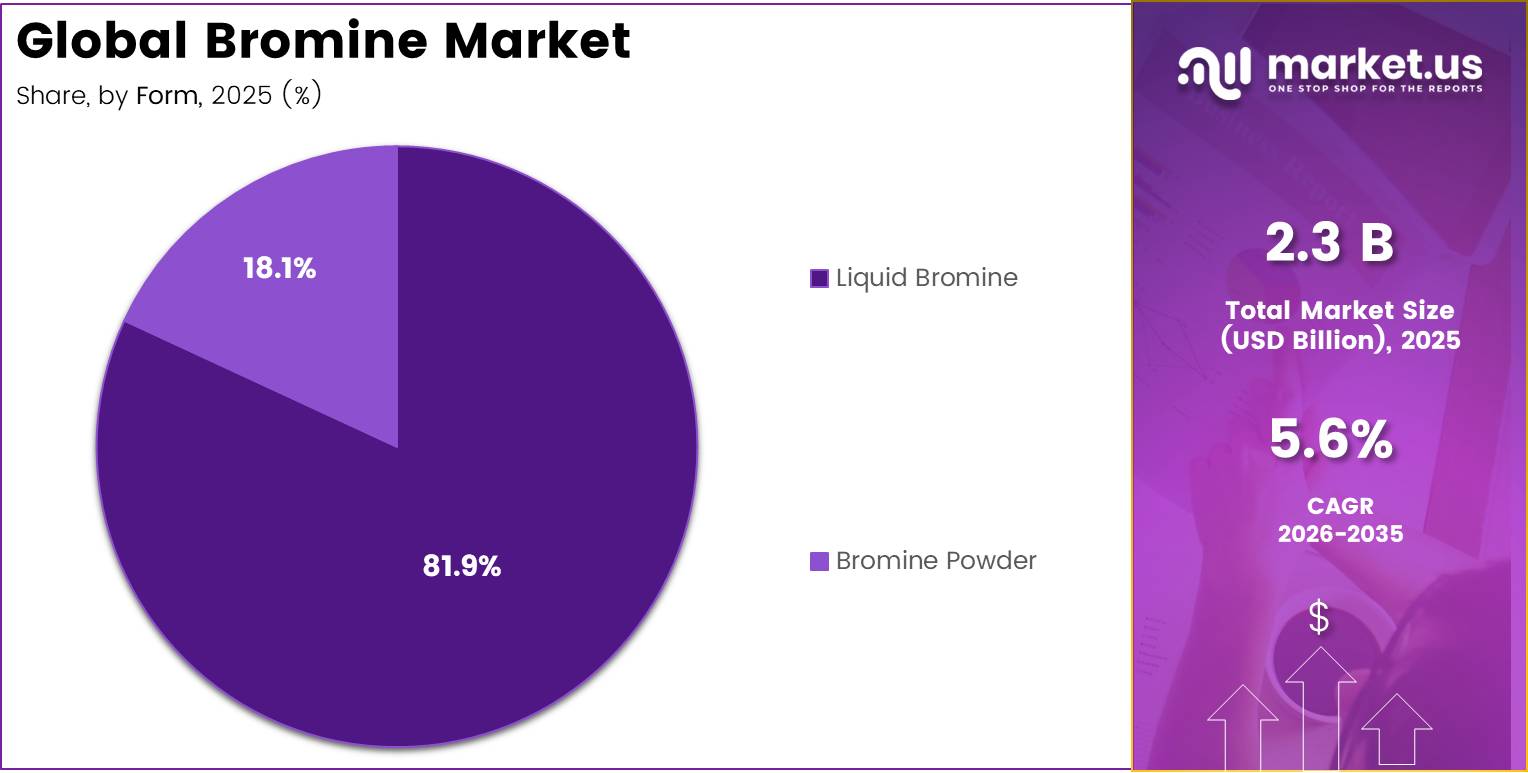
- Based on the form, the liquid Bromine dominated the Bromine market, with a substantial market share of around 81.9%.
- Among the end-uses, the Chemical industry held a major share in the Bromine market, 31.8% of the market share.
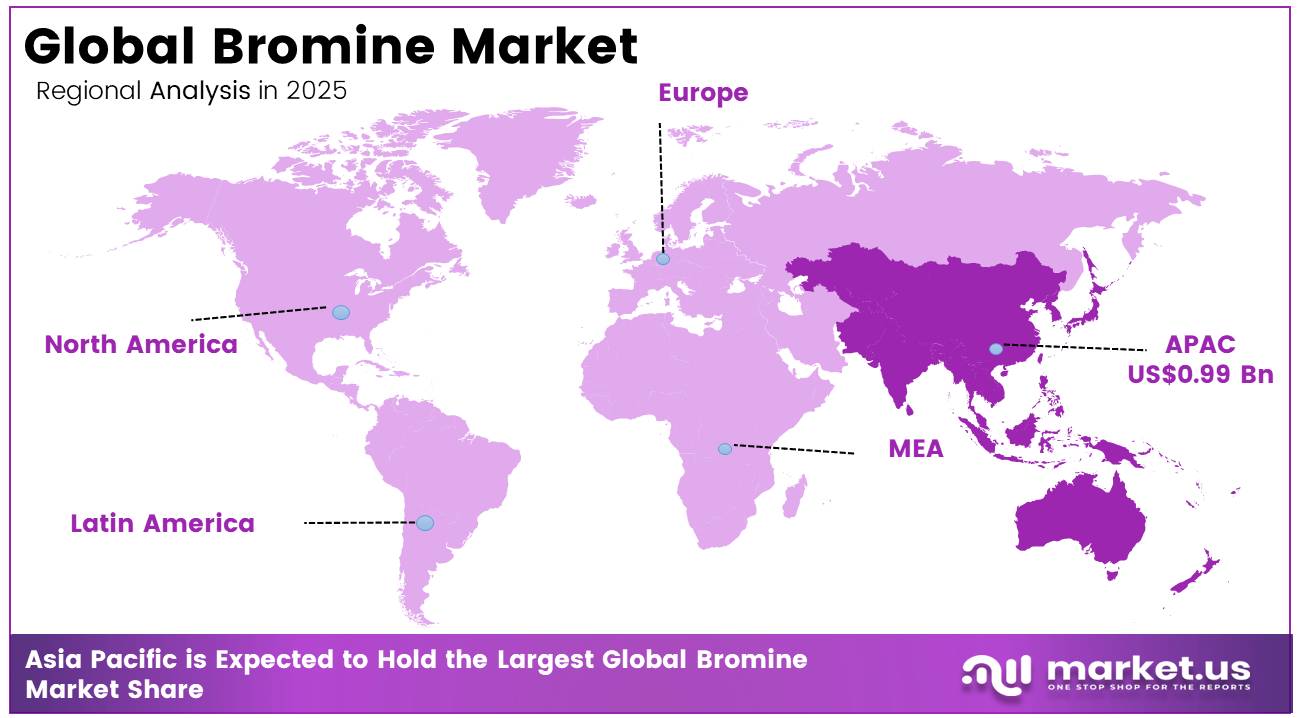
- In 2025, the Asia Pacific was the most dominant region in the Bromine market, accounting for 42.7% of the total global consumption.
Product Type Analysis
Elemental Bromine represents dominant Segment in the Market.
Elemental bromine dominates the global bromine market, holding a 47.3% share by product type, underpinned by its role as the primary raw material from which all downstream bromine derivatives are synthesized. Elemental bromine remains the leading product segment in the global bromine market due to its critical role as the primary raw material for nearly all bromine-based derivatives. Its market leadership is supported by strong demand from brominated flame retardants (BFRs), clear brine drilling fluids, water treatment chemicals, and various industrial intermediates.
According to USGS Mineral Commodity Summaries 2026, brominated flame retardants and clear brine fluids continue to represent the largest end-use applications for bromine worldwide. Global bromine production reached approximately 440,000 metric tons in 2024, with Israel contributing about 190,000 metric tons, making it the world’s largest producer. Trade activity also highlights the importance of elemental bromine, with U.S. imports of bromine and bromine compounds totaling 58,300 metric tons in 2024, the highest level recorded in the past five years. Israel supplied around 89% of U.S. bromine imports through mid-2025, demonstrating the industry’s reliance on a limited number of major producers.
According to the U.S. Energy Information Administration (EIA), U.S. crude oil production averaged a record 13.4 million barrels per day in 2024 and increased further to 13.6 million barrels per day in 2025. The number of active producing wells reached 918,481, while production from the Permian Basin alone climbed to 6.6 million barrels per day. These trends have significantly increased demand for bromide-based completion fluids. Calcium bromide solutions, typically supplied at 52% concentration, are particularly valued in high-pressure and high-temperature well environments.
Form Analysis
Liquid Bromine a significant Form.
Liquid bromine accounted for 81.9% of the global bromine market, making it the leading form segment. This dominance is primarily driven by bromine’s unique physical property as the only non-metallic element that remains liquid at room temperature, which makes it highly suitable for industrial processing, transportation, and end-use applications. The largest bromine-consuming industries, including brominated flame retardants and clear brine drilling fluids, predominantly utilize bromine in liquid form.
The large-scale use of these liquid bromine derivatives continues to support segment leadership. In 2024, global bromine production reached approximately 440,000 metric tons, led by Israel (190,000 MT), Jordan (112,000 MT), and China (100,000 MT). Additionally, U.S. imports of bromine and bromine compounds totaled 58,300 metric tons in 2024, with liquid bromide solutions accounting for the majority of trade volumes. The ease of handling, processing efficiency, and extensive use across key industries are expected to maintain the strong position of liquid bromine in the global market.
Bromine-based treatment technologies have demonstrated mercury reduction efficiencies exceeding 90%, supporting their adoption in environmental compliance programs. Rapid expansion of electronics manufacturing, particularly across Asia-Pacific, combined with stricter fire-safety and environmental regulations worldwide, is creating strong demand for solid bromine compounds. These factors are expected to support the segment’s above-average growth rate over the coming years.
End User Analysis
Bromines Are Mostly Utilized in the Chemical Industry.
The chemical industry accounts for the largest share of global bromine consumption, representing approximately 31.8% of the market. This leadership is supported by bromine’s critical role as a fundamental chemical raw material used across multiple industrial processes.
According to the U.S. Geological Survey (USGS), major bromine applications include brominated flame retardants (BFRs), clear brine fluids, industrial intermediates, and water treatment chemicals. Global bromine production increased from about 395,000 metric tons in 2023 to 400,000 metric tons in 2024, highlighting steady demand growth. Bromine is widely used in the manufacture of flame retardants such as tetrabromobisphenol-A (TBBPA) and decabromodiphenyl oxide, which are essential for electronics, construction materials, textiles, and printed circuit boards.
- According to the American Chemistry Council (ACC), global chemical production volumes grew by 3.5% in 2024 and are projected to rise by another 3.1% in 2025. As chemical manufacturing expands worldwide, bromine remains an indispensable feedstock for a broad range of specialty and industrial chemical products.
The oil and gas industry is the fastest-growing end-use segment. Growth is primarily driven by increasing deepwater and high-pressure drilling activities, which require bromine-based clear brine fluids for well completion and pressure control. The USGS notes that there are no effective substitutes for bromine in these applications, making demand directly linked to drilling activity.
According to the U.S. Energy Information Administration (EIA), crude oil production in the Gulf of America reached 1.77 million barrels per day in 2024 and is expected to increase to 1.80 million barrels per day in 2025 and 1.81 million barrels per day in 2026. The EIA also forecasts 13 new offshore fields entering production during 2025–2026, adding significant new output capacity.
Key Market Segments
By Product Type
- Elemental Bromine
- Calcium Bromide
- Sodium Bromide
- Others
By Form
- Liquid Bromine
- Bromine Powder
By End User Industry
- Chemical
- Oil & Gas
- Electronics & Electrical
- Construction
- Automotive
- Healthcare & Pharmaceuticals
- Agriculture
- Energy & Utilities
- Textile
- Others
Drivers
Energy transition and battery/energy storage chemistries using bromine derivatives
As policymakers in Europe, China, India and North America all set aggressive renewable energy and storage deployment targets with global battery energy storage capacity projected to grow several-fold between 2025 and 2035 there is a white space for non-lithium chemistries to capture niches where safety, cycle life and duration requirements outweigh pure energy density, particularly at substations, industrial sites, and in constrained urban environments. While lithium-ion still dominates near-term deployments, the combination of regulatory concern about fire risk, recycling complexity and critical-mineral dependence is leading public agencies and utilities to explicitly earmark demonstration and procurement budgets for alternative chemistries, including bromine-based systems, over the next decade.
Strategically, this driver can structurally alter portfolio mix: bromine producers positioned to supply electrolyte solutions, develop integrated flow battery platforms or partner with ESS OEMs can shift part of their revenue from bulk commodity sales into higher-margin, contract-backed energy storage value chains, capturing multi-year service and replacement streams alongside initial volumes, and adding roughly 1.5 percentage points of long-term CAGR uplift as even modest market share in the rapidly expanding stationary storage sector translates into meaningful incremental bromine demand.
Drivers Impact Analysis
| Driver | (~) % Impact on CAGR | Geographic Relevance | Impact Timeline |
|---|---|---|---|
| Bromine-based flame retardants demand in electronics, construction and automotive | +2.1% | Asia-Pacific core, North America, EU, South Korea-Japan | Medium term (2-4 years) |
| Clear brine fluids intensity in deep and unconventional oil & gas drilling | +1.8% | North America core, Middle East, China, offshore corridors | Medium term (2-4 years) |
| Energy transition and battery/energy storage chemistries using bromine derivatives | +1.6% | EU, China, North America, India | Long term (≥ 4 years) |
| Water treatment, sanitation and industrial biocides adoption | +1.4% | North America, EU, GCC, China, emerging Asia | Short term (≤ 2 years) |
| Growth in high-value brominated specialty chemicals and pharma intermediates | +1.3% | Asia-Pacific corridors, EU innovation hubs, U.S. | Long term (≥ 4 years) |
| Tight global brine resource base and geopolitically exposed supply centers | +1.2% | China, Israel, Jordan, India, global importers | Medium term (2-4 years) |
Restraints
Geopolitically concentrated bromine brine supply
Geopolitically concentrated bromine brine supply is a core restraint because global capacity is anchored in a narrow band of assets Dead Sea operations in Israel and Jordan, coastal brines in China’s Shandong and a handful of U.S. and Indian fields so any disruption in a single locus can tighten 20–30% of tradable supply and trigger price spikes that cascade into demand destruction, deferred contracts and substitution. Coverage of the 2025–2026 price run-up in China notes that bromine benchmarks jumped from roughly RMB 41,300 per ton at the beginning of March 2026 to over RMB 66,000 by month end, with some spot trades above RMB 72,000, as domestic output lagged, environmental checks slowed production, inventories thinned and Middle East shipping and supply dynamics turned uncertain.
For downstream formulators in flame retardants, CBFs and biocides, such volatility can add 10–20% to raw-material cost over a quarter, forcing them to either raise prices risking volume loss in commoditized segments or absorb margin compression; at the same time, some end users respond by redesigning products to be less bromine-intensive or by dual-qualifying alternative halogenated or mineral systems, locking in structurally lower bromine intensity per unit of output when supply normalizes.
Strategically, producers and major buyers must hold higher safety stocks, commit to multi‑year offtake with price formulas, and diversify brine sources or invest in brownfield debottlenecking, all of which raise working-capital and CAPEX burdens and introduce board-level geopolitical risk into what was once a pure commodity play, shaving around 2 percentage points from otherwise achievable CAGR as some demand is permanently re‑engineered out in response to repeated supply scares and elevated price floors.
Restraint Impact Analysis
| Restraint | (~) % Impact on CAGR | Geographic Relevance | Impact Timeline |
|---|---|---|---|
| Geopolitically concentrated bromine brine supply | -2.0% | APAC importers, EU, Japan, North America | Medium term (2-4 years) |
| Regulatory pressure on brominated flame retardants | -1.9% | EU regulatory hubs, North America, advanced APAC | Long term (≥ 4 years) |
| Environmental compliance and emissions constraints at brine operations | -1.7% | China coastal basins, Israel–Jordan, U.S. | Medium term (2-4 years) |
| Oil & gas drilling activity cyclicality for clear brine fluids | -1.6% | North America core, Middle East, China | Medium term (2-4 years) |
| Substitution and reformulation toward non-brominated chemistries | -1.5% | EU, U.S., Japan, high-spec OEMs | Long term (≥ 4 years) |
| Price volatility and working-capital stress for downstream users | -1.4% | Asia-Pacific corridors, EU, global converters | Short term (≤ 2 years) |
Opportunity
Energy storage and advanced battery bromine chemistries
Zinc–bromine, vanadium–bromine and hybrid bromine flow systems offer multi-hour to multi‑day storage, intrinsic non‑flammability and decoupled power/energy scaling, which is increasingly attractive as global stationary storage is forecast to expand by several hundred GWh between 2025 and 2035 to support renewable integration and grid resilience, yet procurement pipelines today are dominated by lithium-ion chemistries.
A strategic pivot in which bromine producers co‑develop or acquire flow-battery technology, secure 10–20‑year offtake contracts for utility or C&I projects, and offer storage-as-a-service models could transform bromine from a commodity input into a recurring infrastructure revenue stream, with gross margins potentially 2–3 times higher than raw bromine alone while locking in long-dated volume commitments.
If by 2035 even 5–10% of global stationary storage additions adopt bromine‑based chemistries at electrolyte energy densities implying tens of kilograms of bromine per kWh for multi‑hour systems, the incremental bromine demand could represent low‑double‑digit percentages of current market volumes, translating into 1.5–2 percentage points of upside CAGR for integrated players above a baseline forecast that implicitly assumes lithium-ion dominance and treats bromine only as a traditional chemicals input.
Opportunity Impact Analysis
| Opportunity | (~) % Potential CAGR Upside | Geographic Relevance | Execution Window |
|---|---|---|---|
| Energy storage and advanced battery bromine chemistries | +2.0% | EU, China, North America, India | Long term (≥ 4 years) |
| High-purity bromine for semiconductor and electronics chemicals | +1.8% | Japan, South Korea, Taiwan, U.S., EU | Medium term (2-4 years) |
| Circular bromine recovery, recycling and closed-loop sourcing | +1.7% | EU, North America, China, Israel–Jordan | Long term (≥ 4 years) |
| Regionally integrated bromine–derivatives–formulation hubs | +1.6% | APAC corridors, Middle East, India | Medium term (2-4 years) |
| Next-gen water treatment, ballast and industrial biocides platforms | +1.5% | North America, EU, GCC, coastal Asia | Medium term (2-4 years) |
| Strategic M&A and IP-led brominated specialties platforms | +1.4% | North America, EU innovation hubs, APAC | Medium term (2-4 years) |
Challenges
Chronic geopolitical and logistics risk on Middle East–Asia bromine flows
Coverage in early 2026 highlights how a prolonged Hormuz blockade tied to U.S.–Iran tensions impacted shipments of helium and bromine, with some Middle Eastern producers suspending price quotations and transactions becoming “limited,” forcing Japanese and Korean buyers—who rely on Israeli and regional bromine as intermediate materials for semiconductor and specialty chemical chains—to draw down inventories and scramble for alternative cargoes.
Analysts tracking AI‑infrastructure inputs have flagged that Korean chipmakers already source over 95% of certain bromine inputs from Israel, meaning even a few weeks of shipping disruption or insurance restrictions can materially tighten fabs’ material buffers and prompt risk‑management responses such as higher safety stock, multi‑sourcing projects, or localized substitution in some non‑critical applications.
Strategically, the sector must allocate capital to diversified shipping routes, contingency storage, and potentially new production or tolling locations closer to large demand clusters in Asia to reduce route risk, but these investments play out over many years, so geopolitical and logistics frictions continue to exert roughly a 1–1.5 percentage‑point drag on maximum achievable CAGR by keeping planners conservative on forward commitments and incentivizing some OEMs to structurally reduce bromine dependence where feasible.
Challenges Impact Analysis
| Challenge | (~) % CAGR Friction Drag | Geographic Relevance | Mitigation Horizon |
|---|---|---|---|
| Chronic geopolitical and logistics risk on Middle East–Asia bromine flows | -1.3% | APAC importers, EU, Japan, North America | Long term (≥ 4 years) |
| Narrow upstream footprint and operational territory concentration | -1.1% | Israel–Jordan, China coastal basins, U.S. Gulf | Medium term (2-4 years) |
| Evolving tox-eco and regulatory scrutiny across brominated value chains | -1.0% | EU regulatory hubs, North America, OECD | Long term (≥ 4 years) |
| Price and margin volatility for derivatives and downstream converters | -0.9% | Asia-Pacific corridors, EU, global OEM supply chains | Short term (≤ 2 years) |
| Talent and capability gaps in high-spec bromine chemistry and ESG | -0.8% | Global chemical hubs, especially APAC and India | Long term (≥ 4 years) |
| Customer and investor perception risk around bromine sustainability | -0.8% | EU, U.S., Japan, branded OEM ecosystems | Medium term (2-4 years) |
Geopolitical Impact Analysis
Geopolitical Realignment and Supply Chain Fragmentation Reshaping Bromine Manufacturing.
The global bromine market is facing significant supply-side pressure due to its high dependence on production from the Middle East. Israel and Jordan together account for nearly 47% of global bromine production capacity, with Israel contributing more than 33% and Jordan around 14%. Supply disruptions intensified in early 2026 as geopolitical tensions in the region affected operations at major production facilities. At the same time, infrastructure damage caused by severe flooding in southern Jordan reduced production levels, tightening global supply availability.
As a result, bromine prices rose sharply, with China’s benchmark bromine price exceeding RMB 70,000 per ton in April 2026, representing a monthly increase of more than 76% and reaching the highest level recorded in over a decade. The impact was particularly severe in China, where import dependence had increased to 66% by 2025, while bromine production in Shandong Province declined by more than 53% between 2014 and 2025 due to resource depletion and stricter environmental regulations.
Logistics challenges have further increased market volatility and procurement costs. Ongoing disruptions in key maritime trade routes have reduced shipping efficiency, forcing vessels to take longer routes that add roughly 10 days to transit times. Freight rates on major Asia–Europe routes have increased by approximately 256% compared with pre-crisis levels, significantly raising transportation expenses for bromine and bromine derivatives.
In addition, continued trade tensions between the United States and China, including chemical-sector tariffs that remained around 55% after the 2025 tariff adjustment, have increased costs for downstream manufacturers. The combination of supply concentration, elevated logistics expenses, and trade policy uncertainty has strengthened bromine price levels globally and increased the importance of supply diversification and strategic inventory planning for industries such as electronics, energy storage, flame retardants, pharmaceuticals, and oilfield chemicals.
Regional Analysis
Asia Pacific Held the Largest Share of the Global Bromine Market.
The Asia Pacific dominates the global bromine market with a 42.7% share, thanks to its big production capacities and high consumption. As the USGS Mineral Commodity Summaries 2025 states, in 2024, China led with about 100,000 metric tons, up from 70,000 in 2020. Japan and India chimed in with roughly 20,000 and 7,000 metric tons respectively. This trio drives Asia Pacific’s leadership in both production and use. China’s bustling electronics and chemical manufacturing industry demands loads of brominated flame retardants. These are used in printed circuit boards, insulation materials, and other industrial stuff, strengthening the region’s lead in bromine consumption.
North America stands out as the fastest-growing region. Big increases in oil and gas production fuel this growth; brominated completion fluids are crucial here. In 2025, U.S. crude oil output hit a peak of 13.6 million barrels a day, as confirmed by the U.S. Energy Information Administration.
Key Regions and Countries Covered
- North America
- The US
- Canada
- Europe
- Germany
- France
- The UK
- Spain
- Italy
- Russia & CIS
- Rest of Europe
- APAC
- China
- Japan
- South Korea
- India
- ASEAN
- Rest of APAC
- Latin America
- Brazil
- Mexico
- Rest of Latin America
- Middle East & Africa
- GCC
- South Africa
- Rest of MEA
Key Players Analysis
Bromine manufacturers zero in on boosting resource security, diversifying downstream products, and ramping up operational efficiency to stay competitive in a market that’s getting more consolidated. One big priority is creating high-value bromine derivatives like specialized flame retardants, clear brine fluids, biocides, and energy storage chemicals. These derivatives perform better in various industrial and environmental uses. To boost bromine output, cut production costs, and use resources better, firms keep pouring money into advanced extraction and recovery tech.
To solidify their market position and expand in fast-growing application areas, manufacturers focus on optimizing processes, sticking to environmental rules, and fortifying their supply chains. They forge long-term deals with industrial end users too. So, all these moves help them stay ahead in a pretty competitive space.
The Major Players In The Industry
- ICL Group Ltd.
- Albemarle Corporation
- LANXESS AG
- Tosoh Corporation
- TETRA Technologies Inc.
- TATA Chemicals Ltd.
- Hindustan Salts Ltd.
- Honeywell International Inc.
- Gulf Resources Inc.
- Agrocel Industries Pvt Ltd.
- Satyesh Brinechem Pvt. Ltd.
- Other Key Players
Key Development
- February 2026, Albemarle reported that its Specialties segment, which includes bromine and derivatives, generated USD 1.366 billion in 2025 sales, up 3%, while adjusted EBITDA increased 21% to USD 275.7 million.
- March 2026, Tosoh’s Organic Chemicals division, which includes bromine, hydrobromic acid and brominated flame retardants, generated sales of ¥74.9 billion, compared with ¥74.3 billion in fiscal 2025, representing an increase of ¥0.6 billion.
Report Scope
| Report Features | Description |
|---|---|
| Market Value (2025) | USD 2.3 Bn |
| Forecast Revenue (2035) | USD 4.0 Bn |
| CAGR (2026-2035) | 5.6% |
| Base Year for Estimation | 2025 |
| Historic Period | 2020-2024 |
| Forecast Period | 2026-2035 |
| Report Coverage | Revenue Forecast, Market Dynamics, Competitive Landscape, Recent Developments |
| Segments Covered | By Product Type (Elemental Bromine, Calcium Bromide, Sodium Bromide and Others), By Form (Liquid Bromine and Bromine Powder), By End User Industry (Nylon, Polyethylene (PE), Polypropylene (PP), Ceramic, and Others), By End user (Chemical, Oil & Gas, Electronics & Electrical, Construction, Automotive, Healthcare & Pharmaceuticals, Agriculture, Energy & Utilities, Textile and Others) |
| Regional Analysis | North America – The US & Canada; Europe – Germany, France, The UK, Spain, Italy, Russia & CIS, Rest of Europe; APAC– China, Japan, South Korea, India, ASEAN & Rest of APAC; Latin America– Brazil, Mexico & Rest of Latin America; Middle East & Africa– GCC, South Africa, & Rest of MEA |
| Competitive Landscape | ICL Group Ltd., Albemarle Corporation, LANXESS AG, Tosoh Corporation, TETRA Technologies Inc., TATA Chemicals Ltd., Hindustan Salts Ltd., Honeywell International Inc., Gulf Resources Inc., Agrocel Industries Pvt Ltd., Satyesh Brinechem Pvt. Ltd., Other Key Players |
| Customization Scope | Customization for segments, region/country-level will be provided. Moreover, additional customization can be done based on the requirements. |
| Purchase Options | We have three licenses to opt for: Single User License, Multi-User License (Up to 5 Users), Corporate Use License (Unlimited Users and Printable PDF) |





































