


Report Overview
Global Automotive Display System Market size is expected to be worth around USD 34.0 Billion by 2035 from USD 16.4 Billion in 2025, growing at a CAGR of 7.6% during the forecast period 2026 to 2035.
The automotive display system market covers all in-vehicle visual interface hardware and software used to communicate driving, navigation, safety, and infotainment data to drivers and passengers. This includes instrument clusters, center stack displays, head-up displays, rear-seat entertainment screens, rear-view mirror displays, and portable navigation devices. The market spans both OEM-integrated and aftermarket installation channels across passenger and commercial vehicle types.
Key Takeaways
- Market value in 2025: USD 16.4 Billion
- Forecast market value by 2035: USD 34.0 Billion
- CAGR from 2026 to 2035: 7.6%
- Dominant technology segment: TFT-LCD with 48.9% share
- Dominant display size segment: Between 6″ to 10″ with 44.2% share
- Dominant application segment: Center Stack Display with 36.4% share
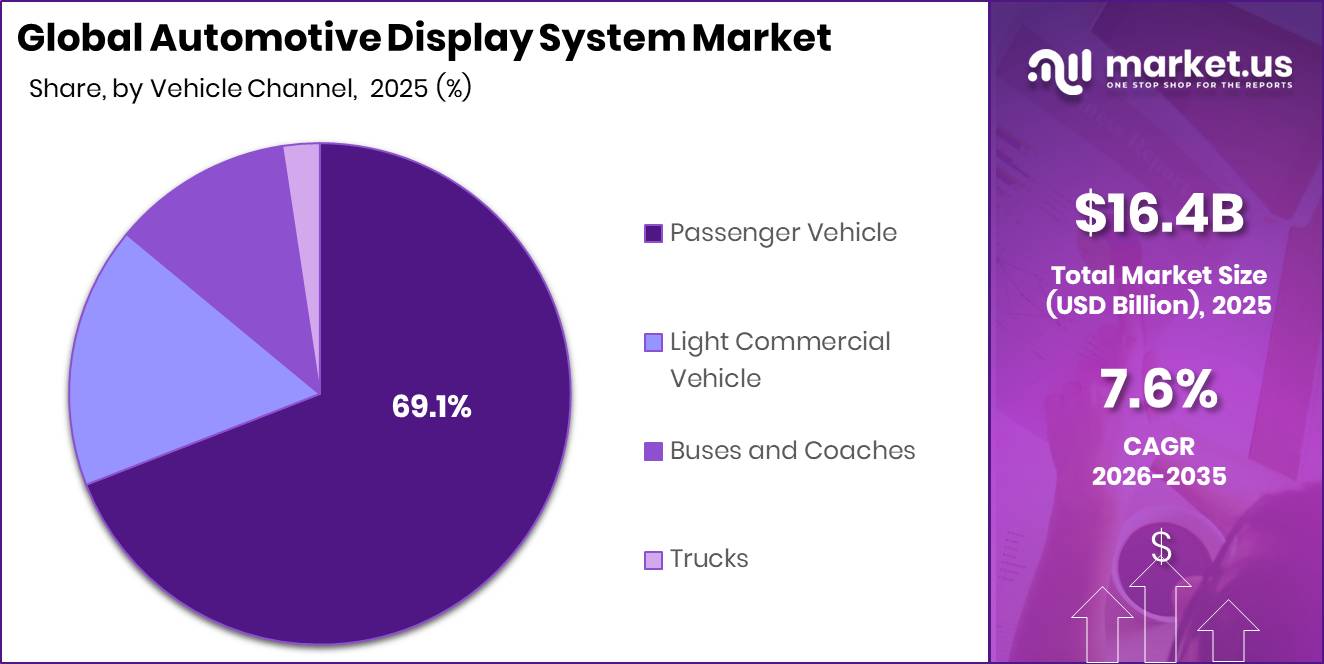
- Dominant vehicle type segment: Passenger Vehicle with 69.1% share
- Dominant sales channel: OEM with 84.6% share
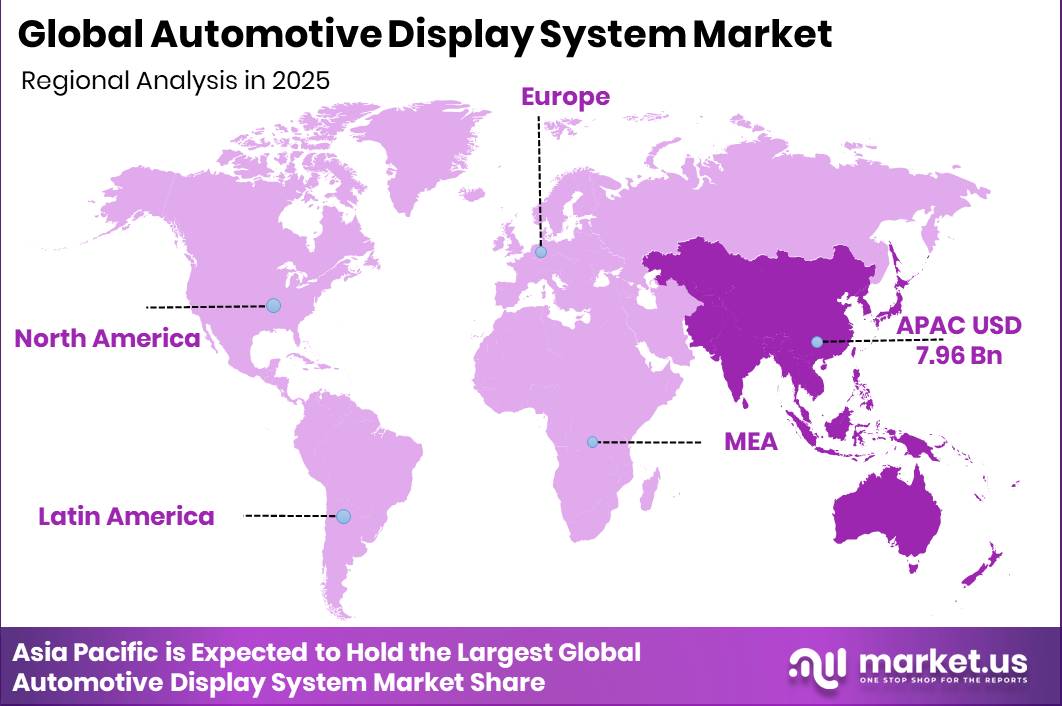
- Dominant region: Asia-Pacific with 37.3% share, valued at USD 6.11 Billion
Government and regulatory bodies are reshaping this market through mandatory compliance frameworks. UNECE Regulation No. 155 and UNECE Regulation No. 156 require cybersecurity management systems and software-update controls for new vehicles across the EU, UK, Japan, and South Korea. This forces OEMs to replace legacy display electronics with updateable, secure platforms, sustaining redesign demand even when consumer spending softens.
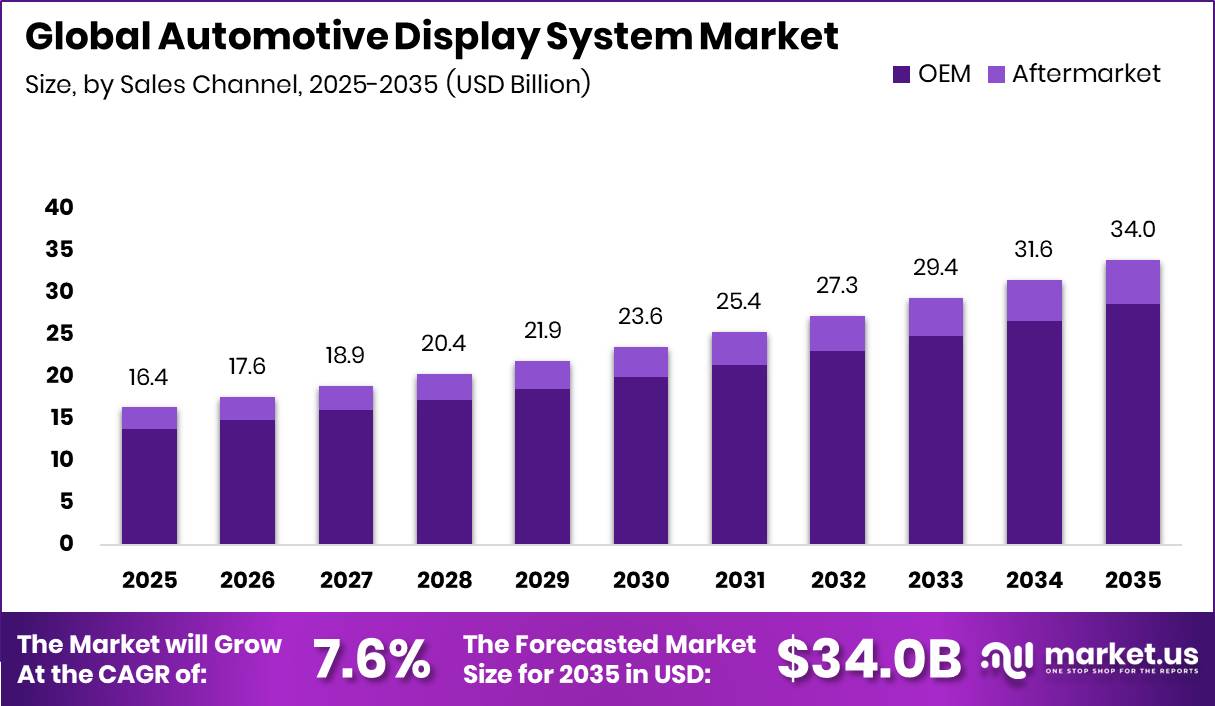
As reported by the IEA, more than 630 battery electric vehicle models were available globally in 2025, up from fewer than 200 in 2018. This proliferation directly expands the addressable base for digital cockpit display hardware. Each new EV platform requires a full display architecture build, making EV production volume a direct demand multiplier for this market.
Data from ACEA shows battery-electric vehicles accounted for 13.6% of all new passenger car registrations in the EU during 2024, while hybrid-electric vehicles added another 30.9%. Combined, electrified vehicles represented nearly 45% of EU registrations. This shift compresses the timeline for OEMs to deploy advanced display systems across their electrified lineups. In January 2025, BMW unveiled the Panoramic iDrive system featuring a windshield-wide display interface, signaling that full-cabin digitization is entering production at scale.
Technology Analysis
TFT-LCD dominates with 48.9% due to cost efficiency and production scale.
In 2025, TFT-LCD held a dominant market position in the By Technology segment of the Automotive Display System Market, with a 48.9% share. TFT-LCD panels offer proven thermal reliability, established supply chains, and lower per-unit cost than OLED alternatives. This cost advantage keeps TFT-LCD the default choice for mid-range and volume vehicle platforms, where display area is expanding but per-vehicle display budgets remain constrained.
OLED panels are gaining specification in premium vehicle programs due to superior contrast ratios, thinner form factors, and design flexibility. Automakers deploying OLED accept higher unit cost in exchange for visual differentiation in their flagship lineups. However, OLED’s sensitivity to operating-temperature extremes and long-term burn-in risk requires additional thermal management engineering, limiting its near-term penetration in mass-market segments.
Digital Light Processing displays address niche applications where projection-based visualization creates driver-facing advantages, particularly in head-up display and augmented reality overlay use cases. DLP technology supports wider field-of-view projection than conventional optics but requires more physical depth in the dashboard stack, constraining its adoption to vehicles with purpose-built interior architectures.
Display Size Analysis
Between 6″ to 10″ dominates with 44.2% due to balance of visibility and integration fit.
In 2025, the Between 6″ to 10″ display size held a dominant market position in the By Display Size segment of the Automotive Display System Market, with a 44.2% share. This size range aligns with the center stack and instrument cluster footprints used across the widest range of current vehicle platforms. Suppliers designing for this range benefit from the largest order volumes and the most standardized mounting and connector interfaces in the industry.
Displays smaller than 5 inches serve legacy instrument clusters, auxiliary driver information panels, and low-cost compact vehicles where interior packaging limits available screen real estate. As OEMs migrate toward unified digital cockpit architectures, sub-5-inch standalone displays are being phased out in favor of larger integrated panels, narrowing the long-term addressable market for this size band.
Displays greater than 10 inches are the fastest-expanding size category, driven by premium EV cockpit designs that prioritize landscape-format center consoles and pillar-to-pillar dashboard concepts. In January 2026, Hyundai Mobis introduced its Holographic Windshield Display technology, turning the windshield into a full-width data surface. This signals that the upper boundary of automotive display size is no longer defined by the center stack alone.
Application Analysis
Center Stack Display dominates with 36.4% due to infotainment and climate control integration.
In 2025, Center Stack Display held a dominant market position in the By Application segment of the Automotive Display System Market, with a 36.4% share. Center stack screens now consolidate infotainment, climate, navigation, and connectivity controls into a single touchscreen interface. This hardware consolidation reduces mechanical switch complexity and gives OEMs a single software-updatable surface to manage across vehicle lifecycles.
Head Up Display systems project speed, navigation, and ADAS alerts directly onto the windshield or a combiner glass surface, keeping the driver’s line of sight on the road. HUD adoption is concentrated in premium and safety-focused vehicle segments where ADAS penetration justifies the additional hardware investment. Standardized ADAS regulations in Europe and North America are creating structural pull for HUD integration beyond the luxury tier.
Instrument Cluster displays have migrated from analog gauges to fully digital TFT or OLED panels across most new passenger vehicle platforms. Digital clusters allow automakers to reconfigure the gauge layout through software, support multi-language markets from a single hardware part, and feed real-time ADAS data to the driver without additional physical controls. This hardware flexibility makes digital clusters one of the most cost-effective display upgrades available per vehicle platform.
Vehicle Type Analysis
Passenger Vehicle dominates with 69.1% due to volume production and display content per vehicle.
In 2025, Passenger Vehicle held a dominant market position in the By Vehicle Type segment of the Automotive Display System Market, with a 69.1% share. Passenger vehicles account for the highest global production volumes and consistently carry the widest display hardware content per unit, spanning instrument clusters, center stacks, and increasingly rear-seat screens. According to ACEA, hybrid-electric vehicles alone represented 30.9% of EU new car registrations in 2024, and each electrified platform requires a new display architecture, reinforcing the direct link between passenger vehicle electrification and display system demand.
Light Commercial Vehicles are adopting digital display systems at an increasing rate as fleet operators demand real-time telematics data, navigation, and driver monitoring interfaces. Commercial fleets prioritize durability and uptime over design aesthetics, which means display suppliers targeting this sub-segment must meet higher vibration, temperature, and duty-cycle specifications than consumer passenger applications require.
Buses and Coaches represent a distinct segment where rear-passenger entertainment displays, driver information panels, and route management screens create a multi-display environment per vehicle. Premium coach operators are specifying OLED and large-format displays to differentiate their passenger experience. This sub-segment generates higher per-vehicle display revenue than standard passenger cars despite lower unit production volumes.
Sales Channel Analysis
OEM dominates with 84.6% due to factory-integrated specifications and platform lock-in.
In 2025, OEM held a dominant market position in the By Sales Channel segment of the Automotive Display System Market, with a 84.6% share. OEM-specified display systems are engineered into vehicle platforms at the design stage, creating long-term supplier relationships tied to model lifecycles of five to seven years. This structural lock-in gives tier-1 display suppliers predictable revenue visibility but raises the cost of competitive displacement once a platform award is made.
The Aftermarket channel serves vehicle owners who retrofit or upgrade display hardware after purchase. Aftermarket display products face a narrower specification path than OEM systems because they must fit existing dashboard cavities, connect to legacy electrical architectures, and meet consumer price expectations without OEM engineering support. This channel benefits when OEM display content in a given model year falls below consumer expectations, creating a gap that aftermarket suppliers can fill.
Key Market Segments
By Technology
- LCD
- TFT-LCD
- OLED
- Digital Lighting Processing (DLP)
- Plasma Panels
By Display Size
- Less than 5″
- Between 6″ to 10″
- Greater than 10″
By Application
- Head Up Display
- Instrument Cluster
- Center Stack Display
- Rear Seat Entertainment Display
- Rear View Mirror Display
- Portable Navigation Device
- Others
By Vehicle Type
- Passenger Vehicle
- Hatchback
- Sedan
- Utility Vehicles
- Light Commercial Vehicle
- Buses and Coaches
- Trucks
By Sales Channel
- OEM
- Aftermarket
Market Dynamics
Market Opportunity Analysis - Underserved size bands, emerging regions, and rear-cabin applications offer entry points beyond the dominant OEM core
The greater-than-10-inch display size band is structurally underpenetrated relative to its trajectory. Premium EV platforms are establishing pillar-to-pillar and windshield-wide display concepts as production realities, but volume-tier vehicles have not yet adopted this format. Suppliers who build scalable manufacturing for large-format automotive panels now will capture first-mover positioning before the size band becomes a commodity specification in mid-market programs.
Rear-cabin display monetization remains a low-competition segment with geographic concentration in China, South Korea, Middle East, and North America. Premium coach, ride-hailing fleet, and autonomous mobility operators represent a distinct buyer profile with higher per-vehicle revenue than standard passenger applications. This segment is underexploited because most Tier-1 suppliers prioritize front-cabin OEM awards. By contrast, dedicated rear-cabin display strategies can generate incremental platform revenue without competing against entrenched center-stack suppliers.
Latin America and Middle East and Africa represent regions where digital cockpit penetration is still determined by imported platform decisions made in China and Europe rather than by local OEM demand. As EV platforms begin entering Brazil, Mexico, and GCC markets, the baseline display content per vehicle will rise in step with global platform standards. Early supplier presence in regional assembly programs creates specification influence before the market reaches the competitive density seen in China and Europe.
Modular cockpit kits for affordable EVs targeting China, India, ASEAN, and Latin America carry the highest medium-term CAGR upside at an estimated +2.0%. Volume EV platforms in these markets cannot absorb the cost structures of premium cockpit systems. Suppliers who engineer cost-down display module architectures specifically for sub-USD-25,000 vehicle programs address the largest untapped production volume segment in the global automotive display market.
Technology and Innovation Landscape - Panel technology transitions, AI-driven interfaces, and over-the-air update capability are redefining the competitive basis for automotive display suppliers
The migration from TFT-LCD to OLED and Mini-LED automotive display technologies is the most consequential material transition underway. OLED panels deliver superior contrast and thinner form factors but require additional thermal management engineering for automotive-grade temperature ranges. Mini-LED backlighting offers a cost-intermediate path that improves TFT-LCD contrast performance without the reliability complexity of full OLED, making it the most likely bridge technology for volume-tier vehicles over the next product cycle.
AI-powered human-machine interfaces with context-aware visual customization are moving from concept to production specification. These systems adjust display content, brightness, and layout based on driving mode, occupancy, and real-time sensor inputs. Suppliers who embed AI inference capability directly into display controller silicon reduce system latency and eliminate the need for a separate processing module, compressing bill-of-materials cost while enabling richer interface behavior.
Over-the-air software update capability has become a baseline expectation rather than a premium feature for display systems integrated into software-defined vehicle architectures. OTA capability allows automakers to improve display functionality, add navigation map updates, and deploy security patches across the installed fleet without a dealer visit. This shifts part of the display system’s value from one-time hardware specification to recurring software service revenue, creating a new post-sale monetization layer for both OEMs and display platform suppliers.
Three-dimensional display technologies enabling glasses-free visualization of driving and navigation information represent the next differentiation frontier. These systems use light-field or lenticular optics to create depth perception without requiring the driver to wear eyewear, allowing ADAS alerts and navigation overlays to appear to float at the correct focal depth for natural viewing. Commercial readiness for volume production remains a medium-term milestone, but the technology addresses a genuine driver distraction problem that regulators in Europe and North America have flagged as a growing safety concern.
Drivers
EV-led cockpit display content expansion is the strongest single driver, carrying an estimated +2.3% impact on the CAGR forecast. Chinese, European, and North American OEM platforms now treat the digital cockpit as a core product differentiator, specifying multi-screen architectures as standard equipment. Each new EV launch requires a complete display architecture build, making EV production volume a direct and recurring revenue catalyst for display suppliers.
Cybersecurity and software-update compliance now functions as a demand backstop rather than a discretionary investment. UNECE Regulation No. 155 and No. 156 became mandatory for new vehicle types from July 2022 and for all newly produced vehicles from July 2024 across UNECE-contracting markets including the EU, UK, Japan, and South Korea. OEMs must phase out fragmented legacy display electronics in favor of secure, updateable, and configuration-managed platforms to maintain vehicle homologation. This compliance pull sustains redesign activity even when consumer demand for display upgrades softens, adding an estimated +1.4% to the CAGR forecast.
| Driver | (~) % Impact on CAGR Forecast | Geographic Relevance | Impact Timeline |
|---|---|---|---|
| EV-led cockpit display content expansion | +2.3% | China core, EU core, North America premium, East Asia manufacturing base | Short term (≤ 2 years) |
| Software-defined cockpit and OTA interface upgrades | +1.8% | North America core, EU, China, Japan, South Korea | Medium term (2-4 years) |
| Cybersecurity and software-update compliance refresh | +1.4% | EU core, UK, Japan, South Korea, UNECE-aligned markets | Short term (≤ 2 years) |
| Premium migration to OLED, Mini-LED and panoramic layouts | +1.3% | China premium, EU premium, North America premium | Medium term (2-4 years) |
| AI-enabled cabin interaction and multi-screen adoption | +1.1% | China core, North America, EU premium | Medium term (2-4 years) |
| Asian supply-chain scale-up and platform localization | +0.8% | China core, ASEAN corridors, EU sourcing spill-over | Long term (≥ 4 years) |
Restraints
Automotive displays have evolved into software-linked, connected interfaces rather than standalone hardware. Compliance obligations now extend to the HMI layer, embedded ECUs, update pathways, and data-security architecture. UNECE Regulation No. 155 and No. 156 require cybersecurity management systems and controlled software-update systems as part of vehicle approval in the EU, UK, Japan, and South Korea, with these requirements applying to all new vehicles since July 2024. The operational bottleneck is recurring: validation cost, supplier evidence collection, secure-boot architecture, vulnerability monitoring, and traceable OTA capability all increase development effort before start of production and continue after launch.
This compliance overhead raises program engineering cost, stretches validation calendars, and reduces the commercial attractiveness of advanced display programs in lower-price vehicle segments. Where the incremental revenue from a larger or more complex cockpit screen does not offset compliance cost, OEMs defer display upgrades to the next platform cycle. Chip-content bottlenecks add further pressure, carrying an estimated -1.3% drag on the CAGR forecast, while mass-market affordability gaps apply a parallel -1.2% constraint across Europe, North America, and Latin America.
| Restraint | (~) % Impact on CAGR Forecast | Geographic Relevance | Impact Timeline |
|---|---|---|---|
| Chip-content bottlenecks | -1.3% | North America core, EU, Japan, Korea | Short term (≤ 2 years) |
| Asia-heavy display sourcing | -1.1% | EU, North America, India, ASEAN | Medium term (2-4 years) |
| Cybersecurity approval burden | -0.9% | EU core, UK, Japan, Korea | Medium term (2-4 years) |
| Mass-market affordability gap | -1.2% | Europe core, North America, Latin America | Short term (≤ 2 years) |
| Tariff and customs volatility | -1.0% | U.S.-Mexico corridor, EU, China-linked supply chains | Medium term (2-4 years) |
| EV power-load trade-off | -0.7% | China, EU, premium North America | Long term (≥ 4 years) |
Challenges
The automotive display system market scales at the module and integration level, but the deeper manufacturing base for front-end display fabrication, specialty materials, and high-specification controller ecosystems remains unevenly distributed. Many regional assembly programs still depend on imported upstream inputs even when local value-add appears to be increasing. This creates a recurring operational penalty through 2026 in the form of longer lead-time exposure, duplicated inventory buffers, slower engineering change execution, and higher landed-cost volatility.
Program-level disruption translates into roughly 4 to 8 weeks of component rescheduling during supply imbalances, and 150 to 250 basis points of extra working-capital absorption for Tier-1 integrators supporting multi-screen cockpit builds. This does not stop shipments outright. However, it continuously reduces the speed at which suppliers can scale new contracts, forcing manufacturers to pursue local test infrastructure, dual-source qualification, and bonded subassembly regionalization before supply resilience becomes structurally normal. Upstream localization gaps carry an estimated -1.3% drag on the CAGR forecast.
| Challenge | (~) % CAGR Friction Drag | Geographic Relevance | Mitigation Horizon |
|---|---|---|---|
| Upstream localization gaps | -1.3% | India, ASEAN assembly bases, EU import-dependent programs | Long term (≥ 4 years) |
| Software compliance overload | -1.1% | EU, UK, Japan, Korea, global export platforms | Medium term (2-4 years) |
| Thermal durability pressure | -0.9% | India, Middle East, Southeast Asia, U.S. Sunbelt | Medium term (2-4 years) |
| Cockpit talent scarcity | -0.8% | Germany, Japan, North America, India engineering hubs | Long term (≥ 4 years) |
| Platform complexity escalation | -1.0% | China EV clusters, EU premium OEMs, North America | Medium term (2-4 years) |
| Trade-route redesign costs | -0.7% | U.S.-China lanes, EU sourcing chains, Mexico corridors | Short term (≤ 2 years) |
Opportunities
Mid-market AR-HUD scaling qualifies as the most immediately actionable opportunity in this market. Head-up display capability already exists in premium platforms. The untapped upside lies in engineering it down into volume passenger vehicles through lower-cost optics, standardized software layers, and narrower hardware footprints. BOE Technology Group has showcased a 44.8-inch PHUD concept with distortion correction and mini-LED architecture, and multiple display vendors now treat advanced windshield projection as a scalable cockpit layer rather than a niche luxury feature.
The commercial conversion model is specific: if suppliers reduce system cost by roughly 20% to 30%, compress integration time by 15% to 25%, and push attach rates in mid-segment vehicles into the 10% to 15% range over the next product cycle, the category can generate meaningful upside beyond baseline display growth. Per-vehicle content uplift of roughly $120 to $220 and stronger pricing resilience than standard center-stack modules make mid-market AR-HUD a compelling margin-expansion play. This opportunity carries an estimated +1.8% CAGR upside.
| Opportunity | (~) % Potential CAGR Upside | Geographic Relevance | Execution Window |
|---|---|---|---|
| Mid-market AR-HUD scaling | +1.8% | Europe, China, North America | Short term (≤ 2 years) |
| In-cabin software monetization | +1.5% | North America, Europe, developed APAC | Short term (≤ 2 years) |
| Modular cockpit kits for affordable EVs | +2.0% | China, India, ASEAN, LATAM | Medium term (2-4 years) |
| Rear-cabin display monetization | +1.3% | China, Korea, Middle East, North America | Medium term (2-4 years) |
| Hidden-display premium interiors | +1.1% | Europe premium, US premium, Japan, GCC | Medium term (2-4 years) |
| Cockpit platform consolidation M&A | +2.2% | Global, especially APAC and Europe | Long term (≥ 4 years) |
Regional Analysis
Asia-Pacific Dominates the Automotive Display System Market with a Market Share of 37.3%, Valued at USD 6.11 Billion
Asia-Pacific holds the largest regional share at 37.3%, valued at USD 6.11 Billion, anchored by China’s position as both the world’s largest EV production base and the dominant source of automotive display panel manufacturing. Chinese OEMs specify large-format multi-screen cockpits as standard equipment across price tiers where European and North American automakers still treat them as premium options. This gap in baseline display content per vehicle makes China the single largest demand engine in the global market.
North America represents a high-value regional market where regulatory alignment around ADAS requirements, strong consumer preference for connected infotainment, and a growing premium EV segment drive display content per vehicle upward. In May 2025, LG Display showcased a 57-inch Pillar-to-Pillar automotive display designed for software-defined vehicle cockpits, reflecting the scale of display ambition targeting North American and European OEM platforms. The US aftermarket also adds incremental volume that is not captured by OEM production data alone.
Europe is a regulatory-driven market where UNECE Regulation No. 155 and No. 156 compliance requirements force OEMs to modernize their display electronics architectures regardless of consumer demand cycles. This creates a minimum baseline of display hardware redesign activity that supports market revenue even in years when vehicle production volumes are flat. Germany, France, and the UK anchor European demand through their concentration of premium OEM headquarters and supplier development programs.
Key Regions and Countries
North America
- US
- Canada
Europe
- Germany
- France
- The UK
- Spain
- Italy
- Rest of Europe
Asia Pacific
- China
- Japan
- South Korea
- India
- Australia
- Rest of APAC
Latin America
- Brazil
- Mexico
- Rest of Latin America
Middle East and Africa
- GCC
- South Africa
- Rest of MEA
Key Company Insights
Alps Alpine Co. Ltd. positions itself at the intersection of human-machine interface hardware and display integration, supplying input devices and display modules that serve both OEM cockpit programs and ADAS visual feedback systems. This dual-category presence gives Alps Alpine cross-sell leverage within a single platform award. However, their relatively smaller scale compared to panel manufacturers like LG Display creates margin pressure when competing for high-volume display supply contracts.
AUO Corporation operates as a panel-level manufacturer with direct exposure to the automotive display supply chain through its AUO Mobility Solutions division. In January 2026, AUO launched the Aero Module Transparent Micro LED Display, enabling transparent display interfaces for automotive interiors. This product signals AUO’s intent to move from commodity panel supply toward differentiated, design-enabling display technology. Suppliers who own the panel layer and the integration concept simultaneously compress the design cycle for OEM customers and capture a larger share of per-vehicle display revenue.
Key Players
- Alps Alpine Co. Ltd.
- AUO Corporation
- Continental AG
- DENSO Corporation
- Innolux Corporation
- Japan Display Inc. (Sony Corporation)
- LG Display Co. Ltd.
- Nippon Seiki Co. Ltd.
- Panasonic Holdings Corporation
- Robert Bosch GmbH
- Valeo SA
- Visteon Corporation
- YAZAKI Corporation
Recent Developments
- January 2026 – AUO Mobility Solutions launched the Aero Module Transparent Micro LED Display, enabling transparent display interfaces integrated directly into automotive interiors for software-defined vehicle platforms.
- November 2025 – Harman’s Ready Display became the first automotive display platform to achieve HDR10+ Automotive certification, delivering enhanced image quality and contrast performance for in-vehicle screens.
- November 2025 – LG Display unveiled the world’s first Dual View OLED automotive display, capable of simultaneously presenting different content to the driver and passenger on a single screen panel.
- January 2026 – Visteon unveiled its SmartCore™ High-Performance Computing platform at CES 2026, enabling AI-powered digital cockpits with integrated multi-display architectures and software-defined vehicle functionality.
Report Scope
| Report Features | Description |
|---|---|
| Market Value (2025) | USD 16.4 Billion |
| Forecast Revenue (2035) | USD 34.0 Billion |
| CAGR (2026-2035) | 7.6% |
| Base Year for Estimation | 2025 |
| Historic Period | 2020-2024 |
| Forecast Period | 2026-2035 |
| Report Coverage | Revenue Forecast, Market Dynamics, Market Opportunity Analysis, Technology and Innovation Landscape, Competitive Landscape, Recent Developments |
| Segments Covered | By Technology (LCD: TFT-LCD, OLED, Digital Lighting Processing (DLP), Plasma Panels); By Display Size (Less than 5″, Between 6″ to 10″, Greater than 10″); By Application (Head Up Display, Instrument Cluster, Center Stack Display, Rear Seat Entertainment Display, Rear View Mirror Display, Portable Navigation Device, Others); By Vehicle Type (Passenger Vehicle: Hatchback, Sedan, Utility Vehicles; Light Commercial Vehicle, Buses and Coaches, Trucks); By Sales Channel (OEM, Aftermarket) |
| Regional Analysis | North America (US and Canada), Europe (Germany, France, The UK, Spain, Italy, and Rest of Europe), Asia Pacific (China, Japan, South Korea, India, Australia, and Rest of APAC), Latin America (Brazil, Mexico, and Rest of Latin America), Middle East and Africa (GCC, South Africa, and Rest of MEA) |
| Competitive Landscape | Alps Alpine Co. Ltd., AUO Corporation, Continental AG, DENSO Corporation, Innolux Corporation, Japan Display Inc. (Sony Corporation), LG Display Co. Ltd., Nippon Seiki Co. Ltd., Panasonic Holdings Corporation, Robert Bosch GmbH, Valeo SA, Visteon Corporation, YAZAKI Corporation |
| Customization Scope | Customization for segments, region/country-level will be provided. Additional customization can be done based on requirements. |
| Purchase Options | We have three licenses to opt for: Single User License, Multi-User License (Up to 5 Users), Corporate Use License (Unlimited User and Printable PDF) |





































