


Report Overview
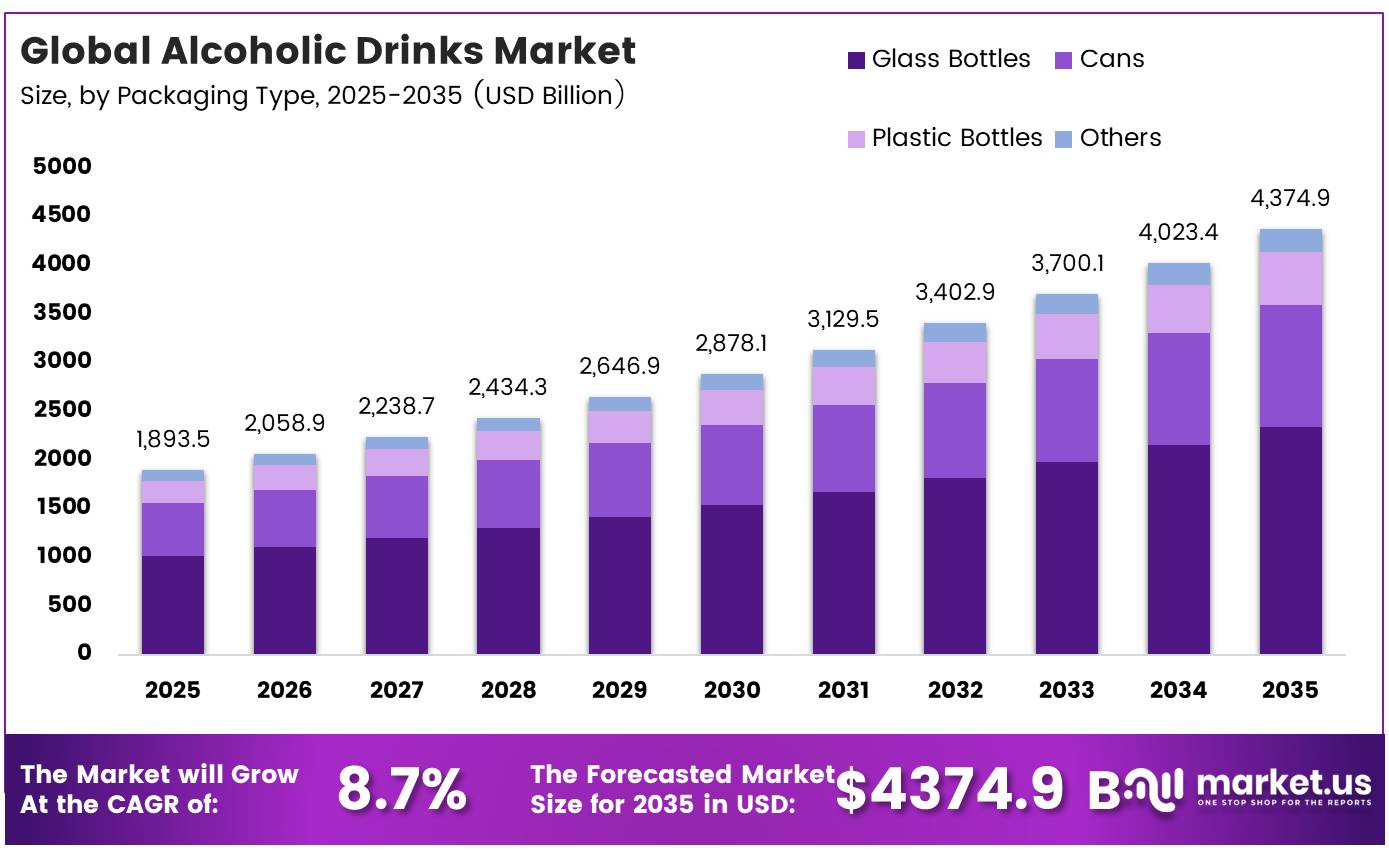
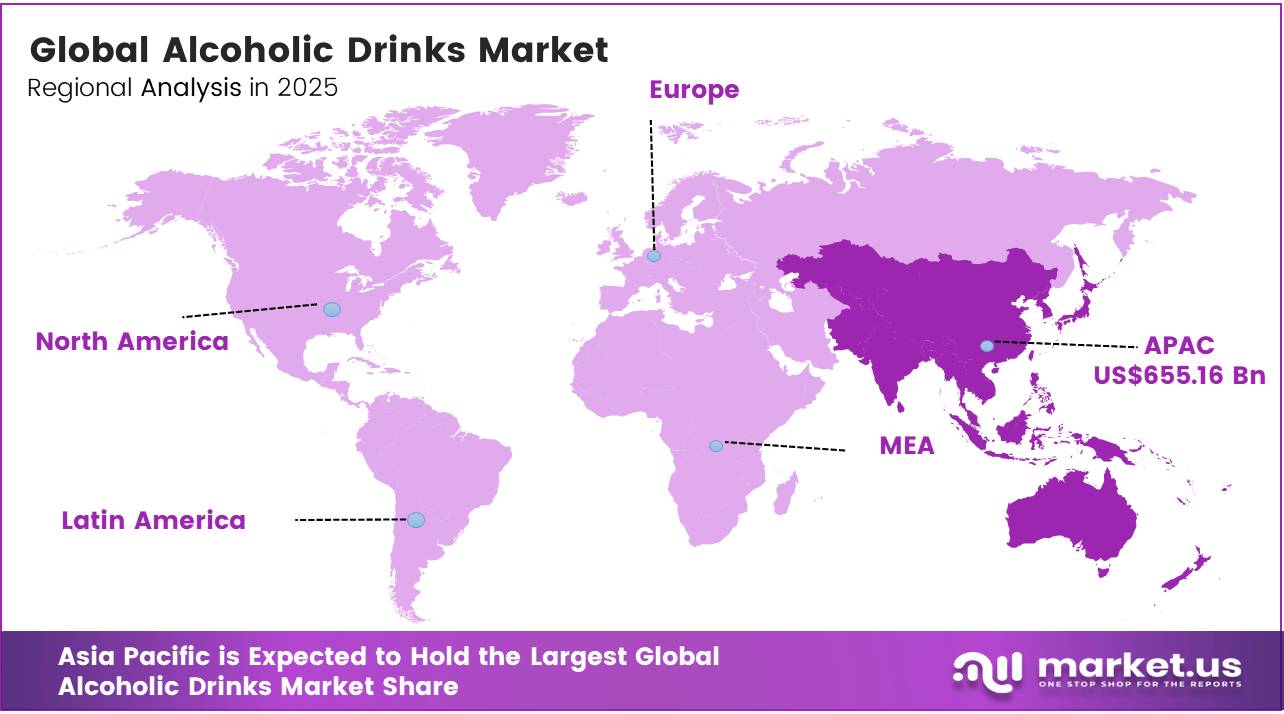
In 2025, the global alcoholic drinks market was valued at USD 1,893.5 billion. The market is projected to grow at a CAGR of 8.7% during 2026–2035, reaching approximately USD 4,374.9 billion by 2035. In 2025, Asia Pacific dominated the global market, accounting for more than 34.6% of total revenue, with a market value of USD 655.2 billion.
This market growth is supported by strong demand in developed economies and rising consumption across emerging countries. According to the WHO Global Status Report on Alcohol and Health (2024), global alcohol consumption averaged 5.0 litres of pure alcohol per person aged 15 years and above in 2022. The WHO European Region recorded the highest consumption at 9.2 litres, about 83% higher than the global average.
- The World Bank East Asia and Pacific Economic Update (2025) noted that the region continued to record GDP growth above the global average and remains home to one of the world’s fastest-growing middle-class populations. Premiumization is also supporting revenue growth. In the United States, the craft brewing industry generated an economic impact of USD 77.1 billion and supported nearly 460,000 jobs in 2024.
In India, the alcoholic beverage market reached INR 3,25,500 crore (approximately USD 39 billion) in FY2024, growing at a CAGR of 8.0% since FY2019, and is projected to expand at 9.2% CAGR to INR 5,04,900 crore by FY2029. Furthermore, the OECD Health at a Glance 2025 report found that 27% of adults aged 15 years and above reported heavy episodic drinking at least once a month in 2023, indicating sustained consumer demand. At the same time, global nominal GDP is projected to increase from USD 110.1 trillion in 2024 to USD 139.7 trillion by 2029, at a 4.9% CAGR, supporting higher spending on branded alcoholic beverages across developing economies.
Future market growth is expected to be led by Europe, supported by rising incomes, urbanization, and premium beverage demand. The Brewers of Europe Economic Report (2024) states that total EU consumer spending on beer reached €110 billion in 2022, while the beer industry generated €52 billion in value-added, supported over 2 million jobs, and contributed more than €40 billion in tax revenue. In addition, the World Spirits Alliance reported that the global spirits industry contributed USD 730 billion to global GDP, generated USD 390 billion in tax revenue, and supported 36 million jobs, highlighting the industry’s strong economic importance.
Key Takeaways
- The global Alcoholic Drinks market was valued at US$1,893.5 billion in 2025.
- The market is projected to grow at a CAGR of 8.7% and is estimated to reach US$4,374.9 billion by 2035.
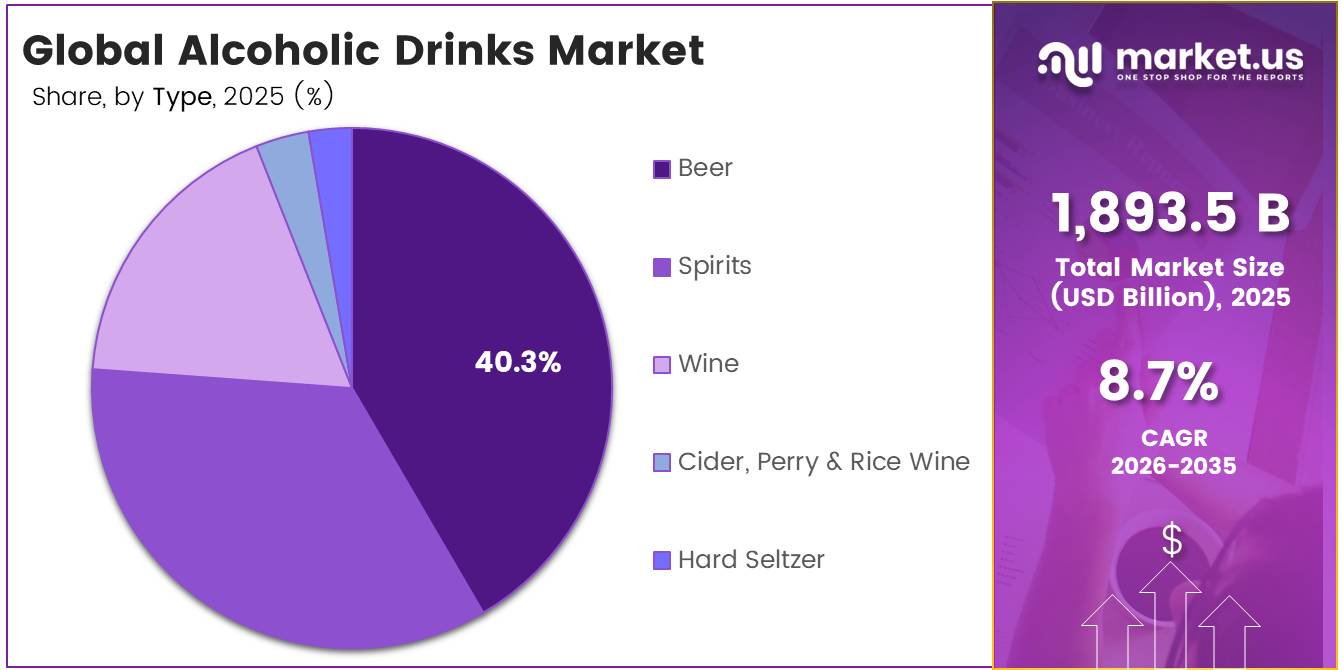
- On the basis of type, the Beer dominated the Alcoholic Drinks market, constituting 40.3% of the total market share.
- Based on the Alcohol Content, the medium alcohol content dominated the Alcoholic Drinks market, with a substantial market share of around 56.4%.
- Based on the packaging type, Glass bottles led the market, comprising 53.4% of the total market.
- Among the distribution channel, the Off‑trade (At‑home consumption) held a major share in the Alcoholic Drinks market, 67.4% of the market share.
- In 2025, the Asia Pacific was the most dominant region in the Alcoholic Drinks market, accounting for 34.6% of the total global consumption.
By Type Analysis
Beer represents dominant Segment in the Market.
Beer accounted for more than 40.3% of the global alcoholic drinks market in 2025, supported by its high consumption and well-established production network. According to Kirin Holdings’ 2024 Global Beer Consumption Report, based on data from brewers’ associations across 170 countries, global beer consumption reached 194.12 million kiloliters in 2024, increasing by around 890,000 kiloliters year-over-year, equivalent to nearly 1.4 billion additional 633 ml bottles.
Beer also benefits from a strong global brewing and retail ecosystem. In the United States, the craft beer industry generated an economic impact of USD 77.1 billion in 2024, supported by 9,736 independent breweries and nearly 460,000 jobs. In Europe, beer retail sales are projected to grow from €46.8 billion in 2023 to €49.6 billion by 2028. Its wide availability, established distribution channels, and consistent consumer demand continue to make beer the largest segment in the global alcoholic drinks market.
Hard seltzer is expected to be the fastest-growing segment due to increasing demand for low-calorie and lower-sugar alcoholic beverages. The broader RTD (ready-to-drink) category, which heavily features hard seltzer, recorded 8.1% year-over-year dollar sales growth in U.S. weekly scan data in January 2026, outperforming traditional alcoholic beverage categories.
Hard seltzers typically contain about 100 calories, 2 g of sugar, and 4–5% ABV per serving, compared with around 150–200 calories and 10–15 g of carbohydrates in a standard beer. This nutritional profile strongly appeals to Millennials and Gen Z consumers seeking lighter alcoholic options without compromising on convenience. Rising urbanization, higher disposable incomes, and growing health awareness, particularly across Asia Pacific and Latin America, are expected to further support demand for hard seltzer during the forecast period.
By Alcohol Content Analysis
Medium is a significant alcohol content.
Medium-alcohol beverages accounted for more than 56.4% of the global alcoholic drinks market in 2025. Their dominance is mainly due to the high consumption of beer and wine, which generally contain 4% to 14% ABV. According to the U.S. National Institute on Alcohol Abuse and Alcoholism (NIAAA) methodology, the average alcohol content during 2003–2016 was 4.74% for beer, 12.3% for wine, and 38.3% for spirits. Global beer consumption reached 194.12 million kiloliters in 2024, according to Kirin Holdings, while wine also records significant annual production volumes.
This large-scale consumption naturally places medium-alcohol beverages at the leading position. The OECD also classifies beer at 4–5% ABV and wine at 11–16% ABV in its standard alcohol measurement framework, reinforcing the segment’s market leadership. In addition, broad retail availability, favorable taxation structures, and strong demand for beer and wine in restaurants, bars, and social events continue to support this segment.
The low-alcohol segment is expected to register the fastest growth, driven by rising consumer preference for healthier drinking habits. According to NielsenIQ’s On-Premise Consumer Insights (July 2025), 30% of consumers in Asia Pacific reported drinking less alcohol than a year earlier, compared with 15% who increased consumption. Health was the main reason for moderation, cited by 41% of respondents, increasing to 52% in China and 45% in Hong Kong.
In the U.S., the Adult Non-Alcoholic Beverage Association (ANBA) reported in February 2025 that non-alcoholic spirits grew by 86%, non-alcoholic wine by 27.2%, and non-alcoholic beer by 25.1% year over year. In the UK, 53% of adults consumed low- or no-alcohol beverages during the 12 months to May 2025, while the market reached £413 million, according to Mintel. Growing health awareness and stricter labeling and advertising regulations are further supporting demand for low-alcohol products worldwide.
By Packaging Type Analysis
Glass Bottles Are the Most Widely Used Packaging Type.
Glass bottles accounted for more than 53.4% of the global alcoholic drinks packaging market in 2025, supported by a well-established manufacturing base and strong demand from the beverage industry. According to the FEVE Annual Report 2024, member companies produced 76.5 billion glass containers, equivalent to 21 million tonnes, reflecting a 1% year-on-year increase. Glass-packaged products generated over €140 billion in EU exports, representing 5.7% of total EU exports in 2023, highlighting the importance of glass in the beverage supply chain.
The Glass Packaging Institute (GPI) reports that beer accounts for 47% of U.S. glass container demand, followed by food (24%), wine (8%), spirits (6%), and ready-to-drink (RTD) beverages (5%). Global container glass production reached about 105 million metric tonnes in 2024, with more than 68 million metric tonnes used for food and beverages. Glass remains the preferred packaging material because it is chemically inert and provides zero gas transmission, helping preserve taste, carbonation, aroma, and product quality, especially for premium wines, spirits, champagne, and craft beer.
Aluminium cans are the fastest-growing packaging format, supported by rising demand for RTD beverages and hard seltzers, along with strong sustainability benefits. According to the International Aluminium Institute (September 2024), aluminium cans contain more than 70% recycled material, compared with 34% for glass and 40% for plastic.
The global aluminium beverage cans market was valued at USD 49.2 billion in 2025 and is projected to reach USD 75.7 billion by 2034, expanding at a 4.9% CAGR. North America held a 32.80% share of global demand in 2024, while more than 75% of all aluminium ever produced in the U.S. remains in use through closed-loop recycling. Aluminium cans are about 40% lighter than glass, block 100% of UV light, reduce transport costs and breakage, and support slim-can designs widely used in the rapidly growing RTD and hard seltzer segments.
By Distribution Analysis
Off-trade (At-home consumption) Held a Major Share of the Alcoholic Drinks Market.
The Off-trade segment dominated the alcoholic drinks market in 2025, accounting for more than 67.4% of global distribution. Its leadership is supported by the wide reach of supermarkets, grocery stores, liquor outlets, and online retail. According to the Food Marketing Institute (FMI), the U.S. had 45,575 supermarkets in 2024, with average weekly sales of USD 711,806 per store, ensuring broad availability of alcoholic beverages. Globally, supermarkets and grocery stores account for 86.7% of retail food and beverage purchases, while beer, wine, and liquor stores contribute another 7.0% to off-trade sales.
The On-trade segment is projected to record the fastest growth during the forecast period, supported by the strong recovery of tourism and hospitality. According to UN Tourism’s World Tourism Barometer (January 2025), international tourist arrivals reached 1.4 billion in 2024, up 11% from 2023, representing 99% recovery to 2019 levels. Tourist arrivals are expected to increase by another 3% to 5% in 2025, driving higher demand in hotels, restaurants, bars, and entertainment venues.
The World Travel & Tourism Council (WTTC, 2025) reported that the travel and tourism sector contributed USD 11.6 trillion to global GDP in 2025, growing 4.1% year-over-year, compared with 2.8% global economic growth. The sector also supported 366 million jobs, or about 1 in 9 jobs worldwide. Furthermore, international visitor spending reached USD 2.02 trillion, while domestic visitor spending totaled USD 5.63 trillion in 2025, creating strong demand for premium alcoholic beverages through the on-trade channel.
Key Market Segments
By Type
- Beer
- Spirits
- Wine
- Cider, Perry & Rice Wine
- Hard Seltzer
- Others
By Alcohol Content
- Low
- Medium
- High
By Packaging Type
- Glass Bottles
- Cans
- Plastic Bottles
- Others
By Distribution Channel
- Off‑trade (At‑home consumption)
- Supermarkets / Hypermarkets
- Convenience Stores
- Liquor / Specialty Stores
- Online Retail / E‑commerce
- On‑trade (Out‑of‑home / HORECA)
- Bars & Pubs
- Restaurants
- Hotels & Clubs
Driver Analysis
Emerging market income growth and urbanization expanding alcoholic drinks penetration
Urbanization rates in many of these markets are climbing by 1–2 percentage points per year, and disposable income per capita is trending upward in line with GDP growth, which translates into tens of millions of new legal‑age consumers entering urban lifestyles where formal bars, restaurants and modern retail channels provide greater access to branded alcoholic drinks.
From a unit‑economics perspective, even modest increases in per‑capita annual consumption say 1–2 litres per adult in some African and Asian markets over the decade can add hundreds of millions of litres of incremental demand, given population bases measured in tens to hundreds of millions, and this volume tends to skew toward branded spirits and beer rather than informal homebrew as formalization progresses.
This driver is reasonably modeled as adding around +1.8 percentage points to global alcoholic drinks CAGR, with the greatest impact over a long‑term horizon (≥ 4 years) as income and urbanization trends compound; it structurally shifts business models toward localized brand portfolios, region‑specific pricing ladders and deeper route‑to‑market investments in emerging corridors, while also attracting multinational capital into capacity, distribution and marketing platforms aimed at capturing this demographic dividend.
Drivers Impact Analysis
| Driver | (~) % Impact on CAGR | Geographic Relevance | Impact Timeline |
|---|---|---|---|
| Emerging market income growth and urbanization expanding alcoholic drinks penetration | +1.8% | India core, Africa growth belt, LatAm corridors | Long term (≥ 4 years) |
| Premiumization in spirits, beer and RTDs raising value per unit | +1.6% | North America core, EU, urban APAC | Medium term (2-4 years) |
| RTD, convenience and low-prep formats reshaping consumption occasions | +1.4% | North America, EU, Japan, urban LatAm | Short term (≤ 2 years) |
| On-trade recovery and experiential venues post-pandemic boosting volume and mix | +1.2% | Global urban hubs, tourism regions | Medium term (2-4 years) |
| Digital channels and e-commerce expanding access and assortment | +1.0% | North America, EU, China, India | Medium term (2-4 years) |
| Lifestyle shifts toward earlier “daycap” and moderated, frequent drinking | +0.9% | Western Europe, North America, affluent APAC | Long term (≥ 4 years) |
Restraint Analysis
Health policies, taxation and consumption‑reduction agendas
Governments in Western Europe and parts of North America continue to raise excise duties and implement minimum unit‑pricing or tighter outlet controls, while health agencies push for reduced per‑capita alcohol use through campaigns and guidelines, effectively targeting lower grams of ethanol per adult even if value‑per‑unit rises. Quantitatively, successive duty increases of 2–5% per year and episodic hikes above 10% in some jurisdictions compress margins and shift demand toward lower‑priced or non‑alcohol alternatives, particularly among price‑sensitive segments; in parallel, policy goals aimed at cutting harmful use by, for example, 10–20% over a decade translate into volume ceilings even when premiumization supports value growth.
For global producers, this restraint directly subtracts growth: instead of mid‑single‑digit volume expansion, mature markets may see flat or low‑single‑digit declines in litres sold, with premiumization only partially offsetting the drag. Modeled globally, health‑policy and tax agendas shave around 1.7 percentage points off potential CAGR, particularly over a ≥ 4‑year horizon, as countries tighten WHO‑aligned strategies and incorporate alcohol into broader non‑communicable disease frameworks; strategically, firms respond by pivoting to low‑ABV, no‑alcohol, and adjacent categories, but those moves represent new businesses rather than pure alcoholic drinks growth.
Restraint Impact Analysis
| Restraint | (~) % Impact on CAGR | Geographic Relevance | Impact Timeline |
|---|---|---|---|
| Health policies, taxation and consumption-reduction agendas | -1.7% | Western Europe, North America, selected APAC | Long term (≥ 4 years) |
| Advertising, marketing and branding restrictions | -1.4% | India, Middle East, EU regulatory hubs | Medium term (2-4 years) |
| Illicit, informal and non-commercial alcohol competition | -1.3% | Africa, parts of APAC, Eastern Europe | Long term (≥ 4 years) |
| Supply-chain shocks in key agricultural and packaging inputs | -1.1% | Global wine/spirits belts, EU, US | Medium term (2-4 years) |
| Real income pressure and trading-down in mature markets | -1.0% | Western Europe, Japan, North America | Short term (≤ 2 years) |
| Complex, state-level licensing and distribution bottlenecks | -0.9% | India, US states, selected APAC | Long term (≥ 4 years) |
Opportunity Analysis
Health‑data integration and wellness‑linked alcohol propositions
Rising health awareness in core Western markets is predominantly modeled as a restraint, but an underexplored strategic inversion exists: alcohol brands that credibly integrate nutrition transparency, moderation tools, and wellness positioning can capture a distinct, under‑served consumer segment willing to pay premiums for quantified health‑aligned consumption. The pivot involves building “guided moderation” ecosystems that combine lower‑ABV serves, standardized portion‑control packaging, and optional digital tracking integrations creating a fundamentally different value proposition from conventional alcohol, closer to the premium wellness FMCG model.
At scale, if 5–10% of legal-age drinkers in high‑income North American, European and affluent APAC markets opt into wellness‑positioned alcohol offerings by 2035, the untapped incremental spend pool can reach several tens of billions of dollars globally, justifying dedicated brand investments and platform builds. The upside modeled at approximately +1.4 percentage points of CAGR remains firmly in opportunity territory because current market forecasts uniformly model health trends as volume-depressing headwinds; realizing the gain requires repositioning health as value creation, which demands cross‑functional capability in nutritional science, regulatory affairs, and lifestyle brand communication that few alcohol companies have systematically built.
Opportunity Impact Analysis
| Opportunity | (~) % Potential CAGR Upside | Geographic Relevance | Execution Window |
|---|---|---|---|
| Low/no-alcohol and “alcohol adjacent” brand portfolios | +1.6% | North America, EU, Japan, urban APAC | Medium term (2-4 years) |
| Health-data integration and wellness-linked alcohol propositions | +1.4% | US, EU regulatory hubs, affluent APAC | Long term (≥ 4 years) |
| Regional premiumization via Indian single malts and local craft spirits | +1.5% | India core, select EU, APAC export corridors | Medium term (2-4 years) |
| Experiential, subscription, and direct-to-consumer alcohol ecosystems | +1.3% | North America, EU, China, India metros | Long term (≥ 4 years) |
| Online alcohol delivery and quick-commerce monetization | +1.2% | North America, India, EU, urban APAC | Medium term (2-4 years) |
| Sustainable packaging and circular supply-chain monetization | +1.1% | EU, UK, North America, Japan | Medium term (2-4 years) |
Challenges Analysis
Complex beverage supply-chain logistics and seasonality
Beverage supply chains are recognized as structurally complex, with sector commentary drawing attention to specific logistics challenges such as strong seasonality, sensitivity to timing mistakes, temperature‑controlled requirements, and the need to manage both filled and empty containers in high‑velocity networks. For alcoholic drinks, these characteristics combine with regulatory constraints to produce ongoing friction: seasonal spikes around holidays can push demand 20–40% above baseline in narrow windows, but capacity in transport, cold‑storage and retail shelf space is finite, resulting in stockouts or forced promotions that erode margins.
Wine supply‑chain analysis for 2026 notes that chains are leaner and more exposed to timing errors than at any point in the past decade, emphasizing reliance on shared data and the thin buffers now typical in JIT‑oriented beverage distribution. Transit delays of even 3–7 days on key routes during peak seasons can cause missed promotional slots and on‑trade shortages, depressing realized revenue relative to potential.
At an industry level, these frictions translate into about a 1.2 percentage‑point drag on achievable CAGR: sales still grow, but supply chains struggle to convert demand volatility into optimal volume and mix. Mitigation requires 2–4 years of investment in demand‑planning systems, central platforms that link suppliers and distributors, route optimization and capacity smoothing, so this challenge remains a medium‑term operational reality that players must continuously navigate rather than a short‑lived disruption.
Challenges Impact Analysis
| Challenge | (~) % CAGR Friction Drag | Geographic Relevance | Mitigation Horizon |
|---|---|---|---|
| Complex beverage supply-chain logistics and seasonality | -1.2% | APAC and EU logistics corridors, global FMCG hubs | Medium term (2-4 years) |
| Regulatory fragmentation and multi-layer compliance complexity | -1.1% | India, US states, EU regulatory hubs | Long term (≥ 4 years) |
| Structural moderation and shifting category mix | -1.0% | Western Europe, North America, affluent APAC | Long term (≥ 4 years) |
| Inflation-driven operational cost creep and margin pressure | -0.9% | Global, especially mid-tier producers | Medium term (2-4 years) |
| Low retail density and channel inefficiencies in growth markets | -0.8% | India core, selected APAC and Africa | Long term (≥ 4 years) |
| Data, planning and risk-management capability gaps | -0.7% | Global mid-market brands and distributors | Medium term (2-4 years) |
Geopolitical Impact Analysis
Tariff Escalation and Transatlantic Trade Disruption
Tariff escalation has become a major geopolitical pressure point for the global alcoholic drinks market. In 2025, the U.S. introduced a baseline 10% duty on nearly all imported goods, while a proposed 200% tariff on EU wine, champagne, and spirits created strong uncertainty across transatlantic alcohol trade. This followed the EU’s proposed 50% tariff on U.S. bourbon, which increased the risk of wider retaliation. Although the EU suspended retaliatory alcohol tariffs for six months from August 2025, the mid-2025 U.S.–EU trade deal still placed a 15% tariff on EU wine and spirits exports to the U.S. This marked a clear shift from the earlier zero-tariff structure and created an estimated €700 million annual cost burden on the EU’s €4.8 billion wine export flow to the U.S.
Retaliatory action also widened beyond Europe. Canada imposed 25% tariffs on U.S. beer, spirits, and wine from March 13, 2025. At the same time, U.S. tariffs on Chinese alcoholic beverage imports moved from 10% to 125%, before easing to 30% under a 90-day truce. These changes have increased landed costs, reduced producer margins, and weakened pricing flexibility across export-heavy categories. As a result, alcoholic drink companies are increasingly shifting toward regional production, local sourcing, and market-specific supply chains to reduce exposure to cross-border duties. The WTO Global Trade Outlook in April 2025 warned that further tariff escalation could reduce global merchandise trade growth by another 1.5%, placing additional pressure on wine and spirits exporters.
Raw Material Cost Inflation and Logistics Pressure
Raw material inflation and logistics disruption are increasing cost pressure across the alcoholic drinks market. The FAO Food Price Index averaged 127.2 points in 2025, up 4.3% from 2024, while the FAO Cereal Price Index was nearly 5% higher year-on-year by May 2026. Wheat costs also remained volatile, with U.S. Hard Red Winter wheat prices rising 28% year-on-year in May 2026 due to weak crop conditions. Barley, a key input for beer and malt whisky, is facing tighter supply, as global barley trade volumes are expected to decline in 2026/27 after a short recovery in 2025/26.
Packaging and logistics costs are also rising. U.S. steel and aluminum tariffs of 25–50% are increasing the cost of aluminum cans, brewing tanks, bottling equipment, and oak ageing barrels. Energy-linked disruption near the Strait of Hormuz has also affected glass production costs, with Indian brewers reporting a 20% rise in glass bottle manufacturing costs. In addition, Red Sea rerouting added more than 10 days to shipping times and contributed to a 6.7% year-on-year decline in port calls across key trade hubs. These pressures are pushing alcoholic drink producers to diversify sourcing, localize production, and manage tighter margins. In many markets, part of this cost burden is likely to be passed on to consumers through higher prices and premium product positioning.
Regional Analysis
Asia Pacific Held the Largest Share of the Global Alcoholic Drinks Market.
In 2025, Asia-Pacific held a dominant market position in the alcoholic drinks market, capturing more than 34.6% share and accounting for approximately USD 655.16 billion in regional value. The region maintained leadership due to its large legal drinking population, rising disposable incomes, urban expansion, and strong growth across organized retail and hospitality channels. Countries across East and Southeast Asia continued to support consumption through expanding tourism, food service activity, and premium beverage adoption.
According to the World Tourism Organization (UN Tourism), published in January 2025, Asia and the Pacific recorded strong international tourism recovery, reaching nearly 87% of pre-pandemic arrival levels during 2024, supporting alcohol demand across hotels, restaurants, and entertainment venues. Consumer preferences are also shifting toward premium beer, spirits, and ready-to-drink products, creating higher value generation across the region.
Europe emerged as the growing regional segment, supported by premiumization, product innovation, and stronger consumer spending on experience-based beverages. According to the Organisation for Economic Co-operation and Development (OECD), published in November 2025, alcohol consumption across OECD economies remained supported by premium product categories and mature retail infrastructure.
Key Regions and Countries Covered
- North America
- The US
- Canada
- Europe
- Germany
- France
- The UK
- Spain
- Italy
- Russia & CIS
- Rest of Europe
- APAC
- China
- Japan
- South Korea
- India
- ASEAN
- Rest of APAC
- Latin America
- Brazil
- Mexico
- Rest of Latin America
- Middle East & Africa
- GCC
- South Africa
- Rest of MEA
Key Players Analysis
Alcoholic drink producers are increasingly focused on strengthening brand differentiation, product diversification, and distribution reach to maintain a competitive position in the market. A major area of focus is ongoing beverage innovation, including the introduction of premium offerings, flavored variants, low-alcohol options, and ready-to-drink formats that align with changing consumer preferences. Companies are also investing in advanced production facilities and packaging technologies to improve product quality, operational efficiency, and sustainability performance.
Capacity enhancements across key consumption markets allow producers to respond more effectively to rising demand from both retail and hospitality channels. In addition, manufacturers place strong emphasis on brand building, digital marketing, and consumer engagement strategies to strengthen loyalty and expand market presence. Long-term collaborations with retailers, restaurants, and hospitality operators further support sales growth while reinforcing their position across premium and high-consumption beverage categories.
The Major Players In The Industry
- Allied Blenders and Distillers Ltd
- Anheuser-Busch InBev SA/NV
- Asahi Group Holdings Ltd.
- Brown-Forman Corporation
- Carlsberg Breweries AS
- Constellation Brands Inc.
- Diageo PLC
- and J. Gallo Winery
- Heineken NV
- Jack Daniels
- Koskenkorva Vodka
- Molson Coors Beverage Company
- Suntory Holdings Limited
- SVEDKA Vodka
- The Edrington Group Ltd.
Key Development
- In May 2025, Anheuser-Busch InBev SA/NV announced a USD 300 million investment in its U.S. manufacturing network, including facility upgrades and production expansion initiatives aimed at strengthening operational efficiency and supporting long-term growth across its beer portfolio.
- In July 2025, Diageo PLC announced a leadership transition as CEO Debra Crew stepped down and CFO Nik Jhangiani was appointed Interim CEO, with the company maintaining its strategic focus on portfolio optimization, productivity improvements, and sustainable long-term value creation.
Report Scope
| Report Features | Description |
|---|---|
| Market Value (2025) | USD 1,893.5 Bn |
| Forecast Revenue (2035) | USD 4,374.9 Bn |
| CAGR (2026-2035) | 8.7% |
| Base Year for Estimation | 2025 |
| Historic Period | 2020-2024 |
| Forecast Period | 2026-2035 |
| Report Coverage | Revenue Forecast, Market Dynamics, Competitive Landscape, Recent Developments |
| Segments Covered | By Type (Beer, Spirits, Wine, Cider, Perry & Rice Wine, Hard Seltzer and Others), By Alcohol Content (Low, Medium and High), By Packaging Type (Glass Bottles, Cans, Plastic Bottles, Others), By Distribution Channel (Off‑trade (At‑home consumption) and On‑trade (Out‑of‑home / HORECA)) |
| Regional Analysis | North America – The US & Canada; Europe – Germany, France, The UK, Spain, Italy, Russia & CIS, Rest of Europe; APAC– China, Japan, South Korea, India, ASEAN & Rest of APAC; Latin America– Brazil, Mexico & Rest of Latin America; Middle East & Africa– GCC, South Africa, & Rest of MEA |
| Competitive Landscape | Allied Blenders and Distillers Ltd, Anheuser-Busch InBev SA/NV, Asahi Group Holdings Ltd., Brown-Forman Corporation, Carlsberg Breweries AS, Constellation Brands Inc., Diageo PLC, E. and J. Gallo Winery, Heineken NV, Jack Daniels, Koskenkorva Vodka, Molson Coors Beverage Company, Suntory Holdings Limited, SVEDKA Vodka, The Edrington Group Ltd.. |
| Customization Scope | Customization for segments, region/country-level will be provided. Moreover, additional customization can be done based on the requirements. |
| Purchase Options | We have three licenses to opt for: Single User License, Multi-User License (Up to 5 Users), Corporate Use License (Unlimited Users and Printable PDF) |





































