
Quick Navigation
- Report Overview
- Key Takeaways
- Product Type Analysis
- Device / Control Mechanism Analysis
- Capacity Analysis
- Application / End Use Analysis
- Distribution Channel Analysis
- Price Range Analysis
- Key Market Segments
- Regional Analysis
- Key Regions and Countries
- Drivers
- Restraints
- Challenges
- Opportunities
- Key Company Insights
- Recent Developments
- Report Scope
Report Overview
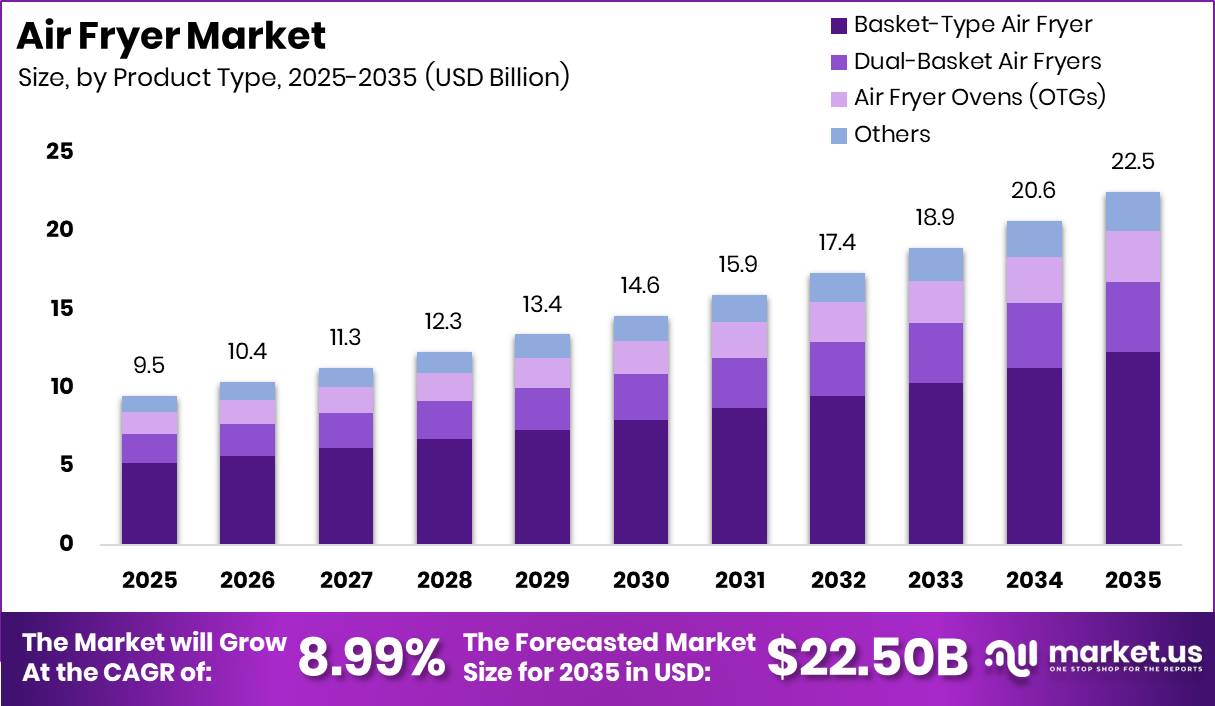
Global Air Fryer Market size is expected to be worth around USD 22.50 Billion by 2035 from USD 9.51 Billion in 2025, growing at a CAGR of 8.99% during the forecast period 2026 to 2035.
The air fryer market covers countertop cooking appliances that circulate hot air at high speed to cook food with minimal oil. The market spans basket-type units, dual-basket formats, and oven-style configurations. Products serve both residential and commercial buyers across offline and online retail channels. This means the market sits at the intersection of health-focused cooking, energy efficiency, and appliance consolidation trends.
Key Takeaways
- Market size in 2025: USD 9.51 Billion
- Forecast market size by 2035: USD 22.50 Billion
- CAGR (2026 to 2035): 8.99%
- Dominant product type segment: Basket-Type Air Fryer with 54.60% share
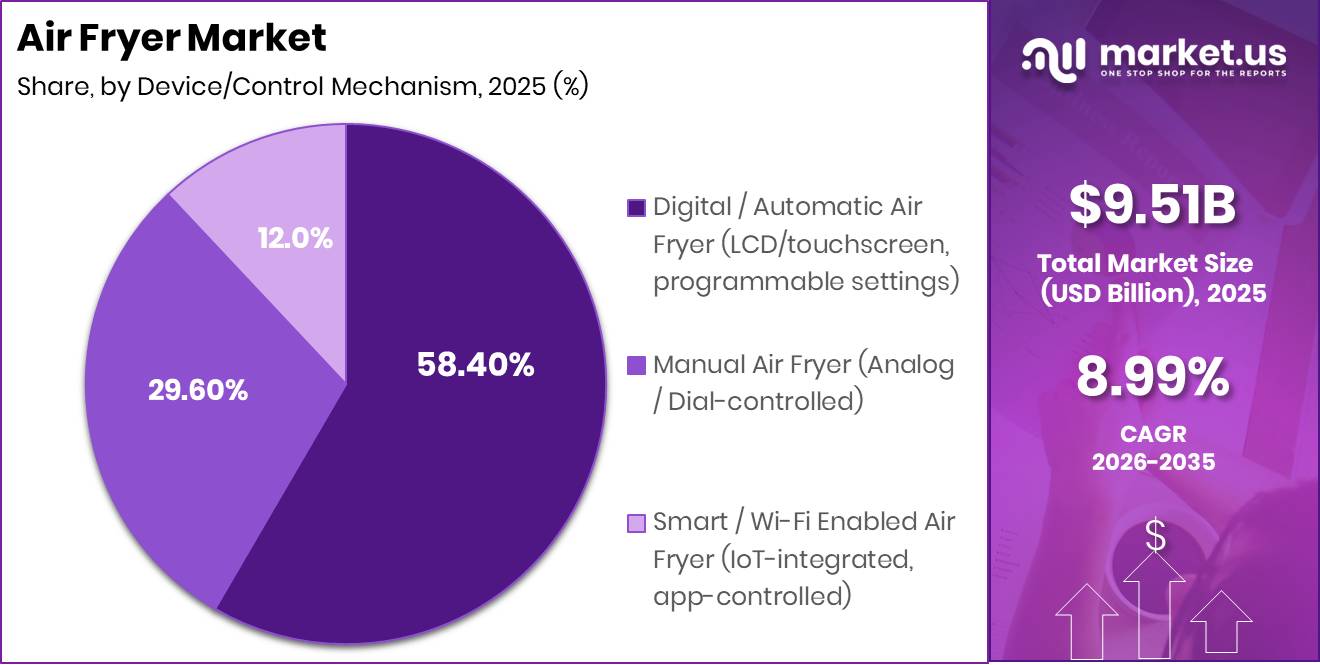
- Dominant device/control segment: Digital/Automatic Air Fryer with 58.40% share
- Dominant capacity segment: Medium (4 to 6 Litres) with 48.00% share
- Dominant application segment: Residential/Household with 83.50% share
- Dominant distribution channel: Offline with 64.00% share
- Dominant price range segment: Mid-Range (USD 50 to USD 150) with 43.00% share
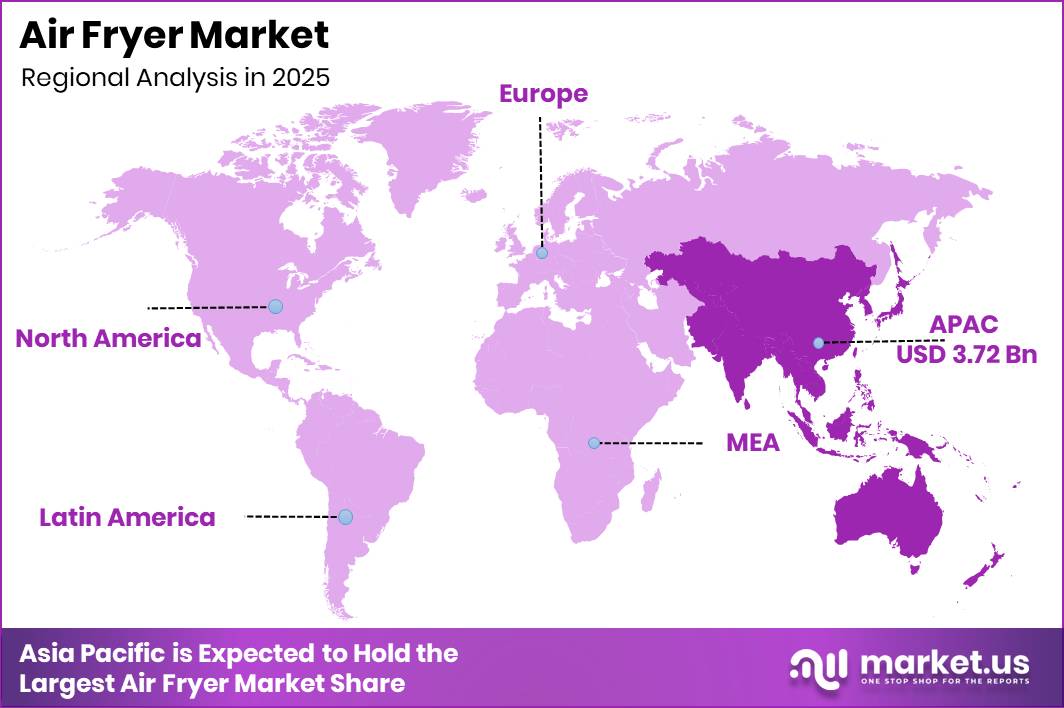
- Dominant region: Asia Pacific with 39.20% share, valued at USD 3.72 Billion
According to Aviva, 68% of UK adults owned an air fryer in 2025. This figure signals that the category has crossed mass-market adoption thresholds in at least one major Western economy. Brands that entered early are now competing for replacement buyers and trade-up purchases rather than first-time owners.
As reported by Sagentia, 77% of air fryer owners used their appliance at least two to three times per week. This frequency confirms that air fryers function as daily-use appliances rather than occasional gadgets. High-frequency use creates upstream demand for accessories, replacement parts, and next-generation model upgrades, which broadens revenue streams beyond the initial hardware sale.
Product Type Analysis
Basket-Type Air Fryer dominates with 54.60% due to broad consumer familiarity and low price entry.
In 2025, Basket-Type Air Fryer held a dominant market position in the By Product Type segment of the Air Fryer Market, with a 54.60% share. This format benefits from the widest price range, the largest retail shelf presence, and strong consumer recognition built over more than a decade of market presence. Brands can capture first-time buyers at lower price points before upselling to premium variants.
Dual-Basket Air Fryers held a 20.00% share, driven by demand from multi-person households seeking time-efficient meal preparation. The dual-zone format allows simultaneous cooking of different foods at different temperatures. This positions the sub-segment as a direct challenger to single-basket models among family-oriented buyers.
Air Fryer Ovens (OTGs) captured 14.40% of the market, serving buyers who require larger cooking volumes and oven-replacement functionality. These units appeal to consumers seeking a single countertop solution for baking, toasting, and air-frying tasks. As per our research, air fryers cook food 15% to 30% faster than equivalent oven recipes, and OTG variants extend this efficiency advantage to larger batch sizes. Others accounted for the remaining 11.00% share collectively.
Device / Control Mechanism Analysis
Digital / Automatic Air Fryer dominates with 58.40% due to programmable precision and broad consumer appeal.
In 2025, Digital/Automatic Air Fryer held a dominant market position in the By Device/Control Mechanism segment of the Air Fryer Market, with a 58.40% share. LCD and touchscreen interfaces allow users to set exact temperatures and cooking durations without guesswork. This precision reduces cooking errors, supports product premiumization, and gives brands a platform to introduce differentiated software features over product generations.
Manual Air Fryer (Analog/Dial-controlled) held 29.60% share, maintaining relevance through price accessibility and mechanical simplicity. These units face no software obsolescence risk and require minimal maintenance. By contrast, their limited functionality creates a structural upgrade path toward digital models, which benefits brands with multi-tier product portfolios.
Smart/Wi-Fi Enabled Air Fryer (IoT-integrated, app-controlled) accounted for 12.00% of the market. App connectivity enables remote monitoring, recipe integration, and firmware-driven feature updates after purchase. This sub-segment generates recurring engagement opportunities and positions brands to monetize software ecosystems alongside hardware revenue.
Capacity Analysis
Medium (4 to 6 Litres) dominates with 48.00% due to fit with standard household cooking volumes.
In 2025, Medium (4 to 6 Litres) held a dominant market position in the By Capacity segment of the Air Fryer Market, with a 48.00% share. This capacity tier serves two-to-four-person households, covering the most common family size across North America, Europe, and urban Asia Pacific. Brands concentrating product development in this range address the largest addressable buyer pool and command the strongest retail placement.
Large (7 to 12+ Litres) captured 30.00% share, driven by families, batch-cooking households, and light-commercial users. This tier competes directly with conventional ovens on capacity grounds. Buyers who switch from ovens to large-format air fryers represent a high-value segment, as their willingness to pay supports premium pricing and higher average selling prices.
Compact (1 to 3 Litres) held 22.00% share, serving solo consumers, students, and apartment dwellers with limited counter space. This tier faces the strongest price pressure from budget brands. However, its growth trajectory is supported by rising single-person household rates across Europe and East Asia, which expand the addressable base over the medium term.
Application / End Use Analysis
Residential / Household dominates with 83.50% due to widespread consumer adoption and daily-use cooking behavior.
In 2025, Residential/Household held a dominant market position in the By Application/End Use segment of the Air Fryer Market, with an 83.50% share. Urban households drive the highest unit volumes, supported by convenience priorities and health-oriented cooking preferences. Rural household adoption is expanding as retail distribution networks and affordable product tiers reach lower-density markets. Data from Sagentia shows 76% of users cooked products in an air fryer despite packaging providing no air-fryer-specific instructions, which indicates strong independent adoption behavior that reduces the need for brand-led consumer education investment.
Commercial accounted for 16.50% of the market, spanning quick-service restaurants, full-service restaurants, hotels and hospitality, cafes and cloud kitchens, and institutional catering in hospitals and schools. Sagentia found that 19% of UK adults expressed interest in cooking ready meals in an air fryer, signaling a preference shift that food-service operators can exploit by incorporating air-fried menu items. Commercial buyers prioritize durability and throughput over consumer-style features, creating a distinct product specification track for manufacturers targeting this segment.
Distribution Channel Analysis
Offline dominates with 64.00% due to in-store trial capability and established retail infrastructure.
In 2025, Offline held a dominant market position in the By Distribution Channel segment of the Air Fryer Market, with a 64.00% share. Hypermarkets, supermarkets, specialty kitchen stores, department stores, and exclusive brand outlets give consumers direct product access before purchase. Physical retail also reduces return rates by enabling capacity and size verification in person. This structural advantage will sustain offline dominance in mature markets even as online channels expand.
Online channels are gaining share through brand-owned direct-to-consumer websites, e-commerce marketplaces such as Amazon, Flipkart, and JD.com, and social commerce platforms. Digital channels allow brands to control pricing narratives, gather first-party consumer data, and run targeted promotions without intermediary margin loss. However, the inability to physically inspect products increases return exposure, creating a profitability headwind that brands must manage through accurate product content and proactive customer service.
Price Range Analysis
Mid-Range (USD 50 to USD 150) dominates with 43.00% due to strong value-to-feature ratio for mainstream buyers.
In 2025, Mid-Range (USD 50 to USD 150) held a dominant market position in the By Price Range segment of the Air Fryer Market, with a 43.00% share. This price band captures buyers who seek reliable performance without premium pricing. Digital controls, larger capacities, and multi-function cooking modes are accessible at this tier, making it the most competitive battleground among established brands. Economy/Budget (below USD 50), Premium (USD 150 to USD 300), and Ultra-Premium/Professional (above USD 300) collectively hold the remaining share.
Key Market Segments
By Product Type
- Basket-Type Air Fryer
- Dual-Basket Air Fryers
- Air Fryer Ovens (OTGs)
- Others
By Device / Control Mechanism
- Manual Air Fryer (Analog/Dial-controlled)
- Digital / Automatic Air Fryer (LCD/touchscreen, programmable settings)
- Smart / Wi-Fi Enabled Air Fryer (IoT-integrated, app-controlled)
By Capacity
- Compact (1 to 3 Litres)
- Medium (4 to 6 Litres)
- Large (7 to 12+ Litres)
By Application / End Use
- Residential / Household
- Urban households
- Rural households
- Commercial
- Quick-service restaurants (QSRs)
- Full-service restaurants
- Hotels and hospitality
- Cafes and cloud kitchens
- Institutional catering (hospitals, schools)
By Distribution Channel
- Offline
- Hypermarkets and supermarkets (e.g., Walmart, Carrefour)
- Specialty kitchen/appliance stores
- Department stores
- Exclusive brand outlets
- Online
- Brand-owned websites / D2C (Direct-to-Consumer)
- E-commerce marketplaces (Amazon, Flipkart, JD.com)
- Social commerce
By Price Range
- Economy / Budget (Below USD 50)
- Mid-Range (USD 50 to USD 150)
- Premium (USD 150 to USD 300)
- Ultra-Premium / Professional (Above USD 300)
Regional Analysis
Asia Pacific Dominates the Air Fryer Market with a Market Share of 39.20%, Valued at USD 3.72 Billion
Asia Pacific held 39.20% of the global air fryer market, valued at USD 3.72 Billion in 2025. China and India anchor this position through manufacturing scale, rising middle-class purchasing power, and expanding modern retail infrastructure. Urban density drives demand for compact, efficient cooking appliances that fit smaller kitchen footprints. This makes Asia Pacific both the production hub and the fastest-growing consumption base simultaneously.
North America represents the second-largest revenue contributor, supported by high household appliance penetration rates and consumer willingness to pay for multi-function cooking platforms. The US market benefits from strong retail networks across both mass-market and specialty channels. Premium and ultra-premium product tiers perform better here than in any other region, which raises average selling prices and supports stronger brand margins.
Europe benefits from growing health-consciousness among consumers and rising energy costs that make air fryers economically attractive against conventional ovens. The UK leads in adoption rates within the region. Regulatory pressure to reduce household energy consumption strengthens the air fryer value proposition across Germany, France, and the broader EU market.
Key Regions and Countries
North America
- US
- Canada
Europe
- Germany
- France
- The UK
- Spain
- Italy
- Rest of Europe
Asia Pacific
- China
- Japan
- South Korea
- India
- Australia
- Rest of APAC
Latin America
- Brazil
- Mexico
- Rest of Latin America
Middle East and Africa
- GCC
- South Africa
- Rest of MEA
Drivers
Home-meal savings economics drives air fryer demand as consumers seek lower-cost alternatives to dining out. The USDA’s May 2026 Food Price Outlook projected food-at-home prices to rise 3.2% in 2026, compared with 3.8% growth for food-away-from-home prices, maintaining a cost advantage for home cooking. May 2026 consumer price data showed the monthly food-at-home index increasing 0.1%, versus 0.3% for food-away-from-home, reinforcing the ongoing gap. Air fryers benefit from this trend by enabling quick meal preparation while using less energy than conventional ovens for small portions.
Buyers increasingly view air fryers as practical substitutes for takeout meals, prepared foods, and traditional oven reheating. This shifts purchasing decisions from discretionary appliance spending toward household cost management. The value proposition is particularly strong for consumers focused on convenience and food-budget optimization. The widening cost differential between eating at home and dining out continues to support air fryer adoption across North America, the UK, and urban Asia Pacific.
| Driver | (~) % Impact on CAGR Forecast | Geographic Relevance | Impact Timeline |
|---|---|---|---|
| Home-meal savings economics | +2.7% | North America core, UK, Western Europe, urban APAC | Short term (≤ 2 years) |
| One-person household expansion | +2.1% | North America, EU, Japan, South Korea | Medium term (2-4 years) |
| Energy-efficiency product upgrade cycle | +1.8% | North America, EU, advanced APAC | Medium term (2-4 years) |
| Countertop appliance consolidation | +2.0% | North America, EU, urban Asia, GCC | Short term (≤ 2 years) |
| Retail assortment premiumization | +1.6% | North America core, EU omni-channel retail, Australia | Short term (≤ 2 years) |
| Batch-cooking and reheating utility | +1.5% | North America, Europe, middle-income APAC metros | Long term (≥ 4 years) |
Restraints
Online channel return leakage directly restrains air fryer market profitability due to the category’s strong reliance on e-commerce and omnichannel retail. U.S. retail e-commerce sales reached USD 326.7 Billion in Q1 2026, increasing 9.7% year over year, indicating that a growing share of appliance purchases occurs online. Digital buying decisions rely on product images and reviews rather than physical inspection. This increases the risk of dissatisfaction related to capacity, noise levels, countertop footprint, or perceived build quality.
For low- and mid-priced air fryers, return processing and refurbishment costs erode margins quickly. Products damaged during transit add further to reverse-logistics expenses. A portion of gross sales therefore fails to convert into retained revenue after returns and handling costs. Rising online sales are increasing exposure to return-related profitability pressures across North America, the EU, and advanced Asia Pacific e-commerce corridors.
| Restraint | (~) % Impact on CAGR Forecast | Geographic Relevance | Impact Timeline |
|---|---|---|---|
| Price-sensitive discretionary demand | -1.9% | North America core, UK, Western Europe, urban APAC | Short term (≤ 2 years) |
| Online channel return leakage | -1.5% | North America, EU, advanced APAC e-commerce corridors | Short term (≤ 2 years) |
| Low-cost private-label pressure | -1.4% | North America core, EU mass retail, Latin America spill-over | Medium term (2-4 years) |
| Limited efficiency monetization | -1.2% | North America, EU, Canada, developed APAC | Medium term (2-4 years) |
| Kitchen space substitution ceiling | -1.3% | Japan, South Korea, EU urban cores, tier-1 cities globally | Long term (≥ 4 years) |
| Replacement demand immaturity | -1.1% | Global installed base, mature retail markets first | Long term (≥ 4 years) |
Challenges
Durability and return-rate uncertainty remains a key challenge in the air fryer market, particularly across online sales channels where product expectations vary widely. Common consumer complaints include basket-coating wear, fan noise, mechanical failures, and uneven cooking performance. Intense price competition has pushed some manufacturers to reduce material and component quality to meet lower retail price points. Heavy-use consumers face higher failure rates and shorter product lifespans as a result.
Product returns and warranty claims create additional costs through reverse logistics, refurbishment, and customer service activities. Negative ownership experiences reduce brand loyalty and discourage repeat purchases. These pressures create operational and profitability challenges even when underlying consumer demand remains firm. Manufacturers that invest in durable materials and clear maintenance guidance can differentiate and reduce return volumes, improving net margin outcomes.
| Challenge | (~) % CAGR Friction Drag | Geographic Relevance | Mitigation Horizon |
|---|---|---|---|
| Promotional dependency risk | -1.4% | North America core, EU omni-channel retail | Short term (≤ 2 years) |
| Category clutter and cannibalization | -1.3% | North America, EU, APAC modern trade | Medium term (2-4 years) |
| Durability and return uncertainty | -1.1% | Global online-heavy channels | Medium term (2-4 years) |
| Efficiency-signal underutilization | -1.0% | North America, EU, Canada, developed APAC | Long term (≥ 4 years) |
| Input-cost and pricing squeeze | -1.2% | North America, EU, import-dependent APAC | Short term (≤ 2 years) |
| Replacement-cycle length opacity | -1.1% | Global installed base, especially mature markets | Long term (≥ 4 years) |
Opportunities
Single-person compact air fryers represent a distinct growth opportunity as household structures shift toward solo living. In 2025, the EU had 203.1 million households, with 37.5% consisting of a single adult, while only 23.4% included children. This demographic profile creates direct demand for sub-3-liter air fryers, compact stackable designs, and lower-power models optimized for individual use. Key purchase factors in this segment include countertop footprint, ease of cleaning, and portion control.
The opportunity is particularly relevant for apartment dwellers, students, and older adults living alone. Manufacturers can address this demand through dedicated product designs and targeted retail positioning. Brands that launch purpose-built compact lines with clear single-serve messaging can capture this segment before generalist competitors adapt their existing mid-size portfolios. Overall, the growth of single-person households creates a structurally distinct market for compact, space-efficient air-frying solutions.
| Opportunity | (~) % Potential CAGR Upside | Geographic Relevance | Execution Window |
|---|---|---|---|
| Single-person compact formats | +2.4% | EU core, North America, Japan, South Korea | Short term (≤ 2 years) |
| Meal-kit and grocery bundling | +2.0% | North America core, UK, Western Europe | Medium term (2-4 years) |
| Premium energy-smart upgrades | +1.8% | North America, EU, advanced APAC | Medium term (2-4 years) |
| Multi-cook replacement platforms | +2.2% | North America, EU, urban Asia | Short term (≤ 2 years) |
| Elder-friendly assisted cooking | +1.6% | Japan, EU, South Korea, developed North America | Long term (≥ 4 years) |
| B2B light-commercial adoption | +1.7% | GCC, Southeast Asia, North America foodservice fringe | Medium term (2-4 years) |
Key Company Insights
Koninklijke Philips N.V. (Versuni) built its air fryer leadership through RapidAir technology and a multi-generation product architecture that spans entry-level to premium tiers. In February 2025, Versuni launched the Philips Airfryer 3000 Series with 16 cooking methods and a Trade-Up and Recycle Program, signaling a shift toward ecosystem monetization. Versuni’s HomeID platform integration strengthens post-purchase engagement, creating recurring digital touchpoints that single-product competitors cannot easily replicate.
SharkNinja Operating LLC has pursued aggressive portfolio expansion through multi-function platforms, but its safety record introduces brand risk. As reported by the U.S. Consumer Product Safety Commission, approximately 1,846,400 Ninja Foodi units were recalled in May 2025 after 106 burn injury reports. In October 2025, SharkNinja launched the Ninja CRISPi PRO glass air fryer to reinforce quality credentials. The recall exposes the tension between high-velocity product launches and durable engineering standards, a balance that will define brand equity outcomes over the next cycle.
As per our research, 19% of UK adults reported experiencing a potential or actual air-fryer-related fire hazard, and 9% reported smoke from their appliance. Six Tower Air Fryer models were also recalled by the UK Office for Product Safety and Standards in April 2025, confirming that product safety is a sector-wide challenge, not isolated to one brand.
Key Players
- Koninklijke Philips N.V. (Versuni)
- SharkNinja Operating LLC
- Groupe SEB
- Instant Brands Inc.
- Cosori (Vesync Co., Ltd.)
- Midea Group
- Xiaomi Corporation
- Breville Group Limited
- Cuisinart (Conair Corporation)
- Spectrum Brands Inc.
- Hamilton Beach Brands
- Electrolux AB
- TTK Prestige Ltd.
- NuWave LLC
- Corelle Brands LLC (Instant/Pyrex)
Recent Developments
- June 2026 – Ninja unveiled the Crispi DualZone Air Fryer, adding dual-zone cooking capability to its glass air fryer range and enabling simultaneous cooking at different temperatures with Smart Finish synchronization technology.
- November 2025 – Crompton Greaves Consumer Electricals launched the Ameo Air Fryer Series in India, targeting health-conscious consumers with advanced air-circulation technology and a product range starting at ₹8,999.
- 2025 – Versuni strengthened its air fryer ecosystem by linking the Philips Airfryer 3000 Series with the Philips HomeID digital platform, providing access to thousands of recipes and personalized cooking guidance for users.
Report Scope
| Report Features | Description |
|---|---|
| Market Value (2025) | USD 9.51 Billion |
| Forecast Revenue (2035) | USD 22.50 Billion |
| CAGR (2026-2035) | 8.99% |
| Base Year for Estimation | 2025 |
| Historic Period | 2020-2024 |
| Forecast Period | 2026-2035 |
| Report Coverage | Revenue Forecast, Market Dynamics, Market Opportunity Analysis, Technology and Innovation Landscape, Competitive Landscape, Recent Developments |
| Segments Covered | By Product Type (Basket-Type Air Fryer, Dual-Basket Air Fryers, Air Fryer Ovens (OTGs), Others); By Device/Control Mechanism (Manual Air Fryer, Digital/Automatic Air Fryer, Smart/Wi-Fi Enabled Air Fryer); By Capacity (Compact 1-3 Litres, Medium 4-6 Litres, Large 7-12+ Litres); By Application/End Use (Residential/Household, Commercial); By Distribution Channel (Offline, Online); By Price Range (Economy/Budget, Mid-Range, Premium, Ultra-Premium/Professional) |
| Regional Analysis | North America (US and Canada), Europe (Germany, France, The UK, Spain, Italy, and Rest of Europe), Asia Pacific (China, Japan, South Korea, India, Australia, and Rest of APAC), Latin America (Brazil, Mexico, and Rest of Latin America), Middle East and Africa (GCC, South Africa, and Rest of MEA) |
| Competitive Landscape | Koninklijke Philips N.V. (Versuni), SharkNinja Operating LLC, Groupe SEB, Instant Brands Inc., Cosori (Vesync Co., Ltd.), Midea Group, Xiaomi Corporation, Breville Group Limited, Cuisinart (Conair Corporation), Spectrum Brands Inc., Hamilton Beach Brands, Electrolux AB, TTK Prestige Ltd., NuWave LLC, Corelle Brands LLC (Instant/Pyrex) |
| Customization Scope | Customization for segments, region/country-level will be provided. Additional customization can be done based on requirements. |
| Purchase Options | We have three licenses to opt for: Single User License, Multi-User License (Up to 5 Users), Corporate Use License (Unlimited User and Printable PDF) |


