


Report Overview
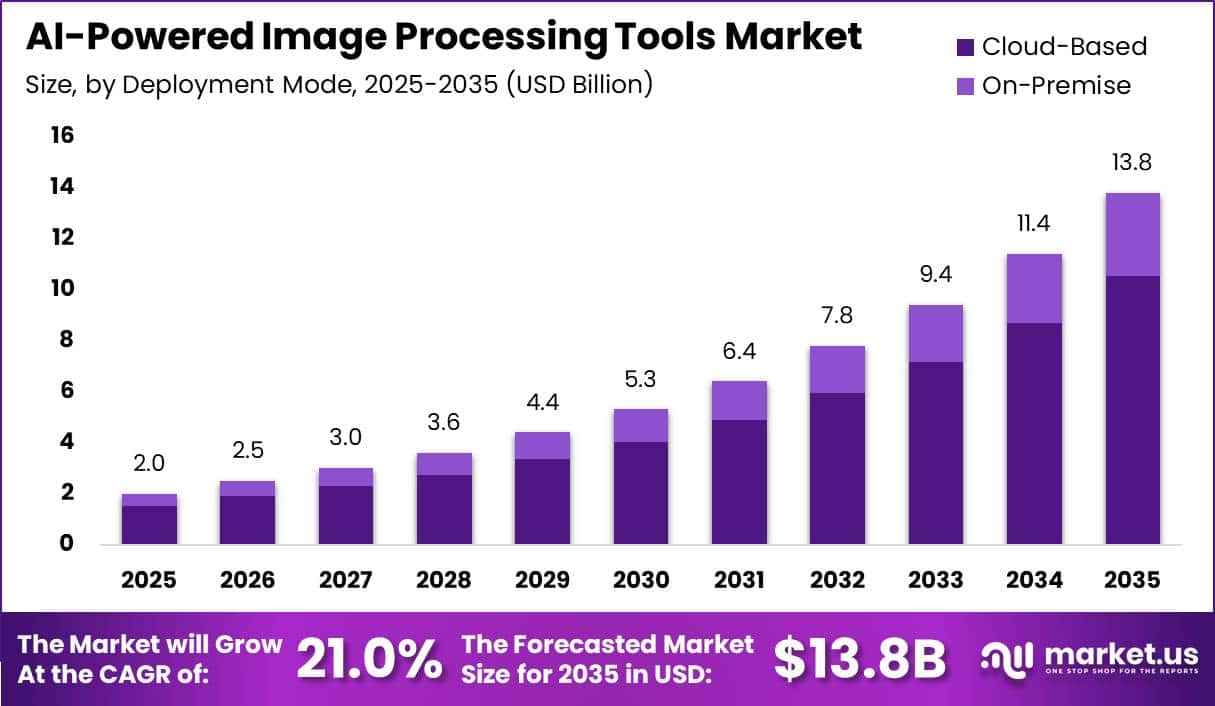
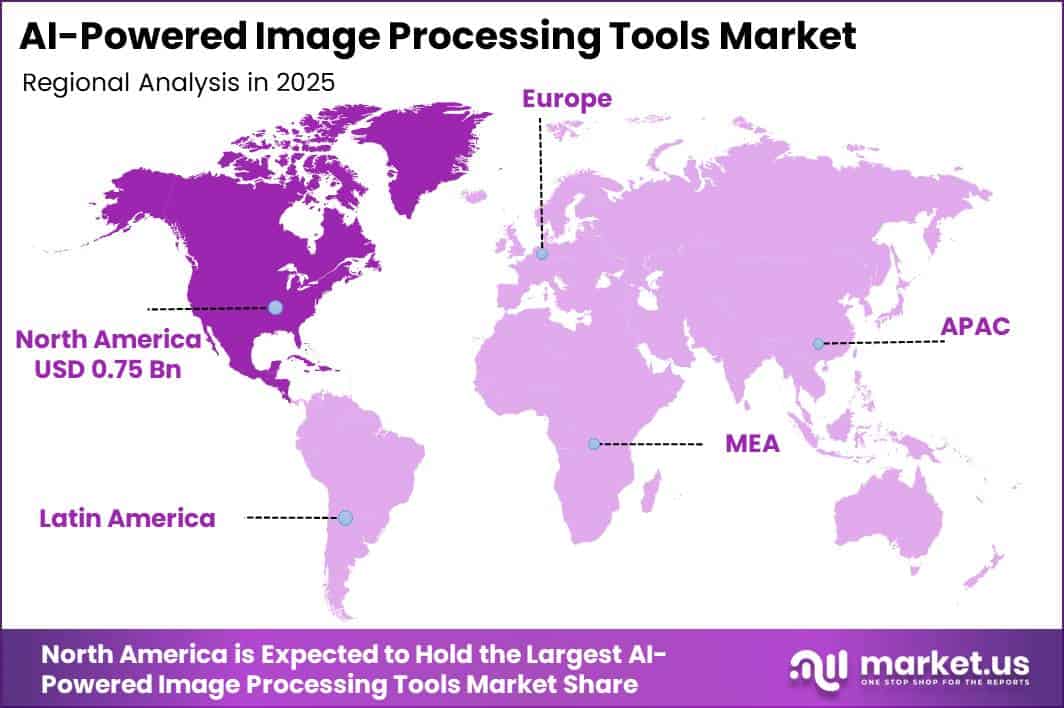
In 2025, the Global AI-Powered Image Processing Tools Market was valued at USD 2.0 billion. The market is projected to grow at a CAGR of 21.0% during 2026–2035, reaching approximately USD 13.8 billion by 2035. North America dominated the global market in 2025, accounting for more than 37.5% of the total market share and generating approximately USD 0.75 billion in revenue.
Growth is being supported by the increasing volume of photographs, videos, medical scans, and machine-vision data processed by businesses. According to the International Telecommunication Union, 6.0 billion people, representing 74% of the global population, used the internet in 2025, compared with 5.8 billion in 2024. Mobile-cellular subscriptions reached 9.2 billion, while mobile broadband accounted for 89% of total mobile subscriptions.
This expanding digital ecosystem is increasing demand for image enhancement, object detection, background removal, compression, content moderation, and visual search solutions. Industrial automation is also contributing to market growth. The International Federation of Robotics reported that 542,000 industrial robots were installed in 2024, while the global operating stock increased by 9% to 4.6 million units.
North America maintains its leading position due to strong enterprise AI adoption and extensive cloud infrastructure. The U.S. Census Bureau reported that 17%–20% of American businesses used AI between December 2025 and May 2026. Adoption reached 37% among companies employing at least 250 people.
In Canada, business AI usage doubled from 6.1% in 2024 to 12.2% in 2025. Among AI-using businesses, 25.7% purchased cloud services or storage, while 17.9% of all businesses planned to adopt AI software. However, a 21.0% CAGR would increase the market to approximately USD 13.45 billion by 2035. Reaching USD 13.8 billion would require an implied CAGR of approximately 33.3%.
Key Takeaway
- The AI-Powered Image Processing Tools Market was valued at USD 2.0 billion in 2025 and is projected to reach USD 13.8 billion by 2035, growing at a CAGR of 21.0%.
- Cloud-based deployment held a dominant 76.3% share of the market in 2025.
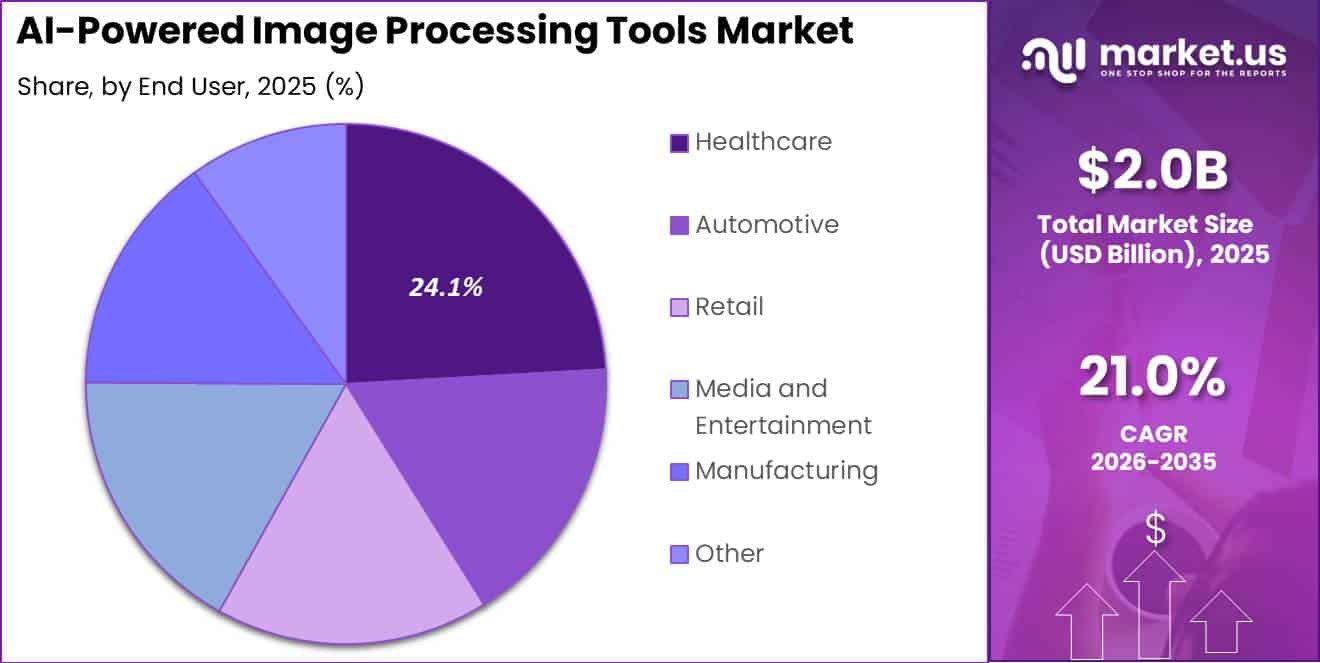
- The healthcare segment, led by end users with a 24.1% share in 2025, was driven by rising imaging volumes.
- North America led the market in 2025 with a 37.5% share and USD 0.75 billion in revenue.
By Deployment Mode
In 2025, the Cloud-based segment maintained a dominant position in the AI-powered image processing tools market, accounting for a 76.3% share. Cloud deployment enables businesses to process large volumes of image data without investing in dedicated graphics processing units, physical servers, or storage infrastructure.
Companies can increase computing capacity during periods of high demand and reduce it when workloads decline. Usage-based pricing also helps lower initial technology costs, making advanced image processing tools more accessible to businesses of different sizes.
According to Eurostat, 52.7% of European Union enterprises purchased cloud computing services in 2025. Cloud adoption was significantly higher among large enterprises, reaching 84.6%. Among businesses using cloud services, 77.2% purchased infrastructure-related solutions, including database hosting, file storage, and computing power.
By End User
In 2025, the Healthcare segment held a dominant position in the AI-powered image processing tools market, accounting for a 24.1% share. Hospitals and diagnostic centres produce large and complex medical image files that require rapid reconstruction, segmentation, measurement, anomaly detection, and clinical review.
AI-powered tools help healthcare providers manage these tasks more efficiently while improving consistency across imaging workflows. According to NHS England, 49.9 million imaging tests were conducted in the year ending March 2025, representing an increase of 5.9%. This total included 8.3 million CT scans, which rose by 8.7%, and 4.9 million MRI scans, which increased by 10.1%.
Key Market Segments
By Deployment Mode
- Cloud-Based
- On-Premise
By End User
- Healthcare
- Automotive
- Retail
- Media and Entertainment
- Manufacturing
- Other
Geopolitical Impact Analysis
Geopolitical tensions are affecting the AI-powered image processing tools market through semiconductor supply, cloud infrastructure, energy costs, and global logistics. The WTO reported that trade in AI-enabling goods, including chips, semiconductors and data-transmission equipment, increased by 21.9% to USD 4.1 trillion in 2025 and contributed 42% of global trade growth. Asia represented 62% of this trade, compared with 16% for North America, highlighting the industry’s dependence on Asian manufacturing.
Although many AI-related goods remain protected from new tariffs, the share of global trade conducted under most-favoured-nation terms declined to 72% by February 2026. Export restrictions, tariff uncertainty and US-China supply-chain changes are therefore increasing inventory, compliance and sourcing costs for GPUs, memory, servers, networking equipment, cooling systems and transformers.
Regional conflicts are also raising energy and transportation costs. UNCTAD reported that Strait of Hormuz transits dropped by more than 95% in March 2026, while oil-tanker freight rates rose by over 90%. On 10 March 2026, crude oil approached USD 90 per barrel, and Asian LNG reached around USD 16 per MMBtu.
The WTO estimated that sustained energy prices could reduce 2026 merchandise-trade growth by 0.5 percentage points. Meanwhile, data-centre electricity demand increased by 17% in 2025, compared with 3% growth in global electricity demand, increasing operating costs for AI vendors.
Regional Analysis
In 2025, North America held the leading position in the AI-powered image processing tools market, accounting for 37.5% of global revenue and generating USD 0.75 billion. The region benefits from advanced cloud infrastructure, early business adoption of AI, and strong demand from healthcare, retail, security, and manufacturing industries. AI image processing systems require high-performance servers, large storage capacity, and low-latency networks to support model training and real-time analysis.
According to the U.S. Department of Energy’s 2025 data-centre update, data centres could account for 11.8% of national electricity consumption by 2030, within an estimated range of 9.5% to 15.3%. Continued infrastructure investment supports medical image analysis, visual search, image enhancement, automated surveillance and industrial quality inspection.
Asia Pacific is expected to record the fastest growth due to its large digital population, electronics manufacturing base and expanding mobile connectivity. WIPO reported that intellectual property offices in Asia received 2.6 million patent applications in 2024, representing 70.1% of the global total. This innovation activity supports progress in computer vision, semiconductor design and imaging software.
GSMA reported that mobile technologies contributed USD 950 billion to the regional economy in 2024, while 5G is projected to account for 50% of mobile connections by 2030. Faster networks, wider smartphone use, affordable software plans, and expanding data centres are expected to increase demand for photo editing, visual commerce, medical imaging, and industrial inspection tools.
Key Regions and Countries
North America
- US
- Canada
Europe
- Germany
- France
- The UK
- Spain
- Italy
- Rest of Europe
Asia Pacific
- China
- Japan
- South Korea
- India
- Australia
- Rest of APAC
Latin America
- Brazil
- Mexico
- Rest of Latin America
Middle East & Africa
- GCC
- South Africa
- Rest of MEA
Market Dynamics
Drivers
| Driver | (~) % CAGR | Geographic Relevance | Impact Timeline |
|---|---|---|---|
| Enterprise Multimodal Adoption | +2.2% | Global | Short term (2 years or less) |
| Medical Imaging Digitization | +1.2% | North America, Europe and East Asia | Short term (2 years or less) |
| Automated Visual Inspection | +1.0% | East Asia, Europe and North America | Medium term (2 to 4 years) |
| Digital Commerce Content Scale | +0.7% | Global | Short term (2 years or less) |
| Mobile Camera Data Growth | +0.5% | Asia Pacific and Latin America | Short term (2 years or less) |
Enterprise Multimodal Adoption
Enterprise multimodal adoption is the strongest active driver because organizations are moving image recognition, enhancement, and generation from isolated trials into recurring cloud, API, and software-seat workflows. According to the OECD, firm-level AI use rose from 14.2% in 2024 to 20.2% in 2025, representing 42.4% annual growth.
Eurostat reported that 20.0% of EU enterprises used AI in 2025, up 6.5 percentage points from 13.5% in 2024, while adoption reached 55.03% among large enterprises. The Australian Bureau of Statistics found that 12% of businesses used AI during 2024–2025, including 35% of large firms and 11% of small firms.
Restraints
| Restraint | (~) % CAGR | Geographic Relevance | Impact Timeline |
|---|---|---|---|
| Biometric AI Restrictions | -2.0% | Europe and North America | Short term (2 years or less) |
| Advanced Chip Export Controls | -1.3% | China-facing supply chains | Medium term (2 to 4 years) |
| Copyright Licensing Exposure | -1.0% | North America, Europe and Japan | Medium term (2 to 4 years) |
| Cross-Border Data Localization | -0.7% | Europe, Middle East and Asia Pacific | Medium term (2 to 4 years) |
| Public-Sector Procurement Limits | -0.5% | Global public sector | Short term (2 years or less) |
Biometric AI Restrictions
Biometric AI restrictions represent the strongest immediate restraint because facial analysis and identity-related image tools can be legally blocked rather than merely delayed. The European Commission states that 8 prohibited AI practices became effective in February 2025, including untargeted scraping of internet or CCTV images for facial-recognition databases, while transparency duties for generated images take effect in August 2026.
The EU Official Journal sets penalties for prohibited practices at up to 7% of worldwide annual turnover. European Commission GDPR guidance also permits temporary or permanent processing bans and penalties reaching 4% of worldwide turnover. In the United States, the Federal Trade Commission imposed a 5-year facial-recognition surveillance ban in an enforcement case and required deletion of tens of thousands of collected images and related algorithms.
Challenges
| Challenge | (~) % CAGR | Geographic Relevance | Mitigation Horizon |
|---|---|---|---|
| Power-Constrained AI Compute | -1.6% | North America, Europe and East Asia | Medium term (2 to 4 years) |
| Training-Data Quality Gaps | -1.0% | Global | Medium term (2 to 4 years) |
| Vision-Model Reliability Gaps | -0.8% | Regulated industries worldwide | Medium term (2 to 4 years) |
| Specialized Vision Talent Scarcity | -0.6% | Global | Long term (4 years or more) |
| Synthetic-Media Security Burden | -0.5% | Global | Short term (2 years or less) |
Power-Constrained AI Compute
Power-constrained AI compute is the largest operating challenge because high-resolution image generation, video analysis, and real-time vision inference require dense accelerator clusters running continuously.
According to the International Energy Agency’s 2026 outlook, global data-center electricity consumption reached approximately 485 TWh in 2025 and could approach 950 TWh by 2030, while consumption from AI-focused facilities could triple. The U.S. Energy Information Administration estimated that servers alone represented 7% of commercial-sector electricity consumption in 2025.
Ireland’s Central Statistics Office reported that data centers consumed 23% of metered electricity in 2025, compared with 22% in 2024. This concentration makes grid access, cooling capacity, and accelerator utilization persistent bottlenecks.
Opportunities
| Opportunity | (~) % CAGR | Geographic Relevance | Execution Window |
|---|---|---|---|
| Edge Vision Monetization | +1.4% | Global | Medium term (2 to 4 years) |
| Synthetic Data Platforms | +1.0% | North America, Europe and East Asia | Medium term (2 to 4 years) |
| Spatial Computing Workflows | +0.8% | North America and East Asia | Long term (4 years or more) |
| Low-Resource Visual Models | +0.6% | Africa, Latin America and Southeast Asia | Long term (4 years or more) |
| Climate Imaging Analytics | +0.4% | Global | Medium term (2 to 4 years) |
Edge Vision Monetization
Edge vision monetization remains future white space because connected devices are increasingly ready, but distributed commercial computing capacity and developer tools remain underbuilt. According to the International Telecommunication Union, 5G covered 55% of the global population in 2025 and represented approximately 3 billion subscriptions, although coverage ranged from 84% in high-income economies to only 4% in low-income economies.
The European Commission targets at least 10,000 secure, climate-neutral edge nodes by 2030, while its competitiveness assessment counted only 3 commercially deployed EU nodes in 2024. The OECD identifies lower data-management requirements, reduced network load and shorter latency as central benefits of processing near the image source.
A scenario derived from the ITU connectivity base and OECD efficiency mechanism indicates that transferring 20–30% of routine enhancement calls to devices could cut cloud-compute events by a similar 20–30% and support a modeled 2–4-percentage-point gross-margin improvement. Capturing this upside requires compatible hardware, developer kits, and distribution partnerships.
Key Players Analysis
Based on product reach, customer access, and disclosed financial strength, analyst estimates place Tier-1 companies at around 68% of the AI-powered image processing tools market. Adobe is estimated at 20%, followed by Google at 15%, Microsoft at 13%, AWS at 12%, and NVIDIA at 8%. Adobe leads user-facing workflows through Photoshop, Lightroom and Firefly.
Google, Microsoft and AWS provide cloud infrastructure, inference services and application programming interfaces, while NVIDIA supplies the processors used for AI training and deployment. The remaining 32% is divided among smaller software companies and specialist providers.
Financial scale strengthens the position of these leading companies. Adobe generated USD 17.6 billion from Digital Media in FY2025 and spent USD 4.2 billion on research and development, equal to 18% of revenue. AWS sales reached USD 128.7 billion in 2025, while Amazon recorded USD 128.3 billion in cash capital expenditure and invested USD 2.7 billion in Anthropic notes.
Google Cloud generated approximately USD 58.7 billion, while Alphabet spent USD 61.09 billion on R&D and agreed to acquire Intersect for USD 4.7 billion. Microsoft reported USD 281.7 billion in revenue, Azure revenue above USD 75 billion, and R&D spending of USD 32.49 billion. NVIDIA recorded FY2026 revenue of USD 215.9 billion, including USD 194 billion from Data Center, which increased by 68%.
Tier-2 companies are estimated to hold 8%–12% collectively. SenseTime may represent 4%–6%, supported by 2025 revenue above RMB 5 billion, growth of 33%, and R&D spending of RMB 3.7 billion. Other private competitors are estimated at below 2% each.
Top Key Players in the Market
- Adobe
- Amazon Web Services, Inc.
- Microsoft
- NVIDIA Corporation
- Deep Art AI GmbH
- VanceAI Technology
- Need You, LLC
- SenseTime
- Straico
Recent Developments
- In 2025, NVIDIA and Intel announced a multi-generation technology partnership on September 18. NVIDIA also agreed to invest USD 5 billion in Intel common stock at USD 23.2 per share. Intel will develop custom x86 data-centre CPUs for NVIDIA’s AI infrastructure and produce x86 system-on-chips integrating NVIDIA RTX GPU chiplets.
- In 2025, AWS and OpenAI signed a USD 38 billion infrastructure agreement on November 3, covering continued growth over 7 years. AWS will provide hundreds of thousands of NVIDIA GB200 and GB300 GPUs through Amazon EC2 UltraServers, with capacity scalable to tens of millions of CPUs.
- In 2026, Microsoft commercially launched MAI-Image-2 through Microsoft Foundry on April 2. Pricing started at USD 5 per 1 million text-input tokens and USD 33 per 1 million image-output tokens. Production data showed at least 2 times faster image generation with similar quality. WPP became one of the first enterprise partners to use the model at scale for campaign-ready visual content.
Report Scope
| Report Features | Description |
|---|---|
| Market Value (2025) | USD 2.0 Billion |
| Forecast Revenue (2035) | USD 13.8 Billion |
| CAGR (2026-2035) | 21.0% |
| Base Year for Estimation | 2025 |
| Historic Period | 2020-2024 |
| Forecast Period | 2026-2035 |
| Report Coverage | Revenue Forecast, Market Dynamics, Competitive Landscape, Recent Developments |
| Segments Covered | By Deployment Mode (Cloud-Based, On-Premise); By End User (Healthcare, Automotive, Retail, Media and Entertainment, Manufacturing, Other) |
| Regional Analysis | North America – US, Canada; Europe – Germany, France, The UK, Spain, Italy, Rest of Europe; Asia Pacific – China, Japan, South Korea, India, Australia, Singapore, Rest of APAC; Latin America – Brazil, Mexico, Rest of Latin America; Middle East & Africa – GCC, South Africa, Rest of MEA |
| Competitive Landscape | Adobe, Amazon Web Services Inc., Google, Microsoft, NVIDIA Corporation, Deep Art AI GmbH, VanceAI Technology, Need You LLC, SenseTime, Straico |
| Customization Scope | Customization for segments, region/country-level will be provided. Moreover, additional customization can be done based on the requirements. |
| Purchase Options | We have three licenses to opt for: Single User License, Multi-User License (Up to 5 Users), Corporate Use License (Unlimited Users and Printable PDF) |





























