


Report Overview
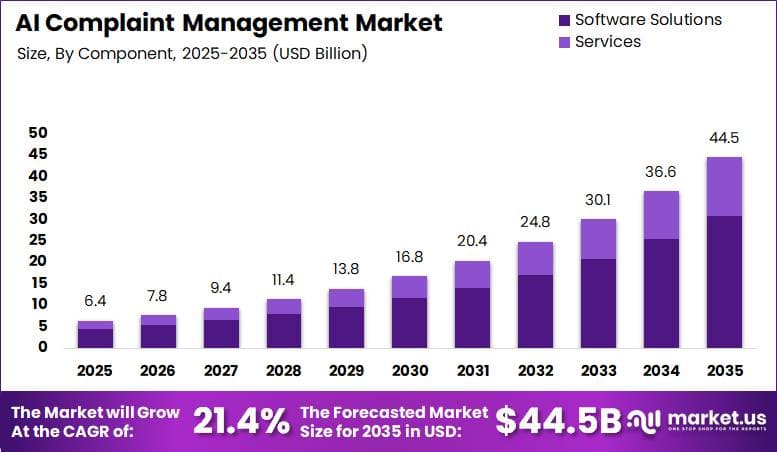
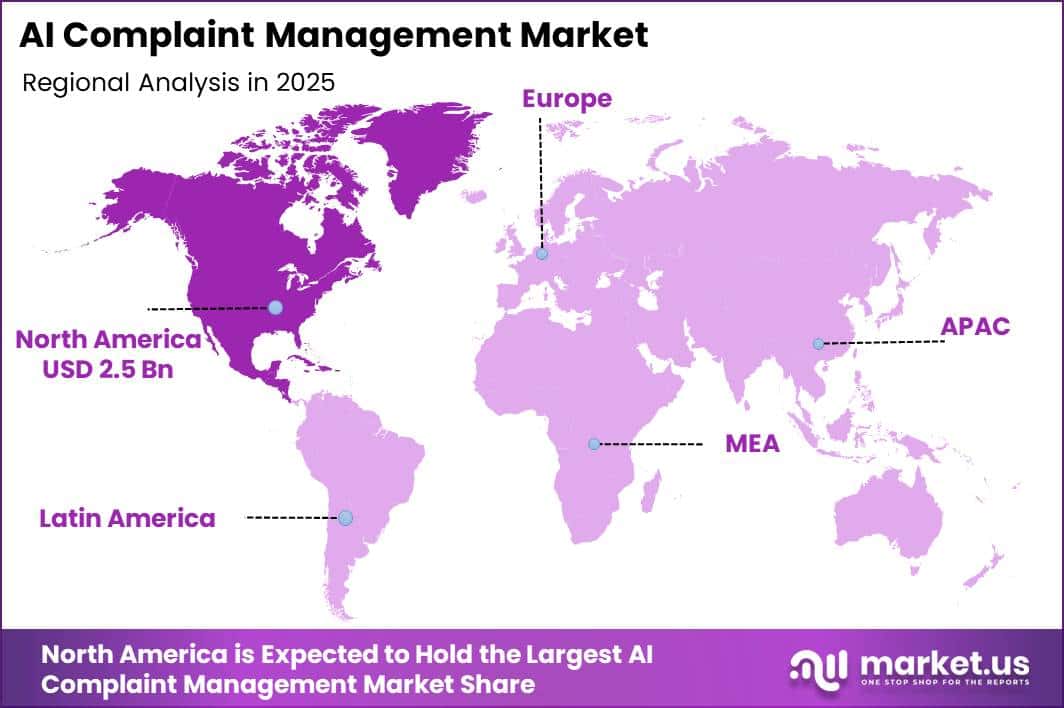
In 2025, the Global AI Complaint Management Market was valued at USD 6.4 billion. The market is projected to grow at a CAGR of 21.4% during 2026–2035, reaching approximately USD 44.5 billion by 2035. North America dominated the global market in 2025, accounting for more than 39.8% of the total market share and generating approximately USD 2.5 billion in revenue.
Growth is being supported by the wider use of artificial intelligence across businesses and the increasing number of customer complaints that companies must process. In the United States, business use of AI rose to nearly 20% by mid-2026. Adoption was higher in data-intensive sectors, reaching 33.9% in Finance and Insurance and 39.7% in Information services. These industries also handle large volumes of regulated customer complaints, creating strong demand for automated complaint management tools.
In 2024, the Consumer Financial Protection Bureau received about 3.1 million consumer complaints and forwarded nearly 2.8 million of them to around 3,600 companies for review and response. Managing this volume through manual teams can increase costs and delay resolution. AI-based systems help companies classify, route, prioritize, and resolve complaints more quickly.
North American region benefits from high AI readiness and a large base of complaint-heavy industries. U.S. business AI adoption reached about 18% by the end of 2025, while planned adoption for the following six months was close to 21%. Rising adoption among large companies with 250+ employees and smaller firms is expected to support continued market growth through 2035.
Key Takeaway
- The AI Complaint Management Market was valued at USD 6.4 billion in 2025 and is projected to reach USD 44.5 billion by 2035, growing at a 21.4% CAGR.
- Software Solutions dominated the component segment in 2025 with a 69.2% share.
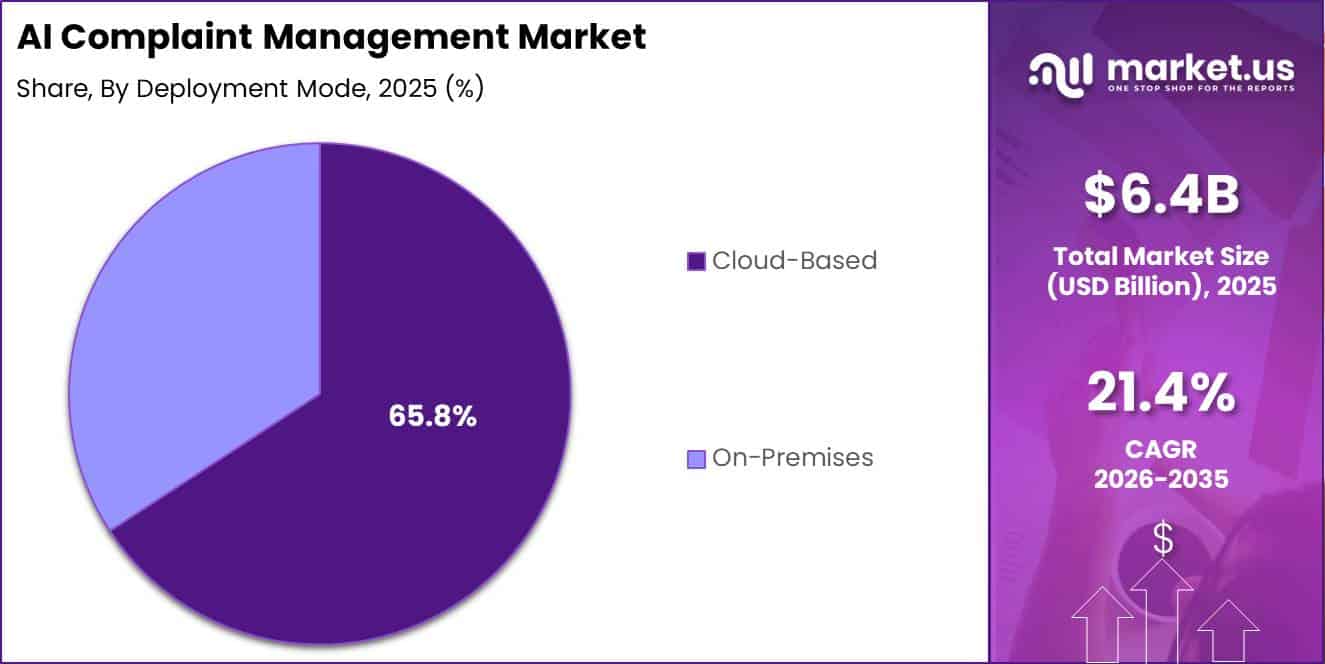
- Cloud-Based deployment led the market in 2025, accounting for 65.8% of the total share.
- Natural Language Processing was the leading technology segment in 2025 with a 38.6% share.
- Customer Service Complaints dominated the complaint type segment in 2025 with a 41.4% share.
- Complaint Resolution and Case Management led the application segment in 2025 with a 35.7% share.
- Large Enterprises dominated the organization size segment in 2025, capturing a 62.5% share.
- BFSI was the leading end-user industry in 2025, accounting for 28.9% of the market.
- Omnichannel Complaint Management led the communication channel segment in 2025 with a 44.3% share.
- North America led the market in 2025 with a 39.8% share, generating approximately USD 2.5 billion in revenue.
By Component
In 2025, Software Solutions held a dominant position in the AI Complaint Management Market, accounting for 69.2% of the total share. This leadership is supported by the central role of software in complaint automation. Functions such as complaint routing, sentiment analysis, issue classification, priority setting, and automated resolution depend on AI models and licensed software platforms.
Businesses generally invest in software first because it provides the main operating system required to process large complaint volumes. Supporting this trend, the U.S. Bureau of Labor Statistics reported that computer systems design and related services employed 2,444,800 workers in 2024. Employment in this field is projected to grow by 15.8% through 2034, reflecting continued investment in software-based digital infrastructure.
Services are expected to be the fastest-growing component segment. AI complaint management platforms require system integration, model configuration, maintenance, employee training, and consulting support after purchase. As adoption expands across finance, insurance, retail, and other customer-focused industries, businesses increasingly depend on technology specialists to connect complaint software with existing customer relationship management, contact centre, and workflow systems.
By Deployment Mode
In 2025, Cloud-Based deployment held a dominant position in the AI Complaint Management Market, accounting for 65.8% of the total share. Its leadership is mainly supported by lower infrastructure costs, faster implementation, and flexible computing capacity. Complaint volumes can rise suddenly, and cloud platforms allow businesses to increase processing power without purchasing additional physical servers or building new data centres.
Cloud adoption is also expanding across regulated industries. According to Eurostat, 52.7% of EU enterprises used paid cloud computing services in 2025, representing an increase of 7.4 percentage points compared with 2023. This level was also nearly three times higher than the 17.8% recorded in 2014, showing a clear shift from company-owned infrastructure toward rented cloud services. Finland reported the highest cloud adoption rate in the EU at 79.2% in 2025, reflecting strong demand in digitally advanced economies.
By Technology
In 2025, Natural Language Processing held a dominant position in the AI Complaint Management Market, accounting for 38.6% of the total share. Its leadership is supported by the unstructured nature of customer complaints, which are commonly submitted as emails, chat messages, forms, and written statements. NLP enables complaint management systems to read, classify, tag, and understand this free-form text before automated actions can begin.
Generative AI and Large Language Models are expected to be the fastest-growing technology segment. According to Stanford’s 2026 AI Index, organizational adoption of generative AI reached 88%, while population-level adoption increased to 53% within three years. This rate of adoption was faster than the early growth of personal computers and the internet.
In complaint management, large language models can perform more advanced tasks than traditional NLP tools. They can summarize lengthy complaints, prepare response drafts, identify possible solutions, and support customer service agents in real time. Stanford also reported productivity improvements of 14% to 26% in customer support activities using generative AI.
By Complaint Type
In 2025, Customer Service Complaints held a dominant position in the AI Complaint Management Market, accounting for 41.4% of the total share. This leadership is supported by the high number of complaints created through billing, customer support, service delivery, account management, and claim-related interactions.
The Federal Trade Commission’s Consumer Sentinel Network received 6.5 million consumer reports in 2024, representing a 20% increase from the previous year. Processing such a large volume through manual teams can lead to slower classification, delayed responses, and higher operating costs. AI complaint management platforms help businesses identify complaint topics, measure urgency, route cases to the correct department, and meet regulatory response timelines.
Product and Service Quality Complaints is expected to be the fastest-growing segment. The U.S. Consumer Product Safety Commission recorded 869 injuries connected with recalled products in 2024, the highest level reported in eight years. During the same year, more than 83 million hazardous product units were recalled through 305 recall actions. These figures highlight the growing need for companies to detect quality and safety concerns quickly.
By Application
In 2025, Complaint Resolution and Case Management held a dominant position in the AI Complaint Management Market, accounting for 35.7% of the total share. This leadership is supported by strict complaint-response timelines and the need for accurate case tracking. The Consumer Financial Protection Bureau requires companies to provide an initial response within 15 calendar days and a final response within 60 days.
With 98% of companies expected to meet these timelines, businesses increasingly rely on AI platforms to record complaints, assign cases, monitor progress, and alert teams before deadlines are missed. These systems also improve workflow consistency and reduce the risk of complaints being delayed or overlooked.
Sentiment Analysis and Voice of Customer Analytics is expected to be the fastest-growing application segment. The U.S. Bureau of Labor Statistics projects employment of customer service representatives to decline by 5% from 2024 to 2034. However, around 341,700 job openings are expected each year, mainly to replace workers who leave the occupation.
By Organization Size
In 2025, Large Enterprises held a dominant position in the AI Complaint Management Market, accounting for 62.5% of the total share. Their leadership is supported by higher AI adoption, larger technology budgets, and greater complaint volumes across multiple offices and business units. According to the U.S. Census Bureau’s Business Trends and Outlook Survey, 37% of companies with 250+ employees used AI in their operations, compared with only 8.8% of small businesses.
In major sectors such as Finance, Information, and Professional Services, AI adoption among very large companies reached around 50% to 60% on a headcount-weighted basis. These firms handle large numbers of customer cases, making automated complaint routing, monitoring, and resolution financially practical.
Small and Medium-sized Enterprises are expected to be the fastest-growing segment. AI use among small businesses increased from 6.3% to 8.8% within six months, showing that smaller firms are gradually reducing the adoption gap. The United States has around 34.8 million small businesses, representing 99.9% of all firms and employing nearly 59 million workers. Even a small increase in adoption across this large business base can create substantial demand for AI complaint management platforms.
By End User Industry
In 2025, the BFSI sector held a dominant position in the AI Complaint Management Market, accounting for 28.9% of the total share. Its leadership is supported by a large and highly regulated transaction network. According to the Federal Deposit Insurance Corporation, the United States had 3,928 insured commercial banks operating through 68,632 branches in 2024.
Retail and e-commerce are expected to be the fastest-growing end-user segment. U.S. e-commerce sales reached USD 302.3 billion in the first quarter of 2026, increasing by 9.7% compared with the previous year and representing 16.9% of total retail sales. Globally, UNCTAD reported that e-commerce sales across 43 economies reached USD 27 trillion in 2022, which was 25% higher than the level recorded before the pandemic in 2019. Rising online transactions generate more complaints related to delayed deliveries, damaged products, refunds, billing errors, and returns.
By Communication Channel
In 2025, Omnichannel Complaint Management held a dominant position in the AI Complaint Management Market, accounting for 44.3% of the total share. Its leadership is supported by the growing use of multiple communication channels during a single customer journey. According to the International Telecommunication Union, nearly 6 billion people, or 74% of the global population, used the internet in 2025, compared with 60% in 2020.
Social Media Complaint Management is expected to be the fastest-growing channel segment. Pew Research reported that 83% of U.S. adults used YouTube and 68% used Facebook. TikTok usage also increased from 21% of adults in 2021 to 33%, showing the rapid expansion of social media engagement. As more consumers post complaints publicly, businesses face a higher risk of negative comments spreading quickly and affecting brand reputation.
Key Market Segments
By Component
- Software Solutions
- Services
By Deployment Mode
- Cloud-Based
- On-Premises
By Technology
- Natural Language Processing (NLP)
- Generative AI & Large Language Models (LLMs)
- Machine Learning Analytics
- Robotic Process Automation (RPA)
By Complaint Type
- Customer Service Complaints
- Product & Service Quality Complaints
- Billing & Payment Complaints
- Regulatory & Compliance Complaints
By Application
- Complaint Resolution & Case Management
- Sentiment Analysis & Voice of Customer Analytics
- Automated Ticket Routing
- Root Cause Analysis
By Organization Size
- Large Enterprises
- Small & Medium Enterprises (SMEs)
By End User Industry
- BFSI
- Healthcare
- Retail & E-commerce
- Telecommunications
- Government & Public Sector
- Travel & Hospitality
By Communication Channel
- Omnichannel Complaint Management
- Email-Based Complaint Handling
- Social Media Complaint Management
- Chat & Messaging Platforms
Geopolitical Impact Analysis
Geopolitical tensions are becoming an important cost factor for the AI Complaint Management Market because these platforms depend on semiconductor-based cloud infrastructure. On January 15, 2026, the United States introduced a 25% Section 232 tariff on imported semiconductors and related components under HTSUS 9903.79.01.
This measure increases the cost of servers, processors, and AI chips used to operate complaint management software. Although certain imports for U.S. data centres and research and development activities receive partial exemptions, commercial software providers using standard imported components may face higher purchasing costs. These expenses can eventually increase cloud-hosting charges and enterprise software subscription prices.
Electricity costs are creating additional pressure. The International Energy Agency projects that global data-centre electricity consumption will rise from 415 TWh in 2024 to 945 TWh by 2030. U.S. data-centre electricity demand is also expected to increase by 130% from its 2024 level by 2030. As AI-compliant systems operate continuously through cloud servers, rising power consumption may raise operating costs for cloud providers and software vendors.
The U.S. Energy Information Administration further expects commercial electricity consumption to increase by 5% in 2026, mainly due to growing AI workloads. In parallel, the January 2026 Section 232 proclamation instructed the U.S. Department of Commerce and the U.S. Trade Representative to review and renegotiate critical-mineral import conditions linked to semiconductor production.
Regional Analysis
In 2025, North America held a dominant position in the AI Complaint Management Market, accounting for 39.8% of the global share and generating approximately USD 2.5 billion in revenue. The region benefits from advanced digital payment systems, strong cloud infrastructure, and a large number of regulated banks, insurers, and technology companies. These businesses manage high complaint volumes and increasingly use AI platforms to classify, route, track, and resolve customer issues efficiently.
Europe held a notable market position, supported by strict consumer protection requirements and the wider adoption of cloud services. In 2025, 52.7% of EU enterprises used paid cloud computing services, giving businesses the digital infrastructure needed to operate AI-based complaint management systems at scale. Strong regulatory oversight and growing digital adoption are expected to support steady regional demand.
Asia Pacific is expected to be the fastest-growing region through 2035. China’s online retail sales reached 15.5 trillion yuan, or approximately USD 2.1 trillion, in 2024, making it the world’s largest online retail market for the 12th consecutive year. India also recorded strong digital payment growth, with total transaction volume increasing by 34.8% in FY2024-25.
During the same period, UPI processed 185.8 billion transactions, representing a 41.7% year-on-year increase. Rising digital activity is creating more billing disputes, delivery complaints, and service-related issues, encouraging banks, fintech companies, and e-commerce platforms to adopt AI complaint management systems.
Key Regions and Countries
North America
- US
- Canada
Europe
- Germany
- France
- The UK
- Spain
- Italy
- Rest of Europe
Asia Pacific
- China
- Japan
- South Korea
- India
- Australia
- Rest of APAC
Latin America
- Brazil
- Mexico
- Rest of Latin America
Middle East & Africa
- GCC
- South Africa
- Rest of MEA
Market Dynamics
Drivers
| Driver | (~) % CAGR | Geographic Relevance | Impact Timeline |
|---|---|---|---|
| GenAI-first customer service strategies | +4.0% | North America, Europe, East Asia | Short term (≤ 2 years) |
| Explosion of digital complaint volumes | +3.2% | Global | Short term (≤ 2 years) |
| Integrated omni-channel case capture | +2.6% | Global | Medium term (2–4 years) |
| Cloud-native SaaS deployment models | +2.1% | Global, skew to SMEs | Short term (≤ 2 years) |
| Regulated-industry quality compliance | +1.7% | North America, Europe, APAC | Medium term (2–4 years) |
| Labor cost inflation in contact centers | +1.4% | US, UK, Western Europe | Short term (≤ 2 years) |
Large B2C enterprises have begun redesigning service operations around AI-native complaint intake and resolution after early deployments of AI for customer service showed growth in the low to mid 20s and material productivity gains between 2023 and 2025.
In many service organizations, generative AI agents now deflect or fully resolve about 20 to 40 percent of inbound complaints, cutting average handling times by up to 30 percent and allowing case throughput per full-time equivalent to rise from roughly 1.0 times to 1.3 times, which supports a sustained uplift of around 4.0 percentage points to the baseline CAGR for AI complaint management platforms.
By shifting business models from one-off software licensing to usage-based SaaS, for example, charging per resolved case or per 1,000 automated interactions, vendors are increasing recurring revenue share to well above 70 percent of bookings, stabilizing cash flows and justifying higher customer lifetime value to customer acquisition cost ratios in the range of 4 to 1 through 6 to 1.
This model change encourages enterprises to consolidate multiple legacy ticketing and point tools into a single AI-first complaint management layer, often resulting in contract expansions of about 20 to 50 percent over initial deployments and accelerating upsell cycles from renewal only to every 12 to 18 months.
Restraints
| Restraint | (~) % CAGR | Geographic Relevance | Impact Timeline |
|---|---|---|---|
| Data protection compliance risk | -3.0% | EU, UK, parts of APAC | Short term (≤ 2 years) |
| Conservative procurement in regulated sectors | -2.4% | Global, skew to BFSI and healthcare | Medium term (2–4 years) |
| Limited AI-ready data infrastructure | -2.1% | Emerging markets | Medium term (2–4 years) |
| Upfront integration and migration costs | -1.8% | Global | Short term (≤ 2 years) |
| Organizational resistance to AI-driven complaint handling | -1.5% | Global | Short term (≤ 2 years) |
| Unclear liability frameworks for automated decisions | -1.3% | EU, selected US states | Medium term (2–4 years) |
Regulatory regimes such as the EU GDPR, the UK data protection framework, and emerging AI guidance in parts of Asia require transparency, lawful basis, minimization, and rights management for AI-mediated customer interactions, which forces enterprises to slow or limit deployment of AI complaint tools until data protection impact assessments and governance controls are in place.
Mandatory steps such as completing impact assessments for high-risk processing, implementing role-based access to conversation logs, and offering human alternatives for complex complaints can extend deployment timelines by roughly 3 to 9 months and raise implementation costs by an estimated 15 to 25 percent versus non-regulated rollouts, depressing near-term market growth by around 3.0 percentage points relative to an unconstrained baseline.
Enterprises also incur ongoing compliance operating expenses equal to roughly 5 to 10 percent of their AI complaint management spend, covering legal review, periodic audits, and incident response preparedness, which lowers the immediate budget available for additional licenses or advanced modules. Strategically, this pushes some organizations to cap AI automation levels, for example at 20 to 30 percent of complaints fully automated, and to maintain parallel human-operated complaint flows in sensitive domains.
Challenges
| Challenge | (~) % CAGR | Geographic Relevance | Mitigation Horizon |
|---|---|---|---|
| High-quality labeled data scarcity | -2.7% | Global | Long term (≥ 4 years) |
| Complex omnichannel integration | -2.3% | Global | Medium term (2–4 years) |
| Domain-specific model performance gaps | -2.0% | Healthcare, BFSI, public sector | Long term (≥ 4 years) |
| Shortage of AI-literate CX talent | -1.9% | North America, Europe | Medium term (2–4 years) |
| Vendor lock-in and architecture rigidity | -1.6% | Global | Long term (≥ 4 years) |
| Measurement of AI complaint outcomes | -1.4% | Global | Medium term (2–4 years) |
Effective AI complaint handling depends on large volumes of accurately labeled historical interactions across channels, yet many enterprises have fragmented ticketing systems and unstructured email or chat logs where fewer than about 30 percent of records are consistently tagged with root cause, resolution type, and sentiment, which slows model training and iteration.
Building robust datasets often requires back-labeling hundreds of thousands to millions of complaints, at a cost that can reach the equivalent of several dollars per 100 interactions when combining human review and tool-assisted annotation, creating a drag of around 2.7 percentage points on the market maximum achievable growth because many organizations phase deployments by segment rather than full funnel.
This data bottleneck diminishes first contact resolution improvements that AI could otherwise deliver, for instance keeping uplift capped near 10 to 15 percent instead of a potential 20 to 25 percent, and lengthens the time to move from pilot to enterprise-wide rollout from perhaps 6 to 9 months to 12 to 18 months.
Over the long term, enterprises must re-architect complaint workflows, standardize taxonomies, and invest in data governance and labeling programs that can consume an incremental 5 to 8 percent of their annual customer experience technology budget, diverting spend that might otherwise accelerate adoption of more advanced AI complaint management capabilities.
Opportunities
| Opportunity | (~) % CAGR | Geographic Relevance | Execution Window |
|---|---|---|---|
| Outcome-based complaint resolution pricing | +3.3% | North America, Europe | Medium term (2–4 years) |
| Verticalized AI complaint suites for regulated sectors | +2.9% | Global | Long term (≥ 4 years) |
| Proactive churn prediction from complaint signals | +2.5% | Global | Medium term (2–4 years) |
| SME focused low integration AI complaint tools | +2.2% | Global, skewing toward emerging markets | Medium term (2–4 years) |
| AI-assisted regulatory and ESG reporting from complaints | +1.9% | EU, UK, North America | Long term (≥ 4 years) |
| Marketplace integrations with e-commerce and super apps | +1.7% | Global | Long term (≥ 4 years) |
Most AI complaint management deployments today are sold on per-seat or per-interaction SaaS models, leaving white space for outcome-based pricing structures where vendors charge per successfully resolved complaint, per percentage point reduction in repeat contacts, or per basis point improvement in satisfaction or net promoter score, which can redefine unit economics for buyers and suppliers.
If platforms can reliably prove that AI driven workflows reduce complaint related operating expense by about 10 to 20 percent per resolved case and cut escalations by 15 to 30 percent, they can justify revenue sharing models that capture roughly 20 to 40 percent of the savings while still delivering net margin expansion of several hundred basis points for enterprises, supporting an incremental CAGR upside of around 3.3 percentage points on top of the baseline.
Structurally, this shifts contracts from fixed subscription to performance-tied agreements where annual contract values scale with realized resolution volumes, for example, linking pricing bands to each additional block of 10,000 complaints resolved by AI, expanding the accessible revenue pool without requiring proportional increases in headcount.
For vendors, higher gross margin software, often above 70 percent contribution, combined with variable outcome-linked pricing can raise blended gross margins by an estimated 5 to 10 percentage points while also locking in multi-year relationships based on jointly agreed performance indicators, deepening penetration in large accounts and creating a more attractive growth trajectory than flat fee SaaS alone.
Key Players Analysis
The AI Complaint Management Market has a two-tier competitive structure. Tier-1 companies include Salesforce, ServiceNow, Microsoft, Oracle, SAP, and IBM. These firms use their existing CRM, workflow, cloud, and enterprise software platforms to add AI-based complaint management capabilities. Their large research and development budgets, global customer bases, and strong integration networks provide a major competitive advantage.
Salesforce generated USD 37.9 billion in revenue during FY2025, representing 9% year-on-year growth. Subscription and support revenue contributed USD 35.7 billion, while the company invested USD 5.4 billion in research and development to strengthen products such as its Agentforce AI-agent platform.
ServiceNow reported total FY2025 revenue of USD 13.3 billion, increasing by 21%. Subscription revenue reached USD 12.9 billion, while remaining performance obligations rose by 26.5% to USD 28.2 billion, indicating strong future demand for its AI-enabled workflow platform and AI Control Tower strategy.
Tier-2 competitors include NICE, Verint, Zendesk, Genesys, Pegasystems, Qualtrics, Medallia, Freshworks, and Zoho. These companies compete through specialized customer experience and complaint automation tools. NICE recorded USD 732 million in revenue during Q3 2025, up 6%. Cloud revenue increased by 13% to USD 563 million, representing 77% of total revenue. Cloud annual recurring revenue also rose by 49% following the acquisition of Cogniti, which added around 50 basis points to cloud revenue after completion.
Top Key Players in the Market
- Salesforce
- ServiceNow
- Zendesk
- Microsoft
- Oracle
- SAP
- Freshworks
- Genesys
- NICE
- Verint
- Pegasystems
- Qualtrics
- Medallia
- Zoho
- IBM
Recent Developments
- In 2025, NICE completed its acquisition of Cognigy on September 8 for approximately USD 955 million. The deal combined NICE’s CXone platform with Cognigy’s conversational and agentic AI technology, strengthening automated complaint intake, multilingual customer support, case routing, and resolution across digital and voice channels. Cognigy’s platform supports more than 100 languages and serves over 1,000 brands worldwide.
- In 2025, ServiceNow completed its USD 2.8 billion acquisition of Moveworks on December 15. The combination brought together agentic AI, enterprise search, and intelligent workflow automation. These capabilities can help businesses understand customer requests, open cases, find relevant information, and automate complaint resolution. ServiceNow reported that its AI agents already resolved 90% of IT requests and 89% of customer-support requests, reducing resolution time by nearly sevenfold.
Report Scope
| Report Features | Description |
|---|---|
| Market Value (2025) | USD 6.4 Billion |
| Forecast Revenue (2035) | USD 44.5 Billion |
| CAGR (2026-2035) | 21.4% |
| Base Year for Estimation | 2025 |
| Historic Period | 2020-2024 |
| Forecast Period | 2026-2035 |
| Report Coverage | Revenue Forecast, Market Dynamics, Competitive Landscape, Recent Developments |
| Segments Covered | By Component (Software Solutions, Services); By Deployment Mode (Cloud-Based, On-Premises); By Technology (Natural Language Processing (NLP), Generative AI & Large Language Models (LLMs), Machine Learning Analytics, Robotic Process Automation (RPA)); By Complaint Type (Customer Service Complaints, Product & Service Quality Complaints, Billing & Payment Complaints, Regulatory & Compliance Complaints); By Application (Complaint Resolution & Case Management, Sentiment Analysis & Voice of Customer Analytics, Automated Ticket Routing, Root Cause Analysis); By Organization Size (Large Enterprises, Small & Medium Enterprises (SMEs)); By End User Industry (BFSI, Healthcare, Retail & E-commerce, Telecommunications, Government & Public Sector, Travel & Hospitality); By Communication Channel (Omnichannel Complaint Management, Email-Based Complaint Handling, Social Media Complaint Management, Chat & Messaging Platforms) |
| Regional Analysis | North America – US, Canada; Europe – Germany, France, The UK, Spain, Italy, Rest of Europe; Asia Pacific – China, Japan, South Korea, India, Australia, Singapore, Rest of APAC; Latin America – Brazil, Mexico, Rest of Latin America; Middle East & Africa – GCC, South Africa, Rest of MEA |
| Competitive Landscape | Salesforce, ServiceNow, Zendesk, Microsoft, Oracle, SAP, Freshworks, Genesys, NICE, Verint, Pegasystems, Qualtrics, Medallia, Zoho, IBM |
| Customization Scope | Customization for segments and region/country-level will be provided. Moreover, additional customization can be done based on the requirements. |
| Purchase Options | We have three licenses to opt for: Single User License, Multi-User License (Up to 5 Users), Corporate Use License (Unlimited Users and Printable PDF) |





























