


Market Overview
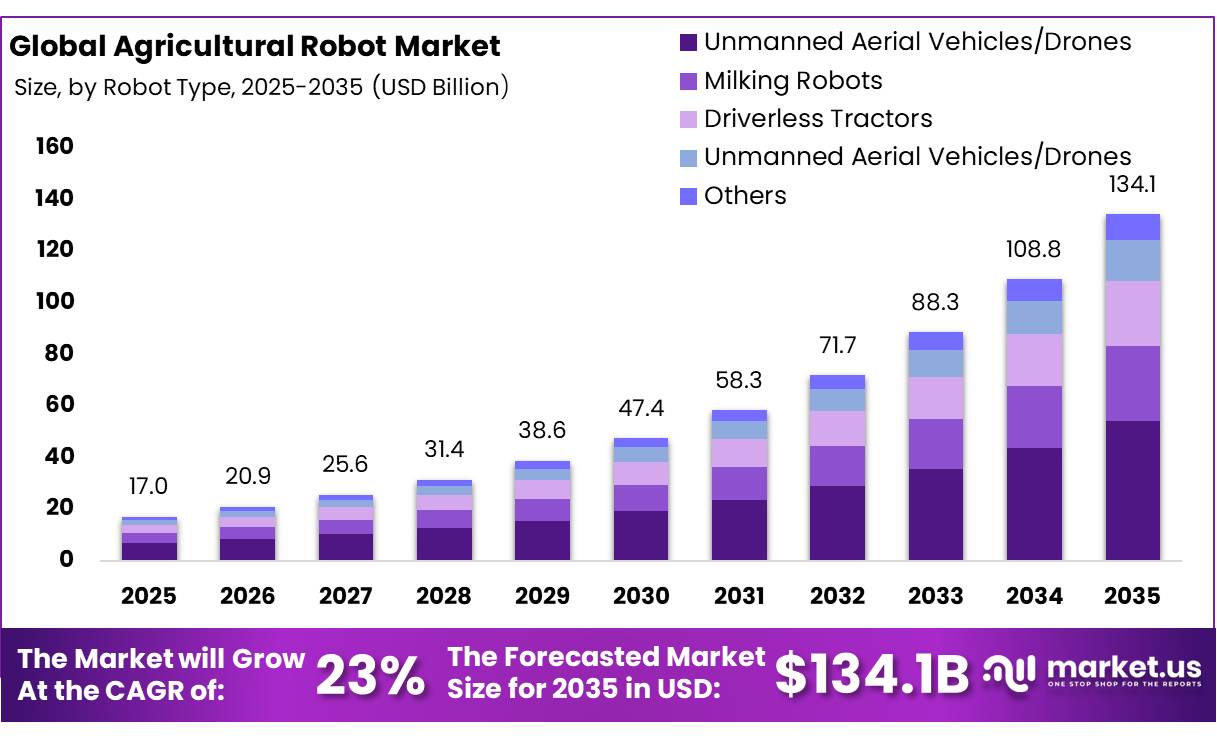
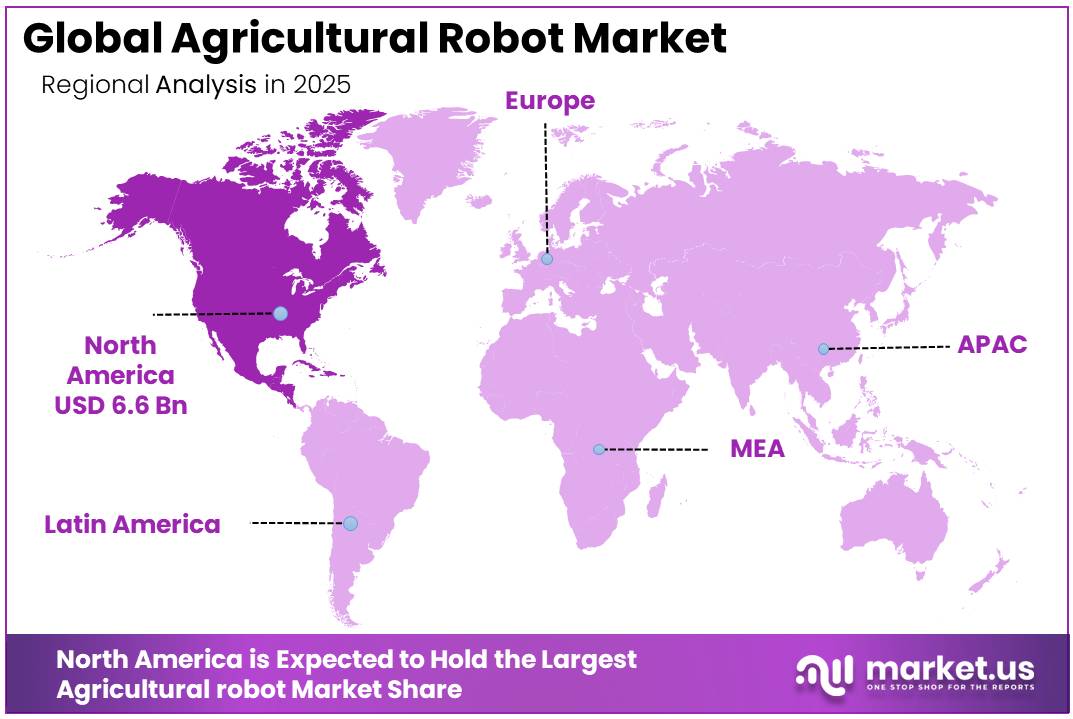
The global Agricultural Robot market size is expected to be worth around USD 134.1 billion by 2035, from USD 17.0 billion in 2025, growing at a CAGR of 23.0% during 2026 to 2035. North America dominated the global market in 2025, accounting for more than 38.9% of the total share and generating approximately USD 6.6 billion in revenue.
The agricultural robot industry is moving from pilot projects toward commercial field deployment as growers seek more reliable, precise and continuously available machinery. These systems combine autonomous navigation, machine vision, artificial intelligence, sensors and robotic implements to perform planting, spraying, weeding, harvesting, crop monitoring and livestock management.
- In October 2025, the International Federation of Robotics reported that nearly 19,500 agricultural robots were sold worldwide in 2024. Although unit sales declined by 6%, agriculture remained the fourth-largest professional service-robot application, showing that adoption is established but still sensitive to farm income, equipment costs and technology readiness.
Key Takeaways
- Agricultural Robot market size is expected to be worth around USD 134.1 billion by 2035, from USD 17.0 billion in 2025, growing at a CAGR of 23.0%.
- Unmanned Aerial Vehicles/Drones held a dominant market position, capturing more than a 40.30% share.
- Milking held a dominant market position, capturing more than a 31.70% share.
- Outdoor held a dominant market position, capturing more than a 68.90% share.
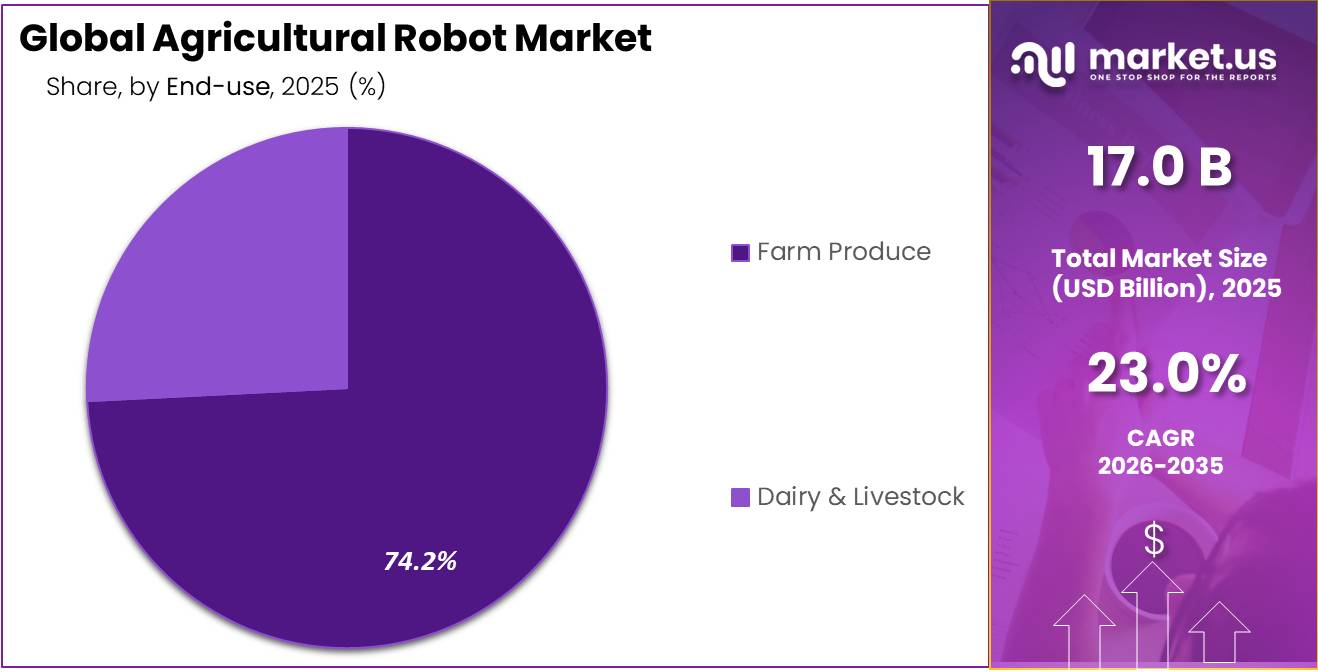
- Farm Produce held a dominant market position, capturing more than a 74.20% share.
- North America held a dominant position in the agricultural robot market, capturing a 38.9% share and generating USD 6.613 billion in revenue.
In November 2025, the U.S. Department of Agriculture Economic Research Service reported that average 2024 hourly wages reached USD 18.24 for crop, nursery and greenhouse workers and USD 19.07 for agricultural equipment operators. U.S. wage and salaried agricultural employment also increased from 1.07 million jobs in 2010 to 1.18 million in 2024, according to USDA ERS. These conditions encourage producers to automate repetitive, seasonal and physically demanding work. The World Bank expects global food demand to rise by 30% by 2050, strengthening the need for higher output from limited land, labor and water resources.
Government-backed testing and innovation infrastructure is also reducing commercialization risk. In January 2025, the European Commission stated that agrifoodTEF had created a catalogue containing more than 200 AI services, with over 50 services already being delivered to innovators. The programme aims to support more than 5,000 innovators, with at least 75% being small and medium-sized enterprises. In June 2025, USDA NIFA confirmed that autonomous robots were being developed for labor-intensive harvesting, alongside AI-enabled crop, soil and livestock monitoring.
Future growth opportunities will emerge from robot-as-a-service models, autonomous fleets, precision input application, controlled-environment farming and multi-task platforms. The International Federation of Robotics reported that the professional service-robot rental fleet expanded by 31% in 2024, demonstrating how subscriptions can reduce upfront capital requirements. Wider adoption will nevertheless depend on reliable operation in changing weather, clear safety standards, cybersecurity protection, repair networks and measurable returns for farms of different sizes.
In February 2025, AGCO and SDF signed a supply agreement under which SDF would manufacture proprietary tractors of up to 85 horsepower for Massey Ferguson beginning in mid-2025. In August 2025, AGCO reported that Allegiance Ag & Turf and True Ag & Turf had merged, while two Canadian dealers combined into an eight-location operation. In the official sources reviewed, Agrobot did not publish a verifiable 2025 partnership, merger or acquisition announcement.
By Robot Type
Unmanned Aerial Vehicles/Drones lead with 40.30% as farms adopt faster aerial monitoring
In 2025, Unmanned Aerial Vehicles/Drones held a dominant market position, capturing more than a 40.30% share. Their leadership was supported by growing use in crop scouting, field mapping, pest detection, spraying and plant-health assessment. Drones equipped with multispectral cameras allow growers to inspect large fields faster and identify stressed areas before damage spreads.
- The United States Department of Agriculture stated that aerial application accounted for almost 20% of crop production and protection products applied on commercial farms in the United States. The agency also developed unmanned aerial vehicle methods for assessing spray deposition, detecting cotton root rot and guiding site-specific input application.
The Federal Aviation Administration forecast approximately 1.03 million registered commercial small drones in 2025, increasing to 1.089 million in 2026, indicating stronger supporting infrastructure for professional drone operations.
By Farming Environment Analysis
Milking leads with 31.70% as dairy farms automate repetitive herd routines
In 2025, Milking held a dominant market position, capturing more than a 31.70% share. The segment’s leadership was supported by the highly repetitive and time-sensitive nature of dairy operations, where cows must be milked consistently every day.
- In September 2025, a U.S. university study reported that one automated milking system could serve between 60 and 70 cows per day, while allowing individual cows to be milked two to four times daily. These robots use transponders to identify each animal and cameras or lasers to position the milking equipment correctly.
Integrated sensors also record milk yield, milk quality, milking frequency and animal health information, helping dairy operators identify problems earlier and manage each cow more accurately. A 2025 report from the United States Department of Agriculture Economic Research Service further indicated that precision dairy technologies can support higher milk production with fewer cows while reducing waste during the milking process.
Application Analysis
Outdoor farming leads with 68.90% as robots handle wider field operations
In 2025, Outdoor held a dominant market position, capturing more than a 68.90% share. The segment benefited from the growing use of autonomous tractors, drones, robotic weeders, harvesters and smart spraying equipment across open fields, orchards and large crop farms. These systems help farmers monitor crops, remove weeds, apply inputs and complete repetitive fieldwork with less manual effort. In June 2025, the United States Department of Agriculture stated that autonomous robots were being developed to harvest crops in greater volumes and at higher speeds than traditional workers.
- In June 2025, United States corn planting covered 95.2 million acres, an increase of 4.61 million acres from the previous year, showing the large outdoor area where automation can support field operations. From August 2025, a USDA research project also began evaluating robots, drones, sensors and autonomous technologies under real agricultural conditions, supporting further development of reliable outdoor farming systems.
By End Use Analysis
Farm Produce leads with 74.20% as robots improve harvesting speed and crop handling
In 2025, Farm Produce held a dominant market position, capturing more than a 74.20% share. The segment’s leadership was supported by the increasing use of robots for fruit picking, vegetable harvesting, precision spraying, weeding, sorting and crop-quality inspection. Produce farming involves delicate crops, short harvesting windows and repetitive manual work, making automation valuable for maintaining product quality and reducing field losses.
In February 2026, the United States Department of Agriculture reported that vegetable and melon production covered 28 major crops during 2025, with sweet corn and tomatoes recording the largest harvested areas. (USDA) In May 2026, the agency reported that utilized production across 21 noncitrus fruit crops reached 15.8 million tons in 2025. (USDA) The USDA also highlighted a dual-arm fruit-harvesting robot that improved harvesting efficiency by up to 34%, showing how robotic systems can help growers save time, manage labor pressure and handle high-value produce more consistently.
Кеу Маrkеt Ѕеgmеntѕ
By Robot Type
- Automated Harvesting Robots
- Milking Robots
- Driverless Tractors
- Unmanned Aerial Vehicles/Drones
- Others
By Application
- Planting & Seeding Management
- Spraying Management
- Milking
- Monitoring & Surveillance
- Harvest Management
- Livestock Monitoring
- Others
By Farming Environment
- Indoor
- Outdoor
By End Use
- Farm Produce
- Dairy & Livestock
Driver Analysis
Farm labor scarcity and wage escalation driving automation
Acute shortages of seasonal and skilled farm labor, combined with rising wages, are a primary near-term driver, with industry commentary highlighting labor shortages and sustainable productivity demands as core catalysts for agricultural automation and equipment robotics expansion at roughly 9 percent or higher from 2026 to 2033 in certain equipment segments. In the US and EU, anecdotal and survey data show growers facing double-digit percentage increases in hourly wages for harvesting and field operations over the past 5–7 years, while Japan and parts of Western Europe already have median farmer ages above 55, amplifying dependence on migrant and contract workers whose availability is increasingly volatile.
On high-value specialty crops like fruits and vegetables, labor can account for 30–50 percent of operating cost per hectare, so automating repetitive tasks such as weeding, spot spraying, and harvesting can shift unit economics by 10–20 percent at the field level when amortized over multi-year robot lifecycles; this makes capital-intensive robots economically rational despite mid-five- to low-six-figure price tags per unit.
The result is an incremental +2.6 percentage-point uplift on top of baseline CAGR in markets where labor risk is most acute—North America, EU, Japan, GCC horticulture, and mechanizing parts of China—because farms that might otherwise delay automation investments are being forced forward by wage inflation and labor reliability concerns.
Drivers Impact Analysis
| Driver | (~) % Impact on CAGR Forecast | Geographic Relevance | Impact Timeline |
|---|---|---|---|
| Farm labor scarcity and wage escalation driving automation | +2.6% | North America core, EU, Japan, GCC, China | Short term (≤ 2 years) |
| AI, computer vision and IoT-enabled precision farming integration | +2.3% | North America, EU, APAC corridors, South America spill-over | Medium term (2-4 years) |
| Sustainability, input-cost pressure and regulatory push for precision | +1.9% | EU, North America, developed APAC, Brazil | Medium term (2-4 years) |
| CAPEX financing, leasing models and OEM–farmer platformization | +1.7% | North America, EU, developed APAC | Medium term (2-4 years) |
| Aging farmer demographics and farm-consolidation dynamics | +1.5% | Japan, EU, North America, China | Long term (≥ 4 years) |
| Government digital-agriculture programs and rural connectivity | +1.4% | India, China, ASEAN, LatAm | Long term (≥ 4 years) |
Restraint Analysis
Limited rural connectivity and digital infrastructure
Even as some countries report national 4G coverage above 80 percent of the population, coverage at field level—across large, sparsely populated agricultural zones can be patchy, with dead zones, limited uplink capacity, and inconsistent latency, forcing robots to operate in degraded modes without real-time supervision or data logging; in parts of India, Africa, and Latin America, basic connectivity can still drop to below 50 percent of rural households, and many farms lack any form of high-bandwidth link suitable for continuous robot telemetry.
This infrastructure gap acts as a structural restraint, especially in APAC emerging markets, India, Africa, and parts of Latin America, where latent demand is high but digital foundations are incomplete; even as satellite and rural broadband initiatives ramp up, the near- to medium-term effect is a roughly 2.1 percentage-point drag on the global CAGR because whole geographies adopt robotics later and more unevenly than technology readiness alone would suggest.
Restraint Impact Analysis
| Restraint | (~) % Impact on CAGR Forecast | Geographic Relevance | Impact Timeline |
|---|---|---|---|
| High upfront cost and ownership risk | -2.7% | North America, EU, APAC corridors | Short term (≤ 2 years) |
| Limited rural connectivity and digital infrastructure | -2.1% | APAC emerging, India, Africa, LatAm | Medium term (2-4 years) |
| Fragmented farms and smallholder economics | -1.9% | India, ASEAN, Africa, LatAm | Long term (≥ 4 years) |
| Regulatory ambiguity and field-deployment restrictions | -1.6% | EU regulatory hubs, North America, Japan | Medium term (2-4 years) |
| Supply chain and component dependence (sensors, semiconductors) | -1.5% | Global, APAC manufacturing hubs | Short term (≤ 2 years) |
| Skills, service, and after-sales capacity gaps | -1.3% | Global, stronger in emerging markets | Long term (≥ 4 years) |
Opportunity Analysis
Robots-as-a-service (RaaS) and outcome-based contracts
This opportunity is a strategic pivot from selling robots as capital equipment to positioning them as service and outcome platforms, with recurring revenue based on hectares treated, tons harvested, or hours operated, and is not yet fully baked into baseline forecasts that primarily model unit shipments and ASPs.
If, by 2030–2035, even 20–30 percent of robot capacity in developed markets is deployed under RaaS, providers could capture significantly higher lifetime value per machine—potentially 1.5–2 times hardware list price over 5–7 years—while farmers benefit from lower upfront cost and more flexible capacity, expanding the accessible TAM by including farms that would never buy robots outright. The unit economics can be compelling: a single weeding robot operating 2,000–3,000 hours per year across multiple clients could generate six-figure annual service revenue at gross margins improved by 5–10 percentage points through software updates, remote diagnostics, and route optimization, while also smoothing OEM revenue streams.
Strategically, this opportunity requires building fleet-management, scheduling, billing, and risk-management capabilities, plus partnerships with financiers and insurers; if executed in North America, Europe, and developed APAC over the next 2–4 years, RaaS and outcome contracts could add around 2.4 percentage points of CAGR upside on top of baseline hardware-driven growth by unlocking demand from farms constrained by capex and by creating vertically integrated service champions.
Opportunity Impact Analysis
| Opportunity | (~) % Potential CAGR Upside | Geographic Relevance | Execution Window |
|---|---|---|---|
| Robots-as-a-service (RaaS) and outcome-based contracts | +2.4% | North America, EU, developed APAC | Medium term (2-4 years) |
| Multi-farm cooperatives and contractor robot fleets | +2.1% | India, ASEAN, LatAm, Eastern Europe | Medium term (2-4 years) |
| Post-harvest, cold-chain and logistics robotics adjacencies | +1.9% | North America, EU, export-focused APAC | Long term (≥ 4 years) |
| Integrated “farm OS” platforms and data monetization | +1.8% | North America core, EU, China | Long term (≥ 4 years) |
| Emerging market smallholder bundles (micro-robots + microfinance) | +1.6% | India, Africa, ASEAN, LatAm | Medium term (2-4 years) |
| Cross-sector technology spillover (construction, landscaping, municipal) | +1.3% | North America, EU, urban APAC | Long term (≥ 4 years) |
Challenges Analysis
Complex, high-touch adoption journey
Surveys of precision-ag retailers and adopters show that adoption tends to proceed in stages , and each stage can take 2–5 years to normalize across a region, implying that full robot integration may be a decade-long journey for many farms. This high-touch path constrains vendor scalability: each deployment may require multiple site visits, detailed onboarding, and in-season troubleshooting, limiting how many new customers a given field team can onboard per year and driving up customer acquisition cost to levels far higher than for conventional machinery.
Strategically, firms must invest in playbooks, remote-support tools, and channel partners to compress this journey, but until that scaling infrastructure is mature, the complex adoption path acts as a roughly 1.6 percentage point drag on maximum CAGR, particularly in developed markets where expectations for reliability and integration are high and where early negative experiences can slow diffusion among peers.
Challenges Impact Analysis
| Challenge | (~) % CAGR Friction Drag | Geographic Relevance | Mitigation Horizon |
|---|---|---|---|
| Complex, high-touch adoption journey | -1.6% | North America core, EU, developed APAC | Medium term (2-4 years) |
| Data integration, governance and trust gaps | -1.4% | North America, EU regulatory hubs, APAC corridors | Long term (≥ 4 years) |
| Talent and support-capacity bottlenecks | -1.3% | Global, stronger in APAC and emerging markets | Long term (≥ 4 years) |
| Supply-chain variability in components and uptime | -1.2% | APAC logistics corridors, global OEMs | Medium term (2-4 years) |
| Farmer heterogeneity and tech-cluster polarization | -1.1% | North America, EU, India, LatAm | Long term (≥ 4 years) |
| Macro and climate-risk volatility on farm P&L | -1.0% | Global, export- and climate-exposed corridors | Short term (≤ 2 years) |
Regional Analysis
North America Leads Agricultural Robot Adoption with 38.9% Share
In 2025, North America held a dominant position in the agricultural robot market, capturing a 38.9% share and generating USD 6.613 billion in revenue. The region’s leadership was supported by farms, machinery manufacturers, digital infrastructure and adoption of autonomous tractors, drones, robotic milkers and precision spraying systems. Robots are used to manage labor-intensive work, improve field accuracy and collect crop and livestock data.
- In May 2025, the United States Department of Agriculture reported 637,000 hired farm workers during the April reference week, while the average gross wage reached USD 19.52 per hour, rising 3% from the previous year. These labor costs are encouraging farms to consider automation for harvesting, weeding, monitoring and material handling.
The region also benefits from a mature agricultural research network and public support for advanced technology. In June 2025, the USDA National Institute of Food and Agriculture stated that autonomous robots were being developed to harvest crops in greater volumes and faster than traditional labor, while drones and remote sensing were supporting crop and soil monitoring.
Key Regions and Countries
- North America
- US
- Canada
- Mexico
- Europe
- Germany
- UK
- France
- Italy
- Russia
- Spain
- Rest of Europe
- Asia Pacific
- China
- Japan
- South Korea
- India
- Rest of Asia-Pacific
- South America
- Brazil
- Argentina
- Rest of South America
- Middle East & Africa
- GCC
- South Africa
- Israel
- Rest of MEA
Key Players Analysis
AGCO Corporation remains one of the largest agricultural equipment and precision farming suppliers in the competitive landscape. In 2025, the company generated approximately USD 10.1 billion in net sales, employed around 22,000 people worldwide, and produced record free cash flow of USD 740 million. Its portfolio combines Fendt, Massey Ferguson, Valtra and PTx technologies, giving it broad access to machinery, autonomy and retrofit channels. AGCO’s scale supports continued investment in smart equipment, dealer services and connected farm operations globally.
Autonomous Solutions, Inc. provides vehicle automation software and hardware for agriculture and other off-road industries. By 2025, the company had accumulated 25 years of autonomy experience and had automated more than 100 vehicle models. Its Mobius fleet platform allows one operator to manage multiple machines and supports brand-agnostic deployment across existing equipment. At FIRA USA 2025, ASI demonstrated non-stop 24-hour autonomous farming, showing its ability to address labor shortages, increase machine utilization and support larger commercial fleet deployments across farms.
Bonsai Robotics develops vision-based autonomy for orchards, vineyards, greenhouses and other difficult farming environments. The company reports that its platform has captured data from more than 1 million acres, reduced operating expenses by 45%, and completed jobs 60% faster. These figures strengthen its position in physical artificial intelligence for agriculture, where reliable navigation is required beyond GPS-dependent systems. Bonsai’s connected platform is designed to manage entire equipment fleets, helping growers automate repetitive work while improving operating consistency and equipment productivity.
BouMatic holds a strong position in dairy automation through robotic milking, herd monitoring and barn-management systems. In 2025, a Northern Ireland farm installed a Gemini UP double-box robot for 121 milking cows within a 180-animal herd, recording average daily yield of 32 litres per cow. The company also integrated MilkGenius analysis into its robotic platform during 2025. These systems improve real-time milk monitoring, animal identification and workflow control, strengthening BouMatic’s role in technology-led dairy farm modernization globally across international markets.
Маrkеt Kеу Рlауеrѕ
- AGCO Corporation
- Agrobot
- Autonomous Solutions, Inc.
- Bonsai Robotics
- BouMatic
- Carbon Robotics
- CLAAS KGaA mbH
- CNH Industrial N.V.
- DeLaval
- DJI Technology
- ecoRobotix
- FarmWise
- GEA Group Aktiengesellschaft
- Harvest Automation, Inc
- John Deere
- Other Key Players
Recent Developments
- In February 2026, AGCO reported 2025 net sales of USD 10.1 billion and record free cash flow of USD 740 million, providing financial support for continued investment in robotics, artificial intelligence and autonomous farm machinery.
- In January 2025, Bonsai Robotics raised USD 15 million in Series A funding to improve its vision-based AI technology and expand commercial operations. At that time, Bonsai had partnered with several equipment manufacturers, deployed more than 40 autonomous units across the United States and Australia, and collected operating data from over 500,000 acres.
- In February 2026, Carbon Robotics partnered with Bonsai Robotics to integrate its laser-weeding technology with the Amiga Max autonomous platform. During the same month, it launched a Large Plant Model trained on 150 million labelled plants, allowing robotic equipment to adapt to crop conditions within minutes.
Report Scope
| Report Features | Description |
|---|---|
| Market Value (2025) | USD 17.0 Billion |
| Forecast Revenue (2035) | USD 134.1 Billion |
| CAGR (2026-2035) | 23.0% |
| Base Year for Estimation | 2025 |
| Historic Period | 2020-2024 |
| Forecast Period | 2026-2035 |
| Report Coverage | Revenue Forecast, Market Dynamics, Competitive Landscape, Recent Developments |
| Segments Covered | By Robot Type (Automated Harvesting Robots, Milking Robots, Driverless Tractors, Unmanned Aerial Vehicles/Drones, Others), By Application (Planting & Seeding Management, Spraying Management, Milking, Monitoring & Surveillance, Harvest Management, Livestock Monitoring, Others), By Farming Environment (Indoor, Outdoor), By End Use (Farm Produce, Dairy & Livestock) |
| Regional Analysis | North America-US, Canada, Mexico; Europe-Germany, UK, France, Italy, Russia, Spain, Rest of Europe; APAC-China, Japan, South Korea, India, Rest of Asia-Pacific; South America-Brazil, Argentina, Rest of South America; MEA-GCC, South Africa, Israel, Rest of MEA |
| Competitive Landscape | AGCO Corporation, Agrobot, Autonomous Solutions, Inc., Bonsai Robotics, BouMatic, Carbon Robotics, CLAAS KGaA mbH, CNH Industrial N.V., DeLaval, DJI Technology, ecoRobotix, FarmWise, GEA Group Aktiengesellschaft, Harvest Automation, Inc, John Deere, Other Key Players |
| Customization Scope | Customization for segments, region/country-level will be provided. Moreover, additional customization can be done based on the requirements. |
| Purchase Options | We have three licenses to opt for: Single User License, Multi-User License (Up to 5 Users), Corporate Use License (Unlimited User and Printable PDF) |





































