


Report Overview
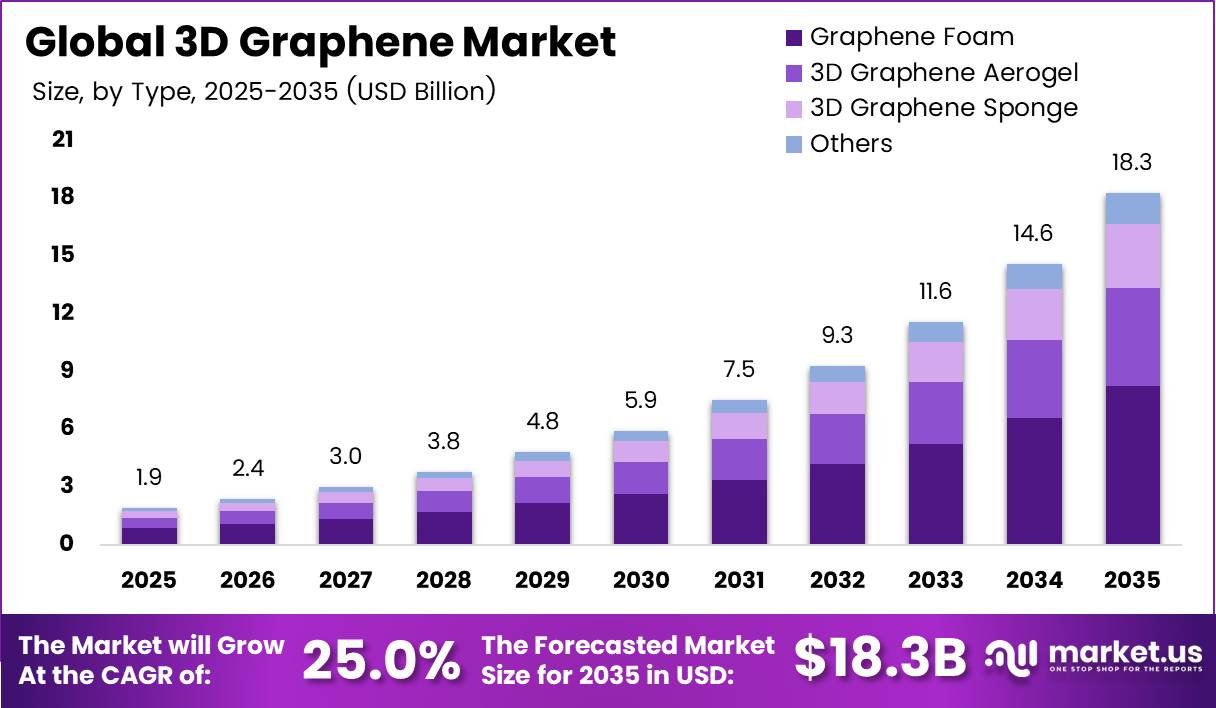
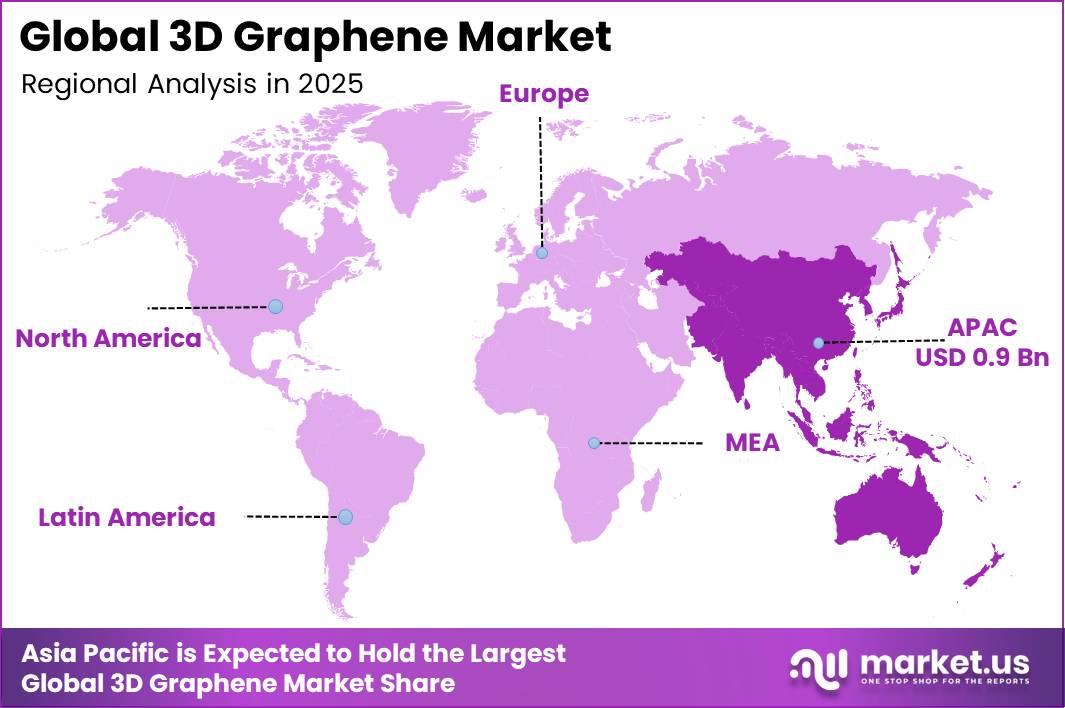
In 2025, the Global 3D Graphene Market was valued at USD 1.9 billion. The market is projected to grow at a CAGR of 25.0% during 2026–2035, reaching approximately USD 18.3 billion by 2035. Asia Pacific dominated the global market in 2025, accounting for more than 46.2% of the total market share and generating approximately USD 0.9 billion in revenue.
Battery and chip build-outs drive this demand. The IEA reported that the world added 108 GW of new battery storage in 2025, about 40% more than in 2024, with utility-scale systems making up roughly 87 GW of that total, and installed capacity now sits eleven times higher than in 2021.
Three-dimensional foams and aerogels give cell makers high surface area and short electron paths, so every added gigawatt lifts orders for porous graphene. The Semiconductor Industry Association reported global chip sales of USD 791.7 billion in 2025, up 25.6% from USD 630.5 billion in 2024, which raises demand for graphene heat spreaders and interposer layers.
China’s industrial scale explains that lead. The IEA reported that China added just over 63 GW of battery capacity in 2025, roughly one third more than 2024, while electric cars made up nearly 55% of all new car sales in the country. Chinese carmakers supplied 60% of global electric car sales in 2025, and more than 35% of China’s car exports were EVs, up from 20% a year earlier.
Key Takeaways
- The 3D Graphene Market stands at USD 1.9 billion in 2025 and will reach USD 18.3 billion by 2035. Revenue grows at a 25.0% CAGR between 2026 and 2035.
- Graphene Foam leads the Type segment with a 46.2% share.
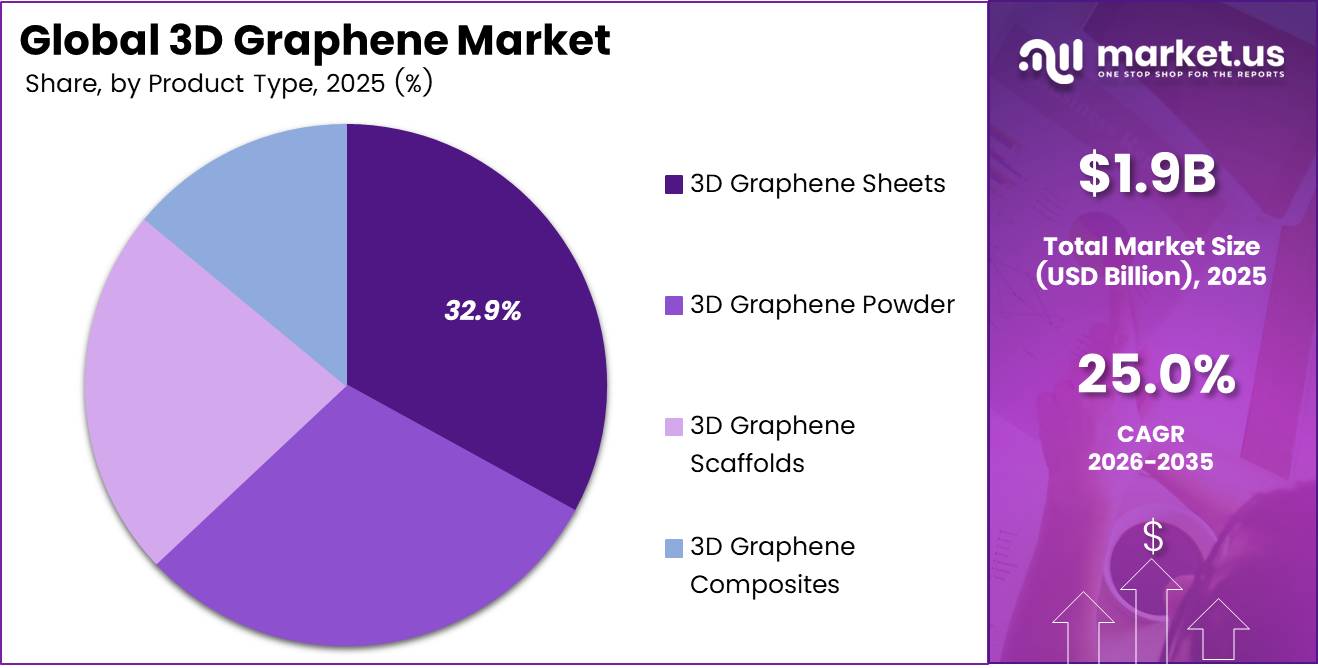
- 3D Graphene Sheets lead the Product Type segment with a 32.9% share.
- Energy Storage leads the Application segment with a 35.5% share.
- Electronic Devices lead the End-User Industry segment with a 34.6% share.
- Asia Pacific leads with a 46.2% share and USD 0.9 billion in revenue.
By Type
Graphene Foam dominates with 46.2% due to strong bulk mechanical strength.
Graphene Foam leads the type segment because it offers a light, strong, and highly porous structure that suits many industries at once. Its open-cell design gives it a very high surface area, which helps it soak up energy and heat better than solid materials.
Global manufacturing value added stood near 16.8 trillion dollars in 2024, and rising factory output creates more room for advanced material adoption like aerogel in filters, sensors, and insulation. As factories scale up clean energy and electronics lines, aerogel’s unique combination of low weight and high absorption keeps pulling in new buyers faster than any other type.
By Product Type
3D Graphene Sheets dominate with 32.9% due to easy integration into electronic devices.
3D Graphene Sheets lead the product type category because manufacturers can cut, layer, and shape them into flexible films for circuits, sensors, and displays. This flexibility fits well with the electronics supply chain. As chipmakers look for materials that improve heat spread and conductivity, graphene sheets remain the easiest form to test and adopt at scale.
3D Graphene Powder is the fastest-growing product type because it mixes easily into coatings, inks, and composite materials without needing complex processing steps. Powder form suits many small and mid-size manufacturers who want to add graphene’s strength and conductivity to existing products without new equipment.
With global chip sales for June 2026 alone reaching 134.5 billion dollars, a rise of 123.6% year over year, demand for versatile, easy-to-blend materials like graphene powder keeps climbing across many linked industries. This ease of use gives powder an edge in fast, low-cost scaling compared with sheets, scaffolds, or composites.
By Application
Energy Storage dominates with 35.5% due to strong demand for grid-scale batteries.
Energy Storage holds the top spot in the application segment because power grids around the world need better batteries to handle solar and wind supply swings. Graphene helps batteries charge faster and last longer, which matters as utility-scale battery projects made up 87 gigawatts of new capacity in 2025 out of a global total addition of 108 gigawatts. This heavy build-out of storage systems keeps energy storage as the largest buyer of advanced graphene materials.
Electronics is the fastest-growing application because chipmakers now search for materials that cool devices faster and carry signals better, especially as artificial intelligence hardware spreads. Deloitte projects that global semiconductor sales will hit 975 billion dollars in 2026, with growth accelerating to 26% that year after 22% growth in 2025.
By End-User Industry
Electronic Devices dominates with 34.6% due to rising chip performance demands.
Electronic Devices leads the end-user segment because device makers constantly search for materials that boost speed and reduce heat in smaller spaces. Logic chip sales alone reached 301.9 billion dollars in 2025, growing 39.9%, making logic products the largest chip category and a major pull for advanced materials like graphene. As phones, laptops, and wearables shrink in size but grow in power, graphene’s thin, strong structure fits well into this industry’s roadmap.
Automotive is the fastest-growing end-user industry because vehicle makers are shifting fast toward electric and connected cars that need lighter, stronger parts. Global vehicle production reached over 68.7 million units in the first nine months of 2025, up 4% from the prior year, showing steady industry expansion that supports new material adoption.
Key Market Segments
By Type
- Graphene Foam
- 3D Graphene Aerogel
- 3D Graphene Sponge
- Others
By Product Type
- 3D Graphene Sheets
- 3D Graphene Powder
- 3D Graphene Scaffolds
- 3D Graphene Composites
By Application
- Energy Storage
- Electronics
- Biomedicine
- Industrial
- Aerospace
By End-User Industry
- Electronic Devices
- Automotive
- Healthcare
- Energy
Geopolitical Impact Analysis
Trade policy now sets the cost floor for 3D graphene feedstock. United States trade authorities finalised combined antidumping and countervailing duties of about 160% on Chinese graphite active anode material, with the dumping margin set at 93.5% and the countervailing rate lifted to 66.68% from 11.58%, before the trade commission closed the injury case in 2026.
That swing forced buyers of graphite precursors, the same flake and synthetic feedstock used to grow foams and aerogels, to hold dual sourcing plans for months. The IEA notes that China widened its export licence net in November 2025 to cover synthetic graphite anode material, mixed anode blends, and the production equipment and process technology behind them, so licence lead times now sit inside every scale-up schedule.
Freight adds a second cost layer. UNCTAD recorded a 42% drop in trade volume through the Suez Canal after carriers began avoiding the Red Sea, and transits through both Suez and Panama fell by more than 40% from their peaks. The IMF measured Suez transit volumes down 50% year over year, and delivery times stretched by 10 days or more, which hits producers that hold thin inventories of nickel foam templates and specialty gases.
Demand still grew. The WTO lifted its 2025 merchandise trade growth forecast to 2.4% from the 0.9% projected in August, as buyers front-loaded orders ahead of duty deadlines. UNCTAD put global trade at a record USD 33 trillion in 2024, up 3.7%. For graphene suppliers, that mix means firm order books, longer cash cycles, and freight quotes that reset each quarter.
Regional Analysis
Asia Pacific dominates the 3D Graphene Market, holding a 46.2% share and generating USD 0.9 billion in revenue. The region pairs precursor supply with the world’s largest cell and electronics factories, so material moves from reactor to customer inside one trade bloc. India shows how fast the demand base widens.
The IEA counted a record 2.3 million electric vehicle sales in India in 2025, up 75% year over year, while Indonesia grew 125% and Viet Nam pushed the electric share of new car sales to about 40%. Thailand reached a 21% share. Each of those markets pulls in battery packs, thermal pads, and sensor films that use porous graphene structures.
North America ranks as the fastest-growing region in the 3D Graphene Market. Grid storage drives the pace. The IEA reported that the United States added 19 GW of battery capacity in 2025, a growth of about 60% year over year, with utility-scale projects taking over 16 GW and behind-the-meter systems reaching nearly 3 GW. That volume creates steady demand for conductive additives and porous electrode scaffolds.
North America
- US
- Canada
Europe
- Germany
- France
- The UK
- Spain
- Italy
- Rest of Europe
Asia Pacific
- China
- Japan
- South Korea
- India
- Australia
- Rest of APAC
Latin America
- Brazil
- Mexico
- Rest of Latin America
Middle East and Africa
- GCC
- South Africa
- Rest of MEA
Market Dynamics
Drivers
| Driver | (~) % Impact on CAGR Forecast | Geographic Relevance | Impact Timeline |
|---|---|---|---|
| Lithium-ion and next-gen battery electrode adoption | +3.2% | Asia Pacific, North America | Short term (2 years or less) |
| EV thermal management and lightweighting mandates | +2.4% | Europe, China | Short term (2 years or less) |
| Declining CVD and template-growth production costs | +2.1% | Global | Medium term (2 to 4 years) |
| Government-backed advanced materials funding programs | +1.6% | China, South Korea, EU | Short term (2 years or less) |
| Aerospace and defense composite qualification wins | +1.3% | North America, Europe | Medium term (2 to 4 years) |
| Water filtration and desalination membrane pilots | +0.9% | Middle East, Asia Pacific | Medium term (2 to 4 years) |
Battery Electrode Integration Reshapes Energy Storage Economics
The adoption of 3D graphene is being driven by the limitations of conventional graphite anodes and carbon-black conductive additives in meeting the fast-charging and energy-density requirements of 2026 EV platforms. Porous 3D graphene foam provides a continuous conductive network and high surface area, supporting faster ion and electron transport.
Pilot battery cells using graphene-enhanced electrodes have reported charging-time reductions of around 15% to 20% and cycle-life improvements of more than 30%. Commercial feasibility is also improving as production costs decline. The cost of template-grown and CVD-derived 3D graphene fell from approximately USD 100 per gram in 2018 to nearly USD 45 per gram by 2023, reducing the cost gap with conventional carbon additives.
This transition is supporting blended conductive-additive architectures, with potential raw-material input cost reductions of around 8% to 12% per battery pack over a 24-month adoption cycle, while encouraging investment in graphene-integrated electrode production lines.
Restraints
| Restraint | (~) % Impact on CAGR Forecast | Geographic Relevance | Impact Timeline |
|---|---|---|---|
| High-purity precursor capital scarcity | -2.8% | Global | Short term (2 years or less) |
| Elevated interest rates delaying pilot-plant financing | -1.7% | North America, Europe | Short term (2 years or less) |
| Export controls on specialty graphite feedstock | -1.4% | China, United States | Short term (2 years or less) |
| Absence of standardized safety classification | -0.9% | Europe, North America | Medium term (2 to 4 years) |
| Substrate-scale production equipment shortages | -0.7% | Asia Pacific | Short term (2 years or less) |
Precursor Capital Scarcity Freezes Near-Term Capacity Expansion
High-purity graphite and specialty precursor gases used in 3D graphene production remain costly to source and refine, while tighter lending conditions through 2025 have increased financing challenges for new manufacturing facilities. Precursor materials and specialty gases are estimated to account for nearly 30% of total production costs.
These cost and financing pressures are delaying the transition from pilot-scale to commercial production. Several capacity expansion projects have been postponed, while producers are estimated to face gross-margin pressure of around 5% to 7% due to input-cost volatility.
Challenges
| Challenge | (~) % CAGR Friction Drag | Geographic Relevance | Mitigation Horizon |
|---|---|---|---|
| Batch-to-batch quality inconsistency | -1.9% | Global | Medium term (2 to 4 years) |
| Specialized materials science talent deficit | -1.3% | North America, Europe | Long term (4 years or more) |
| Defect density at industrial scale-up | -1.1% | Asia Pacific, Global | Medium term (2 to 4 years) |
| Fragmented downstream integration standards | -0.8% | Global | Long term (4 years or more) |
| Logistics dependency on niche graphite mines | -0.6% | Africa, China, Brazil | Medium term (2 to 4 years) |
Quality Consistency Gaps Undermine Scale-Up Ceiling
Scaling 3D graphene production from laboratory to industrial volumes remains technically challenging, as dispersion stability, layer uniformity, and defect control become harder to maintain at higher throughput. Producers operating at multi-ton scale report yield losses of approximately 20% to 35% compared with pilot batches, while around 1 in 4 commercial batches may experience defect-density variations outside acceptable quality limits.
The challenge is further intensified by a shortage of qualified process engineers ahead of projected 2030 workforce requirements. Producers are therefore investing in automated quality-control systems, in-house testing laboratories, and university-industry training programs. Inline defect-detection technologies are being targeted to reduce batch rejection rates by around 10% to 15%, although these improvements require sustained multi-year investment.
Opportunities
| Opportunity | (~) % Potential CAGR Upside | Geographic Relevance | Execution Window |
|---|---|---|---|
| Desalination and water filtration membrane roll-out | +2.2% | Middle East, Asia Pacific | Medium term (2 to 4 years) |
| Biomedical scaffold and sensor monetization | +1.7% | North America, Europe | Long term (4 years or more) |
| Waste-graphite-derived circular feedstock roll-ups | +1.4% | Europe, China | Medium term (2 to 4 years) |
| Semiconductor thermal interface white space | +1.2% | Taiwan, South Korea, US | Long term (4 years or more) |
| Additive manufacturing feedstock licensing | +0.8% | Global | Long term (4 years or more) |
Water Filtration Membranes Represent Untapped Adjacent White Space
This opportunity remains largely untapped because commercial adoption of 3D graphene membranes is still limited to pilot projects rather than large-scale municipal or industrial installations. Pilot data indicate that porous 3D graphene membranes can deliver approximately 25% to 40% higher water flux than conventional polymer membranes while reducing energy consumption per liter treated by around 15%.
Commercialization could also improve supplier economics, with gross margins potentially increasing by around 6 to 9 percentage points compared with conventional reverse-osmosis membrane products. However, capturing this opportunity requires municipal qualification, commercial-scale validation, and investment in membrane production facilities, with approval and validation cycles generally taking around 3 to 4 years.
Key Players Analysis
NanoXplore sits in Tier 1 on volume and revenue. The company reported total fiscal 2025 revenues of C$128.9 million against C$130.0 million in fiscal 2024, lifted adjusted gross margin to 22.3% from 21.1%, and cut its net loss to C$9.66 million from C$11.67 million. It runs a 4,000 metric tonne per year graphene powder plant that it states covers about 40% of global supply. Third quarter fiscal 2026 revenue rose 6% to C$32.3 million.
Management then terminated a USD 100 million coated spherical purified graphite programme by April 2026 to cut project risk, and redirected capital into a dry process line rated at 500 to 1,000 tonnes per year. Graphenea holds the other Tier 1 role in device-grade supply, and raised USD 2.5 million in 2024 to expand its foundry and product line.
Tier 2 challengers trade on niche positions and thinner balance sheets. Haydale reported interim revenue of £1.25 million, down 50% from £2.47 million, with an adjusted operating loss of £2.13 million, and a full-year loss of £6.1 million. It then bought SaveMoneyCutCarbon for all-share consideration.
Versarien grew half-year revenue 9.7% to £1.47 million, yet graphene revenue slipped to £0.21 million, and cash stood at £0.65 million against a pre-tax loss of £1.49 million. G6 Materials reports annual revenue near USD 1.5 million. XG Sciences and Applied Graphene Materials publish no current audited figures, so treat their standing as unverified.
Top Key Players in the Market
- Graphenea
- XG Sciences
- Haydale Graphene Industries
- Applied Graphene Materials
- NanoXplore
- Versarien
- G6 Materials Corp.
- Other
Recent Developments
- In October 2025, NanoXplore launched new high surface area graphene grades for plastics, which it states hold about 40% of global powder supply, with commercial production set for early 2026. NanoXplore completed installation of the first module of its dry process production line, designed for 500 to 1,000 tonnes per year, and launched the xGnP D500-HP high purity grade.
- In December 2025, Haydale agreed to acquire Intelligent Resource Management Limited, trading as SaveMoneyCutCarbon, for all-share consideration of up to £17.11 million, alongside a proposed fundraise of up to £6.41 million at 0.5 pence per share. Haydale completed the SaveMoneyCutCarbon acquisition with initial consideration of £11.16 million in shares and gross fundraising proceeds of about £5.75 million.
Report Scope
| Report Features | Description |
|---|---|
| Market Value (2025) | USD 1.9 Billion |
| Forecast Revenue (2035) | USD 18.3 Billion |
| CAGR (2026-2035) | 25.0% |
| Base Year for Estimation | 2025 |
| Historic Period | 2020-2024 |
| Forecast Period | 2026-2035 |
| Report Coverage | Revenue Forecast, Market Dynamics, Competitive Landscape, Recent Developments |
| Segments Covered | By Type (Graphene Foam, 3D Graphene Aerogel, 3D Graphene Sponge, Others); By Product Type (3D Graphene Sheets, 3D Graphene Powder, 3D Graphene Scaffolds, 3D Graphene Composites); By Application (Energy Storage, Electronics, Biomedicine, Industrial, Aerospace); By End-User Industry (Electronic Devices, Automotive, Healthcare, Energy) |
| Regional Analysis | North America – US, Canada; Europe – Germany, France, The UK, Spain, Italy, Rest of Europe; Asia Pacific – China, Japan, South Korea, India, Australia, Singapore, Rest of APAC; Latin America – Brazil, Mexico, Rest of Latin America; Middle East & Africa – GCC, South Africa, Rest of MEA |
| Competitive Landscape | Graphenea, XG Sciences, Haydale Graphene Industries, Applied Graphene Materials, NanoXplore, Versarien, G6 Materials Corp. |
| Customization Scope | Customization for segments and region/country levels will be provided. Moreover, customization can be tailored to the requirements. |
| Purchase Options | We have three licenses to opt for: Single User License, Multi-User License (Up to 5 Users), Corporate Use License (Unlimited Users and Printable PDF) |





























