


Report Overview
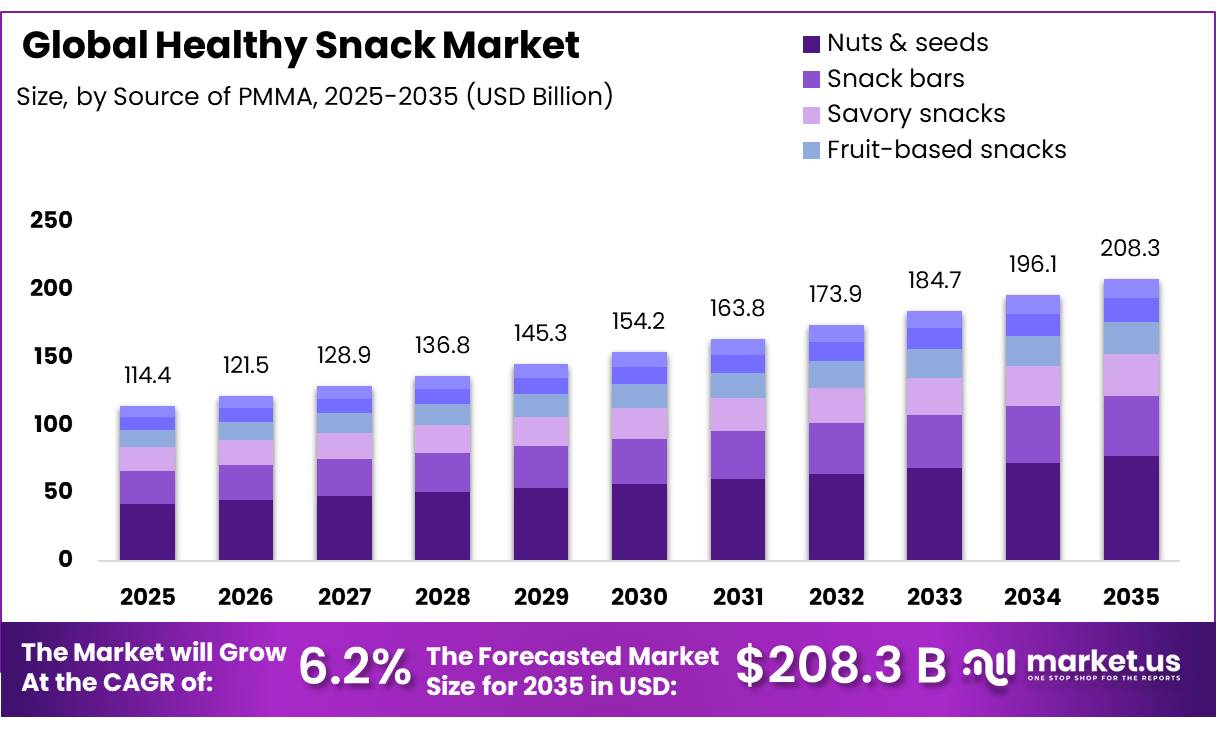
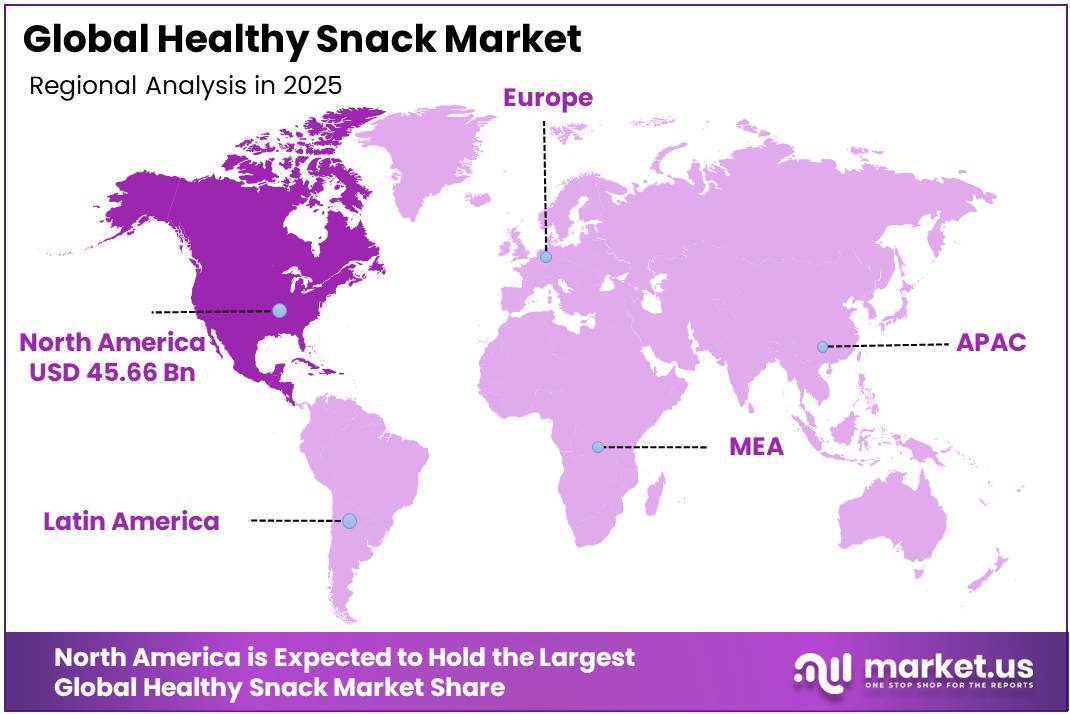
The Global Healthy Snack Market was valued at USD 114.4 billion in 2025, and between 2026 and 2035, this market is estimated to register a CAGR of 6.2%, reaching about USD 208.3 billion by 2035. In 2025, North America led the market, achieving over 39.9% share with a revenue of USD 45.66 billion.
The Healthy Snack Market consists of nutrient-dense, portion-controlled food substitutes that complement or replace regular meals while offering practical health advantages. The primary drivers of this market’s growth are changing consumer lifestyles and a growing emphasis on preventive healthcare worldwide. To actively fight lifestyle-related chronic illnesses, consumers are increasingly substituting fast, on-the-go macronutrient alternatives for traditional meals.
- According to a clinical study published by the National Institutes of Health (NIH), snacks now represent approximately 22% to 27% of total daily calorie intake for consumers. This volume surpasses the individual caloric intakes of both breakfast (18%) and lunch (24%).
- According to research from the NIH National Center for Biotechnology Information, typical, unhealthy snacking practices account for a disproportionate 40% of an individual’s total daily added sugar consumption. This baseline statistic confirms the government’s considerable regulatory effort to require low-sugar formulas.
Manufacturing complexities, on the other hand, are major market limitations. Removing structural fats and sugars while integrating whole grains has a negative influence on moisture retention and crispness, resulting in serious shelf-stability and texture degradation issues. The current driving force behind the industry is the growing desire for clean-label, low-sugar products containing targeted, mood-boosting functional botanicals.
Key Takeaways
- The global healthy snack market was valued at US$ 114.4 billion in 2025.
- The global healthy snack market is projected to grow at a CAGR of 6.2% and is estimated to reach US$ 208.3 billion by 2035.
- On the basis of Source of PMMA, nuts & seeds dominated the market, constituting 37.1% of the total market share.
- On the basis of source, plant-based options dominated the market, constituting 67.3% of the total market share.
- On the basis of nutrition, low / no sugar options dominated the market, constituting 24.3% of the total market share.
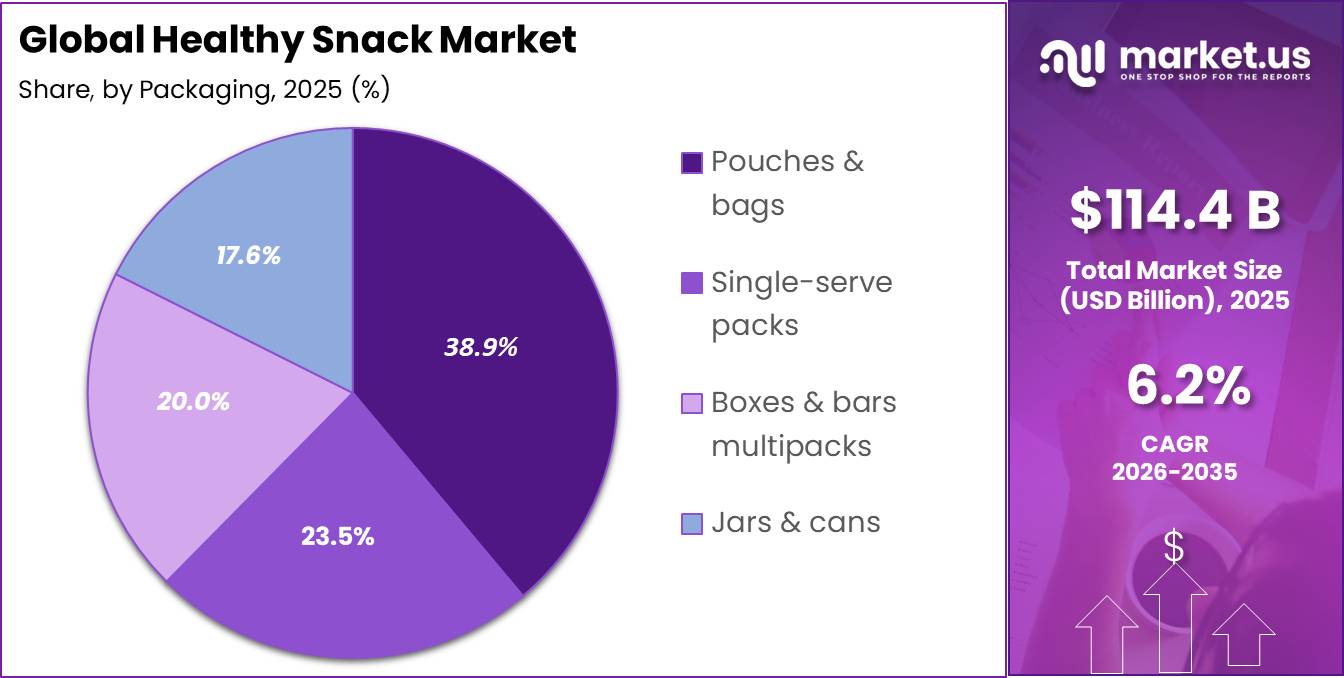
- On the basis of packaging, pouches & bags dominated the market, constituting 38.9% of the total market share.
- North America dominated the market, constituting 39.9% of the total market share.
Source of PMMA Analysis
Nuts and Seeds represent dominant Segment in the Market
Nuts and Seeds represent the dominant segment in the healthy snack market, accounting for 37.1% share due to naturally high lipid, protein, and dietary fiber density of unrefined agricultural inputs, as well as their natural alignment with clean-label macro allocation parameters. This leading market uses modern roasting, pasteurization, and seasoning technology to retain volatile fatty acids while ensuring structural shelf stability.
This continued market leadership originates from minimal raw material processing requirements, which significantly reduce operational costs as compared to highly designed snack bars. Furthermore, robust worldwide agricultural supply chains for tree nuts provide high-volume predictability, allowing large businesses to reduce production downtime.
Source Analysis
Plant-based is a significant source segment
The plant-based segment accounts for 67.3% of the healthy snack market, due to rapid expansion of allergen-free formulations, consumer avoidance of animal-derived lipids, and highly optimized agricultural processing streams that isolate proteins at a low cost. This continued leadership is bolstered by the widespread commercial availability of dry and wet fractionation processing equipment.
These unique manufacturing procedures enable processors to isolate pure plant proteins while preserving their native emulsification properties. Economically, major food corporations emphasize this market because raw plant materials are immune to the price shocks and supply concerns that plague animal-based supply chains.
Nutrition Analysis
Low/No Sugar Are the Most Widely Used Nutrition
Low/No sugar, accounting for 24.3% of the healthy snack market, represents the dominant segment is due to global consumer attempts to regulate metabolic health, stringent government sugar tariffs, and significant advances in natural alternative sweetener chemistry.
The organic/clean label segment is expected to be driven by demand for minimally processed, transparent foods. Growth stems from a lack of faith in manmade ingredients. Constraints include expensive certification fees and a limited shelf life. Cold-chain logistics and high-pressure processing (HPP) are solutions for extending freshness without the use of preservatives.
Packaging Analysis
Pouches & Bags Held a Major Share of the Healthy Snack Market
Pouches & Bags, accounting for 38.9% of the market, represent the dominant segment as it is characterized by its extremely lightweight design, cheap material costs, and great compatibility with automated, high-speed Vertical Form-Fill-Seal (VFFS) equipment. This leading market employs multi-layered barrier laminates composed of oriented polypropylene (OPP), metallized polyester (MET-PET), and low-density polyethylene (LDPE).
For example, stand-up zipper pouches for savory crisps and snack clusters are popular on retail shelves due to their huge branding surfaces and resealable capabilities. Flexible films’ superior physical efficiency, which reduces transportation weight and emissions when compared to rigid plastic or glass containers, contributes to their market domination.
Key Market Segments
By Source of PMMA
- Nuts & seeds
- Snack bars
- Savory snacks
- Fruit‑based snacks
- Dairy & yogurt snacks
- Bakery & others
By Source
- Plant‑based
- Mixed source
- Animal‑based
By Nutrition
- Low / no sugar
- High protein
- High fiber
- Low / no fat
- Organic/clean label
- Gluten‑free
- Vegan / plant‑based
By Packaging
- Pouches & bags
- Single‑serve packs
- Boxes & bars multipacks
- Jars & cans
Market Dynamics
Drivers
| Driver | (~) % Impact on CAGR | Geographic Relevance | Impact Timeline |
|---|---|---|---|
| Shift to functional snacks | +2.0% | North America, Europe, Asia-Pacific | Short term (≤ 2 years) |
| Clean-label & low-sugar preference | +1.4% | Global urban consumers | Short term (≤ 2 years) |
| Expansion of modern retail | +1.1% | Asia-Pacific, Latin America | Medium term (2 to 4 years) |
| Digital D2C snack brands | +0.9% | Global, skewed to developed markets | Short term (≤ 2 years) |
| Workplace & on-the-go consumption | +0.8% | Global employed population | Medium term (2 to 4 years) |
Shift to functional snacks
Rising consumer focus on gut health, immunity, and metabolic fitness over the last 2 years has accelerated the pivot from generic better-for-you products to snacks with explicit functional claims such as high protein, fiber, probiotics, or micronutrient fortification, evidenced by double-digit volume growth in functional bars and nut & seed mixes in North America and Asia-Pacific between 2024 and 2026.
This structural shift adds roughly 2.0 percentage points to the healthy snacks baseline CAGR of 6.2% by lifting average realized price per kilogram by an estimated 8% to 12% and sustaining mid to high single-digit volume growth as functional SKUs capture share from traditional confectionery.
Manufacturers are reconfiguring business models from low-margin, high-volume commodity snacks toward premium, claim-based portfolios where gross margins can expand from approximately 22% to 25% on legacy SKUs to 30% to 35% on functional formats, supported by investments of 3% to 5% of sales in R&D and nutrition science partnerships and by reformulating recipes to integrate plant proteins, fibers, and bioactive ingredients without compromising shelf life.
This margin profile enables greater brand-building and digital marketing spend, often increasing customer acquisition cost by 10% to 15% per new customer while still keeping contribution margins positive, and shifts capacity planning toward flexible manufacturing lines capable of shorter runs and 20% to 30% faster SKU innovation cycles than conventional snack plants.
Restraints
| Restraint | (~) % Impact on CAGR | Geographic Relevance | Impact Timeline |
|---|---|---|---|
| Price sensitivity in mass market | -1.6% | Emerging markets, lower-income segments | Short term (≤ 2 years) |
| High interest rates & capital cost | -1.3% | Global, SMEs and start-ups | Short term (≤ 2 years) |
| HFSS-linked regulatory scrutiny | -1.1% | Europe, India, parts of Latin America | Medium term (2 to 4 years) |
| Ingredient cost volatility | -0.9% | Global commodity-linked supply chains | Short term (≤ 2 years) |
| Limited cold-chain & logistics | -0.7% | Emerging markets distribution | Medium term (2 to 4 years) |
Price sensitivity in mass market
The core restraint is the affordability gap between healthy snacks that incorporate premium ingredients and processing and the price expectations of mass-market consumers, particularly in emerging economies where per-capita snack spending remains below roughly US$ 100 annually and staple foods still account for over 60% of household food budgets.
This price sensitivity subtracts an estimated 1.6 percentage points from the baseline CAGR of 6.2% by limiting penetration beyond affluent urban cohorts and forcing brands to either compress gross margins by 3% to 5% through aggressive promotions or reduce functional ingredient loading to hit key psychological price points, for example keeping on-shelf prices below ₹50 to ₹75 per single-serve pack in India and under US$ 2 per bar in many developing markets.
On the quantitative side, higher input costs for nuts, seeds, and plant proteins, often 20% to 30% above conventional carbohydrate-based snacks on a per-kilogram basis, combined with packaging and distribution overheads, mean healthy formats can be priced at a 30% to 50% premium over traditional snacks, a differential that caps volume growth when median disposable incomes grow only in low single digits.
Challenges
| Challenge | (~) % CAGR | Geographic Relevance | Mitigation Horizon |
|---|---|---|---|
| Plant-protein formulation complexity | -1.5% | Global manufacturers | Medium term (2 to 4 years) |
| Supply chain traceability gaps | -1.2% | Global multi-tier supply chains | Long term (≥ 4 years) |
| Talent scarcity in nutrition R&D | -1.0% | Global, especially emerging markets | Long term (≥ 4 years) |
| Fragmented consumer education | -0.8% | Global, skewed to emerging markets | Medium term (2 to 4 years) |
| Retail shelf-space competition | -0.7% | Modern trade globally | Short term (≤ 2 years) |
Plant-protein formulation complexity
Formulating bars, chips, or baked snacks with 10 to 20 grams of protein per serving using pea, soy, lentil, or rice proteins without chalkiness or off-notes typically requires multiple iterations and specialized ingredients, raising R&D costs by an estimated 20% to 30% per project and increasing development cycles from roughly 6 to 9 months to 12 to 18 months.
These frictions subtract around 1.5 percentage points from the segment potential CAGR by slowing SKU innovation velocity and constraining brands’ ability to fully capitalize on health-conscious demand, with rejection rates in consumer sensory panels for early plant-protein concepts often exceeding 40% to 50% until formulations are optimized.
Companies must undertake long-term adjustments such as investing 2% to 3% additional percentage points of revenue in pilot plants, advanced extrusion and baking technologies, and collaborations with ingredient suppliers, while building cross-functional teams that integrate nutrition scientists, food technologists, and sensory experts to systematically reduce texture defects and stability issues such as fat bloom and moisture migration that otherwise shorten shelf life from 9 to 12 months to 6 to 9 months.
Opportunities
| Opportunity | (~) % Potential CAGR | Geographic Relevance | Execution Window |
|---|---|---|---|
| Personalized nutrition snack ecosystems | +2.1% | Developed markets, digitally connected consumers | Medium term (2 to 4 years) |
| Untapped workplace wellness channels | +1.5% | Global corporate sector | Medium term (2 to 4 years) |
| Healthy snacks in school nutrition | +1.3% | North America, Europe, India | Long term (≥ 4 years) |
| Regional ingredient-led premiumization | +1.0% | Asia-Pacific, Latin America, Africa | Long term (≥ 4 years) |
| Data-driven supply chain optimization | +0.9% | Global multi-plant networks | Medium term (2 to 4 years) |
Personalized nutrition snack ecosystems
Personalized nutrition remains largely untapped in the healthy snacks segment today, making integrated ecosystems that combine diagnostic data, digital coaching, and tailored snack portfolios a high-upside opportunity rather than an existing driver.
By linking wearables, microbiome or blood panels, and app-based diet tracking to curated snack subscriptions, brands can add an estimated 2.1 percentage points of CAGR upside above the baseline 6.2% by lifting customer lifetime value 1.5 to 2.0 times and increasing purchase frequency from roughly 3 to 4 snack purchases per week to 5 to 6, with subscription churn potentially cut by 20% to 30% compared with generic e-commerce.
Unit economics can improve through dynamic bundling and direct-to-consumer logistics, where average order sizes rise by 25% to 35%, and per-unit fulfillment costs fall 10% to 15% due to optimized shipping and reduced retail trade spend, shifting gross margins on personalized assortments into the 35% to 40% range compared with roughly 25% to 30% for mass-market SKUs.
Geopolitical Impact Analysis
Ongoing military conflicts and growing regional trade warfare have severely affected the primary agricultural trade channels that supply the healthy snack production pipeline. Prolonged maritime blockades in the Black Sea, as well as targeted drone strikes on shipping routes through the Red Sea and the Strait of Hormuz, have hampered the flow of important fertilizer exports and raw cereals.
These persistent shipping lane constraints push food processing organizations to acquire alternate, more expensive cargo routes, hence inflating net transit durations and baseline freight prices. For example, manufacturers of clean-label snacks are experiencing immediate raw ingredient shortages for critical inputs such as non-GMO sunflower oils, ancient grains, and plant-derived proteins, which are predominantly grown in affected eastern European agricultural corridors.
This disruption requires processing lines to fully reformulate functional food bases, resulting in unexpected production friction and extended product time-to-market metrics. The uncertain worldwide economic climate has resulted in significant increases in agricultural spot-market pricing for in-demand ingredients such as cacao, imported tree nuts, and specialist fruit inclusions.
Regional Analysis
North America Held the Largest Share of the Global Healthy Snack Market
North America dominated the global healthy snack market, holding about 39.9% of the total global consumption, due to a highly developed retail distribution system, extreme consumer alignment with macronutrient tracking, and extensive proactive health management habits.
The high-protein extruded savory crisps and clean-label botanical energy bars are popular in local convenience channels, convenience stores, and workplace micro-markets. Furthermore, huge multinational food conglomerates choose North American supply chains due to their high premium-price tolerance, allowing manufacturers to effectively launch advanced, high-margin product iterations such as tailored metabolic-targeting snacks.
Europe represented the second-largest regional market, supported by increasing consumer preference for clean-label, organic, and natural snack products. Countries such as Germany, the United Kingdom, France, and Italy have witnessed rising demand for healthier food choices as consumers focus more on balanced diets and wellness-oriented lifestyles.
Key Regions and Countries Covered in this Report
- North America
- The US
- Canada
- Europe
- Germany
- France
- The UK
- Spain
- Italy
- Russia & CIS
- Rest of Europe
- APAC
- China
- Japan
- South Korea
- India
- ASEAN
- Rest of APAC
- Latin America
- Brazil
- Mexico
- Rest of Latin America
- Middle East & Africa
- GCC
- South Africa
- Rest of MEA
Key Players Analysis
The healthy snack market is characterized by a highly fragmented, monopolistic competition structure. While multinational food firms have large retail distribution networks and massive production capacities, no single entity holds a dominant, monopolistic share of the market. Instead, the market environment is characterized by a steady infusion of small- to medium-sized artisanal businesses and specialized wellness brands that successfully differentiate their product portfolios through distinct functional qualities.
The growing availability of third-party contract manufacturing organizations (CMOs) and co-packers enables young firms to swiftly scale their production pipelines without incurring large upfront capital costs for industrial factory equipment.
As a result, brands compete fiercely on non-price factors to capture consumer attention, relying heavily on hyper-specific product differentiation such as proprietary alternative protein sources, clean-label ingredient transparency, localized flavor profiles, and specialized wellness certifications such as organic, keto, or non-GMO.
This constant influx of novel options results in a retail environment with extremely cheap consumer switching costs across traditional and digital distribution channels. To avoid single-brand market monopolization and protect their physical shelf space, multinational food corporations must pursue aggressive, continuous corporate acquisition tactics, strategically purchasing successful high-growth startups to maintain their own market footprints.
Major Players in the Industry
- PepsiCo, Inc.
- Mondelēz International, Inc.
- Nestlé S.A.
- Danone S.A.
- Unilever PLC
- Kellogg Company
- General Mills, Inc.
- Hormel Foods Corporation
- B&G Foods, Inc.
- Calbee, Inc.
- Tyson Foods, Inc.
- Del Monte Foods, Inc.
- Select Harvests Limited
- Mars, Incorporated (incl. KIND)
- Clif Bar & Company
- Others
Key Development
- In May 2026, Sow Good also began shipping its new Caramel Crunch product through a private-label partnership with a national retailer operating approximately 600 stores. The product uses the company’s long-cycle freeze-drying process and contains zero artificial dyes or flavours, strengthening its presence in the clean-label and better-for-you snack category.
- In March 2026, Hershey introduced its “Lead Next Generation Snacking” strategy, bringing confectionery, salty snacks and better-for-you products under one operating model. The company projected 4%–5% net sales growth for 2026, including an estimated 150-basis-point contribution from its 2025 acquisition of LesserEvil, a producer of organic popcorn and puffed snacks.
Report Scope
| Report Features | Description |
|---|---|
| Market Value (2025) | USD 114.4 Bn |
| Forecast Revenue (2035) | USD 208.3 Bn |
| CAGR (2026-2035) | 6.2% |
| Base Year for Estimation | 2025 |
| Historic Period | 2020-2024 |
| Forecast Period | 2026-2035 |
| Report Coverage | Revenue Forecast, Market Dynamics, Competitive Landscape, Recent Developments |
| Segments Covered | By Source of PMMA (Nuts & seeds, Snack bars, Savory snacks, Fruit‑based snacks, Dairy & yogurt snacks, Bakery & others), By Source (Plant‑based, Mixed source, Animal‑based), By Nutrition (Low / no sugar, High protein, High fiber, Low / no fat, Organic / clean label, Gluten‑free, Vegan / plant‑based), By Packaging (Pouches & bags, Single‑serve packs, Boxes & bars multipacks, Jars & cans) |
| Regional Analysis | North America – The US & Canada; Europe – Germany, France, The UK, Spain, Italy, Russia & CIS, Rest of Europe; APAC – China, Japan, South Korea, India, ASEAN & Rest of APAC; Latin America – Brazil, Mexico & Rest of Latin America; Middle East & Africa – GCC, South Africa & Rest of MEA |
| Competitive Landscape | PepsiCo Inc., Mondelēz International Inc., Nestlé S.A., Danone S.A., Unilever PLC, Kellogg Company, General Mills Inc., Hormel Foods Corporation, B&G Foods Inc., Calbee Inc., Tyson Foods Inc., Del Monte Foods Inc., Select Harvests Limited, Mars Incorporated (incl. KIND), Clif Bar & Company and Other Players |
| Customization Scope | Customization for segments and region/country-level will be provided. Moreover, we can provide further customization to meet your requirements. |
| Purchase Options | We have three licenses to opt for: Single User License, Multi-User License (Up to 5 Users), Corporate Use License (Unlimited Users and Printable PDF) |





































