
Quick Navigation
Report Overview
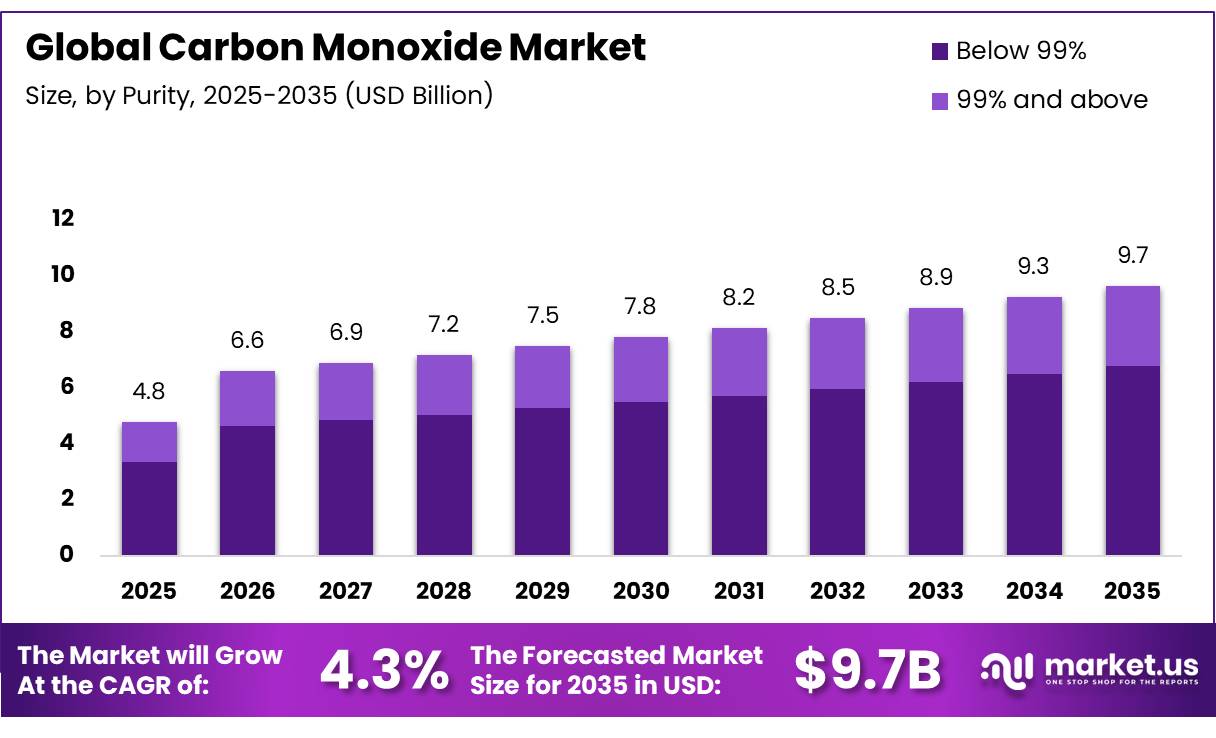
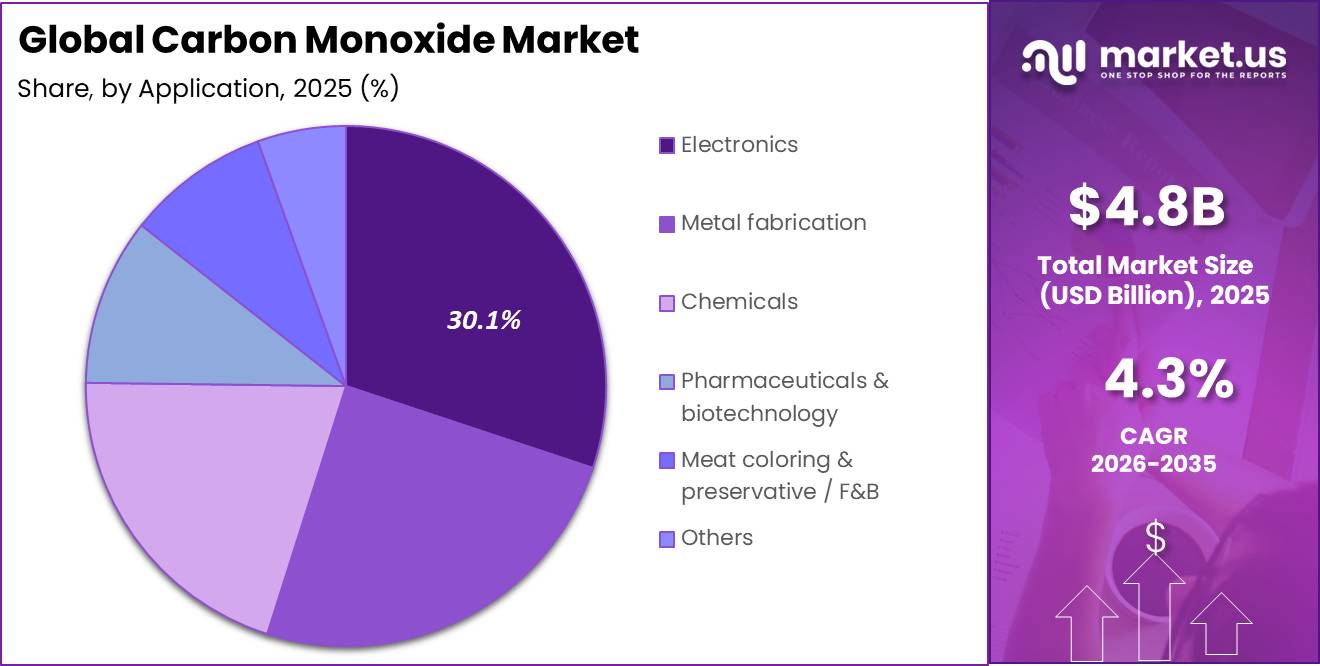
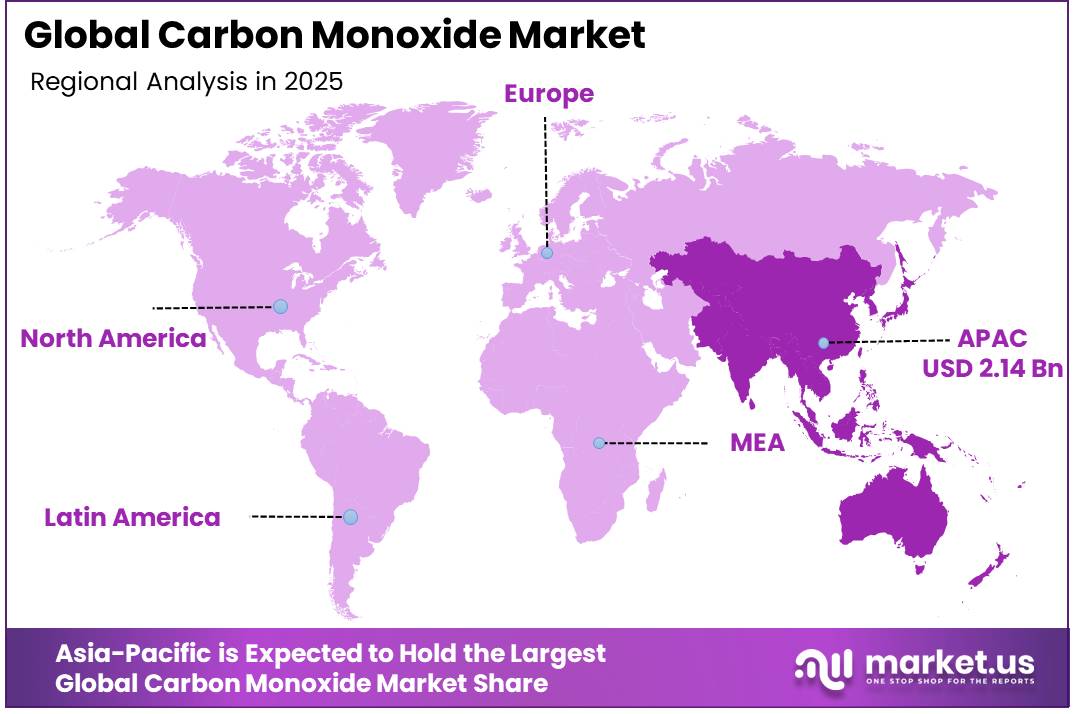
In 2025, the Global Carbon Monoxide Market was valued at US$4.8 billion, and between 2026 and 2035, this market is estimated to register a CAGR of 4.3%, reaching about US$9.7 billion by 2035. In 2025, Asia Pacific led the market, achieving over 44.8% share with a revenue of US $2.14 billion.
The carbon monoxide market includes the industrial production, purification, bulk transportation, and commercial application of carbon monoxide (CO) gas as a critical raw material. The market is growing due to the increasing use of carbon monoxide as a critical chemical feedstock for downstream high-volume synthesis. For example, the gas serves as the primary building block for the production of acetic acid, polycarbonates, and methanol.
- In 2024, According to the United States Geological Survey (USGS), domestic mining operations extracted 48,000 kilotons of iron ore. The resulting growth in downstream metallurgical processing and steel production increases the consumption of carbon monoxide, which is widely used as a reducing agent in blast furnace operations and other metal refining processes.
Key Takeaways
- The global carbon monoxide market was valued at USD 4.8 billion in 2025.
- The market is projected to grow at a CAGR of 4.3% and is estimated to reach USD 9.7 billion by 2035.
- Electronics accounted for a leading 30.1% share of the market in 2025, driven by the stringent ultra-pure carbon monoxide requirements of semiconductor fabrication and plasma etching processes.
- Below 99% purity accounted for a leading 70.2% share of the market in 2025, supported by high-volume demand from bulk chemical synthesis and heavy metallurgical reduction operations where ultra-high purity specifications are not required.
- Gas Mixtures accounted for a leading 50.1% share of the market in 2025, reflecting the widespread industrial preference for synthesis gas blends over isolated pure gases across chemical and energy applications.
- Asia Pacific accounted for a leading 44.8% share of the market in 2025, underpinned by the concentration of large-scale manufacturing hubs, expanding electronics foundries, and integrated chemical production corridors across the region.
Energy price volatility encourages industrial gas producers to adopt long-term supply agreements and captive generation systems to stabilize production costs. Large industrial providers mitigate this volatility by including cost pass-through clauses in tolling agreements. Strict regulatory restrictions limiting occupational exposure and carbon emissions are the key market limitations. These requirements increase operational compliance costs and have a significant influence on pipeline infrastructure expansion.
- In 2024, According to data from India’s Ministry of Coal, annually coal production reached 826 million tonnes, representing an 11.71% rise in a primary feedstock reserves necessary to scale industrial coal-to-carbon monoxide gasification plants.
Digitalization and artificial intelligence-driven process optimization are projected to boost production efficiency and safety monitoring in industrial gas facilities with industrial gas infrastructure. AI algorithms improve real-time steam methane reforming, predict catalyst degradation, and control gas grid pipeline pressures. Furthermore, automated sensor systems dynamically balance supply-demand ratios, reducing localized storage risks.
Carbon Monoxide Market Segmentation
Purity Analysis
Below 99% represents dominant Segment in the Market.
Below 99% represent the dominant segment in the carbon monoxide market, accounting for 70.2% share due to heavy primary industries, such as large-scale chemical carbonylation, bulk synthesis gas separation, and metallurgical reduction processing, operate on a widespread scale. These industrial uses consume large amounts of lower-purity carbon monoxide gas straight from captive, on-site steam methane reforming or coal gasification facilities.
- China’s National Bureau of Statistics reported coal output exceeding 83 billion tonnes in 2025, supporting large-scale coal gasification projects that produce carbon monoxide-rich synthesis gas for methanol, acetic acid, and fuel production.
The 99% and above purity segment will register the fastest growing segment due to the strict quality control and contamination standards mandated by high-tech industries, such as advanced electronics fabrication, fine chemical synthesis, and pharmaceutical manufacturing. These specialized sectors utilize Grade 5.0 ultra-pure carbon monoxide gas, which requires chemical purity levels exceeding 99.999% to prevent metallic and moisture defects during atomic-level manufacturing.
Product Analysis
Gas Mixtures Are the Most Widely Used Product in Carbon Monoxide.
Gas Mixtures accounting for 50.1% of the carbon monoxide market, represents the dominant material segment due to the frequent use of synthesis gas, a precise mixture of hydrogen and carbon monoxide, in the chemical, refining, and power generation industries worldwide. These integrated gas mixtures are used economically by large industrial clusters to operate continuous production loops that minimize waste heat and maximize energy efficiency by directing byproduct gases into localized utility and power grids.
- The Methanol Institute reports that global methanol production capacity surpassed 170 million metric tonnes per year in 2025, with methanol synthesis relying on syngas mixtures containing carbon monoxide and hydrogen as the primary feedstock.
The bulk and on-site generation systems segment represents the leading upcoming trend, this future potential is driven by the growing industrial shift toward decentralized, modular chemical manufacturing models. For example, engineering companies are implementing containerized steam methane reforming units that enable specialty chemical facilities to produce carbon monoxide on demand, thereby removing the risks associated with long-distance hazardous shipping.
Application Analysis
Carbon Monoxide Are Mostly Utilized in the Electronics Sector.
The electronics segment, accounting for 30.1% of the carbon monoxide market, remains the dominant due to the continued expansion of semiconductor fabrication, display manufacturing, and electronic component production, all of which require high-purity process gases for controlled manufacturing environments. Carbon monoxide is used in specialized deposition, etching, and gas-phase processing applications within advanced electronics production. The growing investment in semiconductor manufacturing facilities further strengthened demand from this sector.
- According to the Semiconductor Industry Association (SIA), global semiconductor sales reached approximately US$791.7 billion in 2025, representing one of the highest annual industry values on record.
The chemicals segment represents the primary upcoming trending application, projected to achieve a massive industrial utilization milestone of over 12,000 kilotons by 2035. This long-term future potential centers on the widespread adoption of carbonylation pathways to synthesize high-volume organic chemical bases, polymers, and acetyl derivatives. For instance, industrial chemical clusters utilize carbon monoxide as a core reactant alongside methanol to produce acetic acid, which serves as a foundational building block for vinyl acetate monomer, plastics, and pharmaceutical synthesis.
Key Market Segments
By Application
- Electronics
- Metal fabrication
- Chemicals
- Pharmaceuticals & biotechnology
- Meat coloring & preservative / F&B
- Others
By Purity
- Below 99%
- 99% and above
By Product
- Compressed gas
- Gas mixtures
- Bulk / on‑site generation
Driver Analysis
Gas-fired appliance exposure in homes.
A large installed base of combustion-linked household energy use keeps carbon monoxide risk materially relevant, especially in colder regions where boilers, furnaces, gas water heating, or fireplaces remain common. Eurostat reports that households represented 26.0% of final energy consumption in the EU in 2024 and that natural gas accounted for 29.4% of EU household final energy use, showing that a substantial portion of homes still rely on combustion-linked energy systems that justify detector placement.
Drivers Impact Analysis
| Driver | (~) % Impact on CAGR Forecast | Geographic Relevance | Impact Timeline |
|---|---|---|---|
| Mandated whole-home alarm coverage expansion | +2.1% | North America core, especially Ontario spill-over and U.S. code-following states | Short term (≤ 2 years) |
| High poisoning burden sustaining replacement demand | +1.7% | U.S. core, Canada urban belts, EU residential safety markets | Short term (≤ 2 years) |
| New housing completions and retrofitable installed base | +1.5% | U.S. core, EU retrofit zones, APAC upper-income urban corridors | Medium term (2-4 years) |
| Gas-fired appliance exposure in homes | +1.3% | EU, North America, cold-climate residential markets | Medium term (2-4 years) |
| Generator and outage risk driving premium detector uptake | +1.1% | U.S. hurricane and storm belts, Canada outage-prone regions | Short term (≤ 2 years) |
| Standards-led product upgrading and compliance refresh | +0.9% | EU core, North America certified-product channels | Long term (≥ 4 years) |
Restraint Analysis
Consumer inflation squeeze
Persistent household cost pressure is restraining discretionary and even semi-mandated replacement purchases, especially where consumers postpone upgrading from basic stand-alone units to premium sealed-battery or interconnected models. BLS reported U.S. CPI up 4.2% year over year in May 2026, with the energy index up 23.5%, electricity up 5.9%, shelter up 3.4%, food up 3.1%, and household furnishings and operations up 3.0%, creating a budget environment in which low-ticket safety products still face purchase deferral if not tightly enforced by code or landlord compliance.
Restraint Impact Analysis
| Restraint | (~) % Impact on CAGR Forecast | Geographic Relevance | Impact Timeline |
|---|---|---|---|
| Housing starts slowdown | -1.9% | North America core, especially U.S. new-build channels | Short term (≤ 2 years) |
| Consumer inflation squeeze | -1.6% | North America core, EU household budgets | Short term (≤ 2 years) |
| Battery and electronics tariff pass-through | -1.3% | U.S. core, China-linked supply chains, APAC export corridors | Medium term (2-4 years) |
| Recall and trust friction | -1.0% | North America e-commerce channels, EU certified-device markets | Medium term (2-4 years) |
| Retrofit non-compliance inertia | -0.9% | EU retrofit zones, U.S. rental stock, older housing markets | Long term (≥ 4 years) |
| Multifamily project volatility | -0.8% | U.S. multifamily corridors, urban Canada spill-over | Medium term (2-4 years) |
Opportunity Analysis
Electrification-transition cross-sell
Home electrification is often viewed as a long-term demand headwind for combustion-linked safety devices, but a nearer commercial opportunity exists in the transition period because many homes will remain mixed-fuel for years and require temporary or parallel safety coverage during appliance replacement cycles.
Federal electrification rebates have offered up to $14,000 per household, including up to $8,000 for heat pumps, $1,750 for heat-pump water heaters, $4,000 for electric panels, and $2,500 for wiring, yet Census still showed that in 2024, 94% of Midwest single-family homes built for sale used a forced-air furnace and 24% of attached homes sold in the South were heated with gas, meaning combustion exposure will not disappear immediately even as electrification capital enters the home.
Opportunity Impact Analysis
| Opportunity | (~) % Potential CAGR Upside | Geographic Relevance | Execution Window |
|---|---|---|---|
| Low-income housing grant bundles | +2.2% | North America core, U.S. public housing and municipal programs | Short term (≤ 2 years) |
| Digital-readout premiumization | +1.8% | North America core, EU safety-upgrade households | Short term (≤ 2 years) |
| Annual service-plan attachment | +1.6% | North America, EU retrofit and landlord portfolios | Medium term (2-4 years) |
| Multifamily retrofit roll-ups | +1.4% | U.S. urban corridors, Canada rental markets, EU retrofit zones | Medium term (2-4 years) |
| Generator-risk seasonal bundles | +1.2% | U.S. storm belts, Canada outage-prone provinces | Short term (≤ 2 years) |
| Electrification-transition cross-sell | +1.0% | U.S. rebate states, EU mixed-fuel homes | Long term (≥ 4 years) |
Challenges Analysis
Supply-chain and quality risk
Supply-chain and quality risk represent a continuous operational challenge rather than a hard restraint because the industry can still ship product,but faces ongoing volatility in input costs, import dependency, and recall exposure, especially for lower-priced alarms using commodity electronics and batteries. U.S. trade actions on active anode materials set antidumping duty rates above 90% and countervailing duty rates around 66.86% for certain Chinese exporters, and broader tariff policy has lifted non-EV lithium-ion battery duties from 7.5% to 25% in 2026, signaling a structurally more expensive and less predictable environment for battery-heavy safety devices even when finished alarms are not directly targeted.
Simultaneously, CPSC’s recall and enforcement activity, including CO- and smoke-alarm-related recalls and a 2025 order covering more than 400,000 hazardous products sold via online fulfillment channels, forces manufacturers to invest heavily in quality systems, supply-chain traceability, and pre-market testing to avoid severe reputational and financial damage if alarms underperform. These factors collectively create friction by increasing working capital needs, raising BOM costs, encouraging geographically diversified sourcing with longer lead times, and requiring continuous monitoring of supplier compliance, a situation that is unlikely to fully normalize within 2–4 years given ongoing trade and product-safety pressures.
Challenges Impact Analysis
| Challenge | (~) % CAGR Friction Drag | Geographic Relevance | Mitigation Horizon |
|---|---|---|---|
| Fragmented data visibility | -1.5% | North America core, EU public-health hubs | Long term (≥ 4 years) |
| Inconsistent code enforcement | -1.3% | U.S. states, Canadian provinces, EU local authorities | Long term (≥ 4 years) |
| Mixed-fuel housing complexity | -1.1% | North America, EU cold-climate regions | Medium term (2-4 years) |
| Supply-chain and quality risk | -1.0% | North America importers, APAC electronics corridors | Medium term (2-4 years) |
| Behavioural compliance fatigue | -0.9% | North America, EU, urban APAC | Long term (≥ 4 years) |
| Public-health signal volatility | -0.8% | U.S. and EU public-health systems | Medium term (2-4 years) |
Geopolitical Impact Analysis
Geopolitical Impact Analysis & Supply Chain Friction.
The Energy Feedstock Crisis is caused by steam methane reforming (SMR), which relies largely on natural gas. The extended conflict and ensuing sanctions have resulted in lasting structural alterations in energy pricing. European chemical hubs confront high localized production costs because they lack access to inexpensive pipeline gas. This has caused big industrial gas suppliers to strictly enforce energy cost pass-through provisions, raising the cost of merchant carbon monoxide.
In reaction to unpredictable natural gas markets, countries with large coal deposits, such as India and China, have advanced their domestic coal-to-chemical gasification infrastructure. This ensures a consistent, lower-cost feedstock reserve for carbon monoxide synthesis, minimizing the geopolitical shockwaves that have hit petroleum-dependent networks.
War-related trade barriers and sanctions imposed on major metal exporters have disrupted global steel manufacturing logistics. Because the metallurgical sector relies on captive carbon monoxide generation to reduce iron ore, regional steel output fluctuations have resulted in highly volatile regional demand pockets for large-scale gas utility companies.
High-precision semiconductor fabrication plants are experiencing significant supply friction for Grade 5.0 ultra-pure carbon monoxide. Escalating trade blacklists and maritime transportation bottlenecks in the South China Sea have limited the transshipment of specialty cylinders, prompting foundries to look for hyper-localized, on-site purifying options to minimize manufacturing delays.
Regional Analysis
Asia Pacific Held the Largest Share of the Global Carbon Monoxide Market.
The Asia Pacific carbon monoxide market is dominating, accounting for 44.8% of total market. The region is the key driver of global chemical synthesis and heavy metallurgical manufacture. Massive industrial corridors in China, India, Japan, and South Korea demand continuous, high-volume streams of synthesis gas. This localized need is driven by the global consolidation of the semiconductor industry, which relies significantly on ultra-pure carbon monoxide for sophisticated electronic chip etching.
North America has a highly integrated industry based on advanced chemical production and vast pipeline networks, which use low-cost, local shale gas to maximize steam methane reforming activities. Concurrently, Europe focuses its performance on high-efficiency specialized chemical production, despite tougher environmental emission penalties and fluctuating feedstock price, forcing a rapid shift toward carbon capture utilization and green bio-feedstocks.
Key Regions and Countries
- North America
- The US
- Canada
- Europe
- Germany
- France
- The UK
- Spain
- Italy
- Russia & CIS
- Rest of Europe
- APAC
- China
- Japan
- South Korea
- India
- ASEAN
- Rest of APAC
- Latin America
- Brazil
- Mexico
- Rest of Latin America
- Middle East & Africa
- GCC
- South Africa
- Rest of MEA
Key Players Analysis
The global carbon monoxide market has a highly concentrated, oligopolistic structure, with a small group of multinational chemical and engineering corporations controlling the great bulk of the market. Entry hurdles are extremely high due to the massive capital expenditures required to develop steam methane reforming (SMR) facilities, localized pipeline infrastructure, and complicated cryogenic gas separation systems.
Tier-1 players normally utilize long-term, over-the-fence captive supply contracts with big metallurgical and downstream chemical manufacturing facilities, which can tentatively last 15 to 20 years. This structural arrangement fosters intense strategic interdependence; pricing, output capacities, and regional expansion plans are highly transparent among the top competitors, who compete primarily on engineering efficiency, delivery purity, and localized network availability rather than spot-market pricing.
The Major Players In The Industry
- Air Liquide
- Linde plc
- Air Products and Chemicals, Inc.
- Praxair (part of Linde plc)
- Messer SE & Co. KGaA
- Taiyo Nippon Sanso Corporation
- Airgas, Inc. (an Air Liquide company)
- Nippon Gases / Nippon Sanso Holdings
- Gulf Cryo
- SIAD Group
- Celanese Corporation
- Sipchem Company
- American Gas Products
- Axcel Gases
- Air Water Inc.
- Other Key Players
Key Development
- In May 2026, Air Liquide agreed to a 12-year contract renewal with chemical company OXEA to supply synthesis gas and hydrogen in Oberhausen, Germany. Air Liquide is investing more than €20 million in upgrading its local Partial Oxidation operation, ensuring an annual supply of up to 340,000 tonnes for downstream carbonylation chemical lines.
- In March 2026, Celanese expanded customer supply agreements across Asia and Europe to support growing demand for acetyl products used in coatings, adhesives, packaging, and engineered materials. The company also continued investments in process optimization and low-carbon manufacturing initiatives at major production sites, improving efficiency in carbon monoxide-based chemical synthesis.
Report Scope
| Report Features | Description |
|---|---|
| Market Value (2025) | USD 4.8 Bn |
| Forecast Revenue (2035) | USD 9.7 Bn |
| CAGR (2026-2035) | 4.3% |
| Base Year for Estimation | 2025 |
| Historic Period | 2020-2024 |
| Forecast Period | 2026-2035 |
| Report Coverage | Revenue Forecast, Market Dynamics, Competitive Landscape, Recent Developments |
| Segments Covered | By Application (Electronics, Metal fabrication, Chemicals, Pharmaceuticals & biotechnology, Meat coloring & preservative / F&B, Others), By Purity (Below 99% , 99% and above), By Product (Compressed gas , Gas mixtures , Bulk / on‑site generation) |
| Regional Analysis | North America – The US & Canada; Europe – Germany, France, The UK, Spain, Italy, Russia & CIS, Rest of Europe; APAC– China, Japan, South Korea, India, ASEAN & Rest of APAC; Latin America– Brazil, Mexico & Rest of Latin America; Middle East & Africa– GCC, South Africa, & Rest of MEA |
| Competitive Landscape | Air Liquide, Linde plc, Air Products and Chemicals Inc., Praxair (part of Linde plc), Messer SE & Co. KGaA, Taiyo Nippon Sanso Corporation, Airgas Inc. (an Air Liquide company), Nippon Gases / Nippon Sanso Holdings, Gulf Cryo, SIAD Group, Celanese Corporation, Sipchem Company, American Gas Products, Axcel Gases, Air Water Inc., and Other Players. |
| Customization Scope | Customization for segments, region/country-level will be provided. Moreover, additional customization can be done based on the requirements. |
| Purchase Options | We have three licenses to opt for: Single User License, Multi-User License (Up to 5 Users), Corporate Use License (Unlimited Users and Printable PDF) |


