


Report Overview
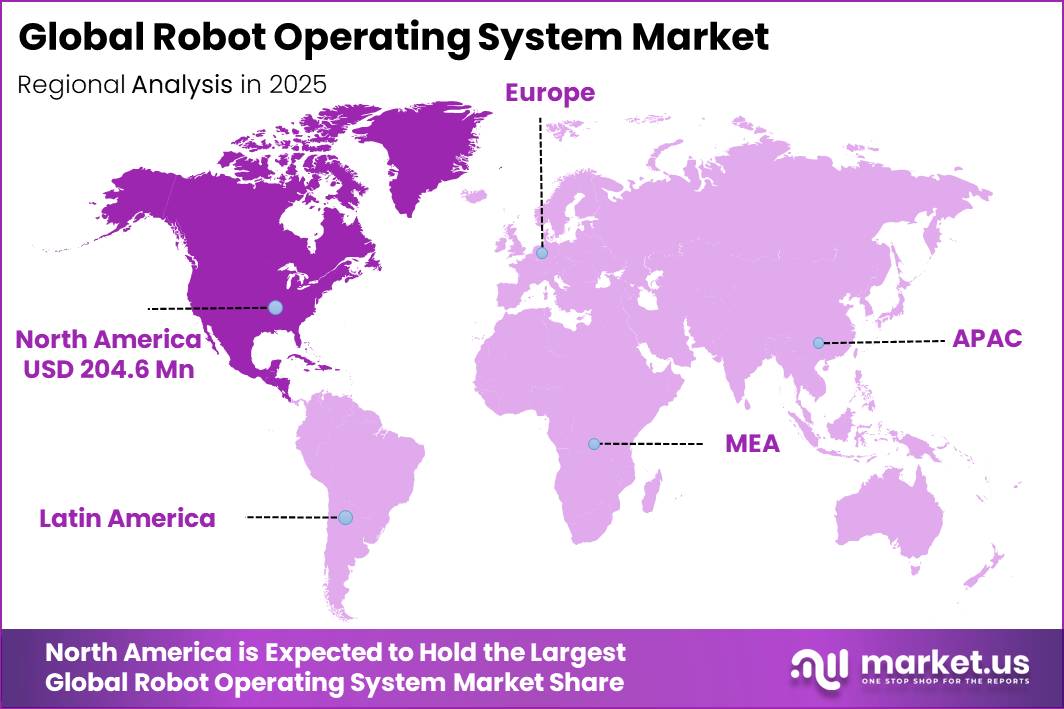
In 2025, the Global Robot Operating System Market was valued at USD 626.5 million. The market is projected to grow at a CAGR of 11.4% during 2026–2035, reaching approximately USD 1,843.9 million by 2035. North America dominated the global market in 2025, accounting for more than 32.6% of the total market share and generating approximately USD 204.6 million in revenue.
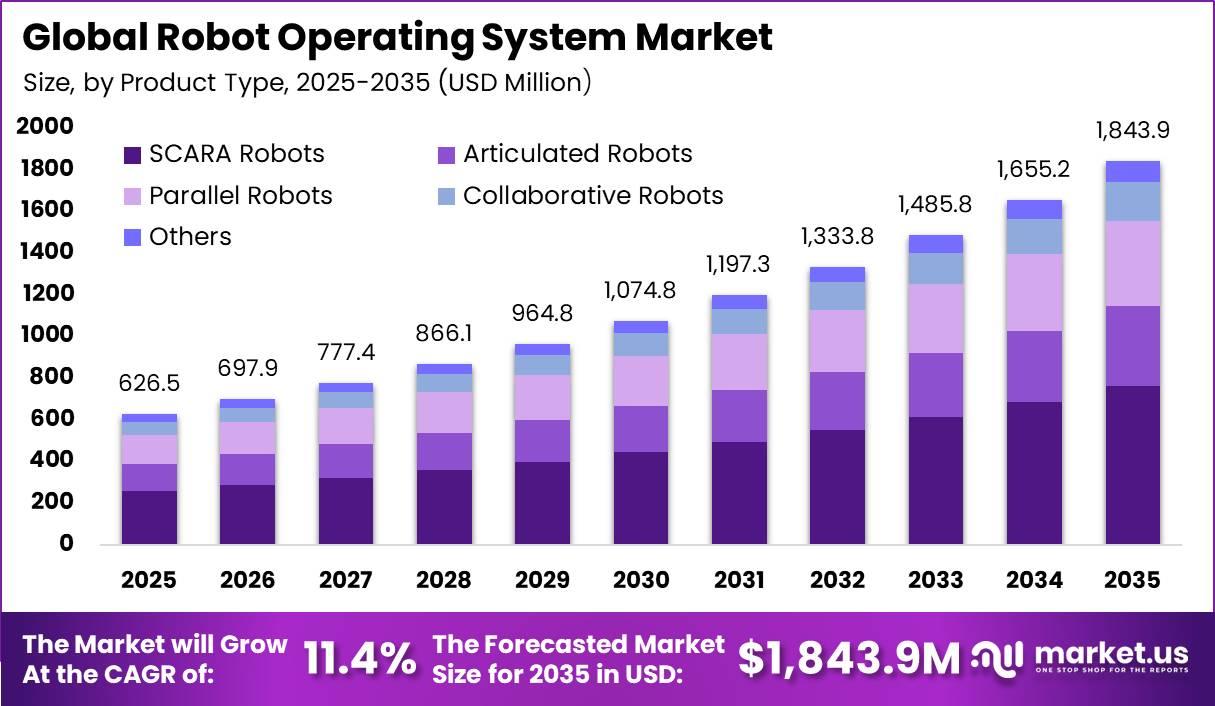
This represents an absolute increase of nearly USD 1,217.4 million. Market growth is being supported by rising robot deployment across manufacturing, warehouses, logistics, healthcare, and research. According to the International Federation of Robotics (IFR), 542,076 industrial robots were installed worldwide in 2024, more than double the level recorded 10 years earlier.
The global operational stock reached 4.664 million robots, increasing 9% year on year. Professional service robot sales also exceeded 199,000 units, up 9%, while transportation and logistics robots reached 102,900 units, increasing 14% and representing more than half of professional service-robot sales.
These developments are strengthening demand for ROS-based motion control, navigation, machine vision, simulation, sensing, and communication systems. The Americas installed 50,077 industrial robots in 2024, remaining above 50,000 units for the fourth consecutive year. The United States accounted for 34,164 units, or 68% of regional installations, with an operational stock of 393,700 robots, up 3%.
U.S. automakers installed about 13,700 robots, increasing 10.7% and representing nearly 40% of national installations. Robot installations increased another 11% to around 38,000 units in 2025, while U.S. retail e-commerce sales reached USD 340.2 billion in Q2 2026, rising 3.8% quarter-on-quarter and supporting greater warehouse automation.
Key Takeaway
- The Robot Operating System Market was valued at USD 626.5 million in 2025 and is projected to reach USD 1,843.9 million by 2035, growing at a CAGR of 11.4%.
- The SCARA robot segment led by robot type with a 41.3% share, driven by electronics and semiconductor assembly demand.
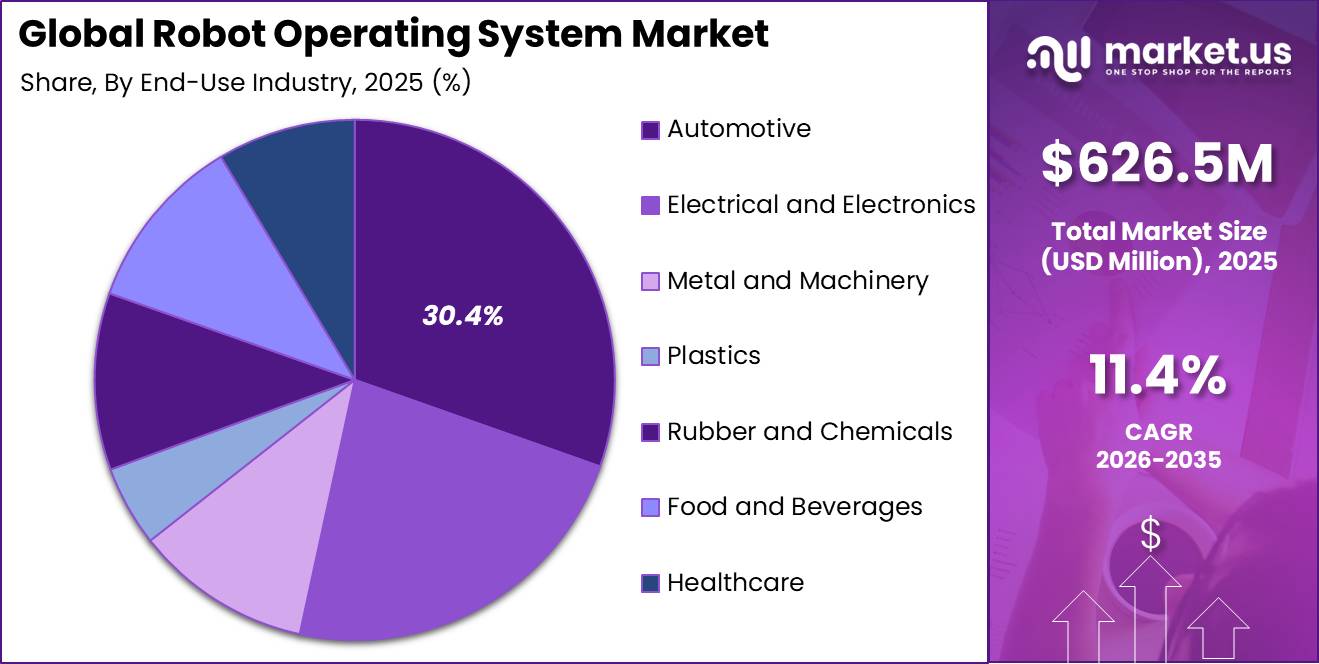
- The Automotive segment led by end-use industry with a 30.4% share, supported by rising vehicle and EV production.
- North America led the market in 2025 with a 32.6% share and approximately USD 204.6 million in revenue.
Market Statistics and Data Insights
- Asia accounted for 74% of new installations, compared with 16% in Europe and 9% in the Americas. China alone installed 295,045 robots, up 7%, representing 54% of worldwide installations. These deployments directly expand demand for robot programming, motion control, sensing, visualization, simulation, and multi-vendor integration software.
- Professional service-robot sales reached almost 200,000 units in 2024, increasing 9%. Transportation and logistics accounted for 102,900 units, up 14%, meaning more than 50% of professional service robots were used for movement and handling of goods.
- The International Energy Agency reported that 17.3 million electric cars were manufactured worldwide in 2024, approximately 25% more than in 2023. China produced 12.4 million, representing more than 70% of global EV production.
- Global EV sales then exceeded 20 million units in 2025, growing 20%, with electric vehicles representing around 25% of all new-car sales. Higher EV volumes support robotic battery handling, dispensing, welding, inspection, material movement, and machine-vision applications where ROS-compatible software can be used.
- SEMI reported that global semiconductor manufacturing-equipment sales reached USD 135.1 billion in 2025, increasing 15% from USD 117.1 billion in 2024. Test-equipment sales increased 55%, while assembly and packaging equipment rose 21%. Taiwan’s equipment spending increased 90% to USD 31.5 billion, while Korea increased 26% to USD 25.8 billion.
- ROS 1 packages were still downloaded 11.59 million times in October 2025, showing that legacy use has not disappeared. Separately, a ROS hardware database covering 34 robot-arm brands found that about 85% had ROS 2 support, meaning roughly 15% still lacked ROS 2 drivers; only around 76% of available drivers were supported directly by robot vendors.
- FANUC has also stated that some industrial robots have an average service life exceeding 30 years, explaining why old controllers can remain in factories for decades.
- IFR reported that the overall Robot-as-a-Service fleet expanded 31% in 2024. In transportation and logistics specifically, RaaS adoption increased 42%.
- Worldwide medical-robot sales increased 91% to around 16,700 units in 2024. Rehabilitation and non-invasive therapy robot sales increased 106%, surgical robot demand grew 41%, and robots for diagnostics and medical laboratory analysis increased 610%.
- NVIDIA reported that more than 250,000 robotics developers worldwide use the broader robotics ecosystem it serves. Its Physical AI Dataset had been downloaded more than 4.8 million times, Cosmos Reason more than 1 million times, and Cosmos world foundation models more than 3 million times by late 2025.
- Open Robotics reported 984,135,185 ROS package downloads in 2025, an increase of 85.18% from 2024. More than 1.315 million unique users/IPs downloaded ROS packages in October 2025, up nearly 56% from 843,959 one year earlier. ROS 2 represented 91.2% of all downloads, compared with about 72% in October 2024. ROS Humble represented 48.53% and Jazzy 24.45% of downloads.
- The ROS 2 GitHub organization recorded an 11.2% increase in contributors and a 37.59% rise in pull requests in 2025. Public repositories tagged “ROS2” reached 3,848, increasing 39%, while the ROS ecosystem contained 34,614 unique packages, up 9.15%. The number of identified companies using ROS increased 26% to 1,579 companies. These figures provide direct evidence of expanding commercial and developer participation.
By Robot Type
The SCARA Robot segment accounted for a leading 41.3% share of the Robot Operating System market, supported by its strong use in electronics, semiconductors, consumer devices, and small-parts assembly. SCARA robots typically operate with 4 controlled axes and a rigid horizontal arm, making them suitable for high-speed pick-and-place, screwdriving, dispensing, testing, and precision assembly in compact production areas.
ROS helps coordinate robot movement, machine vision, conveyor timing, force sensors, inspection cameras, and manufacturing execution systems. According to the International Federation of Robotics, electrical and electronics became the largest industrial robot end-use sector again in 2024, while China installed 295,000 industrial robots, representing a 7% increase.
The Semiconductor Industry Association reported that global semiconductor sales reached USD 630.5 billion in 2024, increasing 19.1% from USD 526.8 billion in 2023. Semiconductor sales were further projected to reach USD 701 billion in 2025. As chip and electronics production expands, manufacturers increasingly require accurate and fast handling of small components.
By End-Use Industry
The Automotive segment accounted for a 30.4% share of the Robot Operating System market, supported by the high level of automation required across vehicle manufacturing. Automotive plants use robots for body welding, painting, battery assembly, powertrain production, final assembly, inspection, and material handling, where speed, accuracy, and repeatability are essential.
According to the International Organization of Motor Vehicle Manufacturers (OICA), global motor-vehicle production increased from 92.7 million units in 2024 to 96.4 million units in 2025, representing growth of 3.9%. Worldwide vehicle sales also increased 4.7% to 99.8 million units.
The International Energy Agency reported that 17.3 million electric cars were produced in 2024, around 25% more than in 2023, while global electric-car sales are expected to exceed 20 million units in 2025. ROS supports battery handling, inspection, adhesive dispensing, assembly, and high-voltage quality checks by connecting robots with cameras, sensors, production controls, and Robot-as-a-Service tools, helping manufacturers improve automation flexibility and production efficiency.
Key Market Segments
By Robot Type
- SCARA Robots
- Articulated Robots
- Parallel Robots
- Collaborative Robots
- Others
By End-Use Industry
- Automotive
- Electrical and Electronics
- Metal and Machinery
- Plastics
- Rubber and Chemicals
- Food and Beverages
- Healthcare
- Others
Geopolitical Impact Analysis
Geopolitical disruption is increasing both the cost and supply risk of Robot Operating System (ROS) deployments because ROS-enabled robots depend on globally sourced controllers, servo motors, industrial computers, cameras, LiDAR systems, semiconductors, cables, and rare-earth magnets.
According to UN Trade and Development (UNCTAD), Gulf of Aden vessel tonnage had fallen 76% by mid-2024, while Suez Canal tonnage declined 70% as shipping companies avoided the Red Sea. At the same time, arrivals around the Cape of Good Hope increased 89%. This rerouting added roughly 10 days to two weeks to journeys between the Far East and Northwest Europe.
UNCTAD also reported that Shanghai–Northern Europe container freight rates increased 256% to USD 2,648 per TEU by 9 February 2024, while the China Containerized Freight Index rose 120% between October 2023 and June 2024. These disruptions can delay robot hardware, sensors, spare parts, and computing equipment while increasing freight, insurance, fuel, and inventory costs.
Supply concentration in strategic minerals creates an additional challenge. The International Energy Agency reported that China was the leading refiner for 19 of 20 strategic minerals assessed, holding an average 70% market share. China also accounted for around 91% of global rare-earth separation and refining in 2024.
Minerals such as neodymium, praseodymium, dysprosium, and terbium are important for high-performance magnets used in servo motors and robotic actuators. Export restrictions, tariffs, or regional conflicts can therefore increase component costs and slow robot deployment, supporting greater use of simulation, remote testing, modular ROS platforms, and alternative local hardware sources.
Regional Analysis
North America dominated the global Robot Operating System (ROS) market in 2025, accounting for 32.6% of total revenue and generating approximately USD 204.6 million. The region’s strong position is supported by high factory automation, a mature industrial software ecosystem, and wide ROS use across automotive, aerospace, electronics, medical devices, logistics, and warehousing.
According to the International Federation of Robotics (IFR), North America recorded 204 industrial robots per 10,000 manufacturing employees in 2024. The United States led with 307 robots per 10,000 employees, followed by Canada with 241 robots and Mexico with 62 robots. This high robot density increases demand for ROS platforms that connect robotic arms, autonomous mobile robots, cameras, sensors, grippers, controllers, and factory-management systems.
Asia Pacific is expected to be the fastest-growing region, supported by its strong electronics, semiconductor, automotive, battery, and export manufacturing base. IFR reported that Asia represented 74% of global robot installations in 2024, compared with 16% for Europe and 9% for the Americas.
China installed 295,000 robots, equal to 54% of global installations, while its operational stock reached 2.02 million units. Japan installed 44,500 robots, while India installed 9,120 units, up 7%, taking its stock to 52,570 units. South Korea recorded 1,012 robots per 10,000 manufacturing employees, while China reached 470 units, supporting strong demand for scalable ROS-based automation.
Key Regions and Countries
North America
- US
- Canada
Europe
- Germany
- France
- The UK
- Spain
- Italy
- Rest of Europe
Asia Pacific
- China
- Japan
- South Korea
- India
- Australia
- Rest of APAC
Latin America
- Brazil
- Mexico
- Rest of Latin America
Middle East & Africa
- GCC
- South Africa
- Rest of MEA
Market Dynamics
Drivers
| Driver | (~) % CAGR | Geographic Relevance | Impact Timeline |
|---|---|---|---|
| Factory robot fleet expansion | +2.4% | Global; strongest in Asia Pacific | Short term (2 years or less) |
| AI-enabled robot software demand | +1.8% | North America, Europe, East Asia | Medium term (2 to 4 years) |
| Electric vehicle production automation | +1.5% | China, Europe, North America | Medium term (2 to 4 years) |
| Semiconductor fab automation | +1.3% | East Asia, United States, Europe | Medium term (2 to 4 years) |
| Warehouse robotics deployment | +1.1% | North America, Europe, Asia Pacific | Short term (2 years or less) |
| Robot simulation adoption | +0.8% | Global | Medium term (2 to 4 years) |
Factory robot fleet expansion
Factory robot fleet expansion remains the strongest growth driver for the ROS market, as every new robot requires software for motion control, vision, sensing, safety, simulation, and plant integration. According to the International Federation of Robotics, global robot installations reached 542,076 units in 2024, while the operational stock increased 9% to 4.6 million units.
Asia accounted for 74% of installations, with China installing 295,000 units and operating 2.02 million robots. Automation demand is also rising across electric vehicles and semiconductor production. The International Energy Agency reported global electric-car production of 17.3 million units in 2024, while SEMI projected semiconductor manufacturing equipment sales of USD 125.5 billion in 2025.
These industries require advanced assembly, inspection, and material-handling automation, supporting greater use of ROS for simulation, upgrades, integration, and fleet management. This expansion could contribute an estimated +2.4% upside to the market’s 11.4% baseline CAGR.
Restraints
| Restraint | (~) % CAGR | Geographic Relevance | Impact Timeline |
|---|---|---|---|
| High integration project costs | -1.7% | Global; strongest among small manufacturers | Short term (2 years or less) |
| Capital spending delays | -1.3% | Europe, North America, emerging markets | Short term (2 years or less) |
| Industrial hardware tariffs | -1.1% | United States, China, Europe | Medium term (2 to 4 years) |
| Fragmented controller standards | -0.9% | Global | Medium term (2 to 4 years) |
| Cybersecurity procurement barriers | -0.7% | North America, Europe, Japan | Medium term (2 to 4 years) |
| Small enterprise adoption limits | -0.6% | Global | Short term (2 years or less) |
High integration project costs
High integration costs remain a major restraint for the ROS market because customers must invest in robots, sensors, cameras, edge computers, safety equipment, system integration, training, and commissioning.
UN Trade and Development reported that Shanghai–Northern Europe container freight rates reached USD 2,648 per TEU by February 2024, increasing 256%, while Red Sea rerouting added around 10 days to 2 weeks to Far East–Northwest Europe shipping journeys.
Supply concentration further increases project costs and lead times. The International Energy Agency reported that China controlled around 91% of rare-earth separation and refining capacity in 2024, creating supply risks for robot motors and precision actuators.
The World Trade Organization also tracks tariff measures across more than 170 economies, showing the broad exposure of imported automation equipment to trade changes. Together, these pressures can delay automation projects and are estimated to create a -1.7% drag on the baseline CAGR.
Challenges
| Challenge | (~) % CAGR | Geographic Relevance | Mitigation Horizon |
|---|---|---|---|
| Interoperability across robot fleets | -1.5% | Global | Long term (4 years or more) |
| Robotics software talent shortage | -1.2% | Global; acute in emerging markets | Medium term (2 to 4 years) |
| Edge compute performance limits | -1.0% | Global | Medium term (2 to 4 years) |
| Safety validation complexity | -0.9% | Europe, North America, Japan | Long term (4 years or more) |
| Industrial data governance | -0.7% | Europe, North America, China | Medium term (2 to 4 years) |
| Legacy equipment connectivity | -0.6% | Global manufacturing centers | Long term (4 years or more) |
Interoperability across robot fleets
Interoperability across mixed robot fleets remains a major challenge for the ROS market, as manufacturers often use legacy controllers, proprietary robot systems, autonomous mobile robots, cameras, and safety equipment with different software interfaces.
Manufacturers therefore need continued investment in middleware, APIs, digital twins, safety validation, and cybersecurity testing. These interoperability and compliance costs are estimated to create a -1.5% friction drag on the market’s attainable growth ceiling.
Opportunities
| Opportunity | (~) % CAGR | Geographic Relevance | Execution Window |
|---|---|---|---|
| Robotics software subscription models | +2.0% | Global | Medium term (2 to 4 years) |
| Healthcare robot platform expansion | +1.6% | North America, Europe, East Asia | Long term (4 years or more) |
| Small factory automation tools | +1.4% | India, Southeast Asia, Latin America | Medium term (2 to 4 years) |
| Autonomous construction robotics | +1.1% | North America, Europe, Gulf states | Long term (4 years or more) |
| Agricultural robotics deployment | +1.0% | North America, Europe, Asia Pacific | Long term (4 years or more) |
| Open-source support services | +0.8% | Global | Short term (2 years or less) |
Robotics software subscription models
Robotics software subscriptions offer a strong growth opportunity as many ROS deployments still rely on one-time engineering projects instead of recurring services for simulation, fleet management, remote diagnostics, security updates, and analytics. Moving from project-based software sales toward subscriptions could lower customer upfront costs, strengthen recurring revenue, and provide an estimated +2.0% upside to the baseline CAGR.
Key Players Analysis
The Robot Operating System (ROS) market is led by Tier-1 automation and industrial software companies including ABB, FANUC, Yaskawa Electric, KUKA, Omron, Microsoft, and DENSO. Together, these companies are estimated to represent around 55%–65% of ROS-related enterprise spending. ABB generated USD 33.2 billion in 2025 revenue and invested USD 1.3 billion in R&D, equal to 4.0% of revenue.
KUKA reported EUR 3.89 billion in 2025 revenue, EUR 4.157 billion in orders, and EUR 213.2 million in R&D spending, up EUR 10.9 million from 2024. FANUC’s Robot division generated JPY 378.61 billion in fiscal 2025, rising 14.9% and representing 44.1% of company revenue. Microsoft recorded USD 281.724 billion in fiscal 2025 revenue, including USD 168.9 billion from Microsoft Cloud, while R&D spending reached USD 32.48 billion, or 12% of revenue.
Yaskawa’s Robotics segment generated JPY 247.01 billion in fiscal 2025, up 4.0%, representing 46% of revenue, with JPY 20.41 billion in operating profit. It planned JPY 58.0 billion in fiscal 2026 capital spending and JPY 250.0 billion in cumulative investment, including JPY 130.0 billion in capital expenditure and JPY 120.0 billion in strategic investments.
Omron reported JPY 360.8 billion in FY2024 automation sales, JPY 21.6 billion in R&D, JPY 6.1 billion in capital expenditure, and 4,290 automation customers. DENSO generated JPY 7.1 trillion in FY2025 revenue and planned JPY 660.0 billion in FY2026 R&D, around JPY 40.0 billion higher than the previous year.
Tier-2 specialists, including Wind River, Clearpath Robotics, Husarion, Brain Corporation, Neobotix, Universal Robots, and iRobot, are estimated to hold around 15%–25% of ROS-related market value. These companies focus on autonomous robots, collaborative systems, fleet management, and ROS-compatible platforms. iRobot reported USD 681.8 million in fiscal 2024 revenue and USD 93.28 million in R&D spending, while revenue declined 23.4% from USD 890.6 million in 2023.
Top Key Players in the Market
- Microsoft Corporation
- KUKA AG
- Wind River Systems Inc.
- Clearpath Robotics
- Husarion Inc.
- Brain Corporation
- Neobotix GmbH
- Universal Robotics
- ABB Ltd.
- FANUC
- Yaskawa Electric Corporation
- Denso
- Omron Corporation
- iRobot Corporation
Recent Developments
- In 2026, Tennant Company and Brain Corp extended their robotics partnership for 3 years to accelerate next-generation autonomous floor-cleaning systems. The companies plan to introduce 10 new robotic products within 24 months, expanding the use of BrainOS-based AI, navigation, autonomy, and fleet-management software across commercial cleaning applications.
- In 2025, ABB signed an agreement to sell its Robotics division to SoftBank Group for USD 5.37 billion. ABB initially expected approximately USD 5.3 billion in cash proceeds, a USD 2.4 billion pre-tax book gain, and around USD 200 million in separation costs.
Report Scope
| Report Features | Description |
|---|---|
| Market Value (2025) | USD 626.5 million |
| Forecast Revenue (2035) | USD 1,843.9 million |
| CAGR (2026-2035) | 11.4% |
| Base Year for Estimation | 2025 |
| Historic Period | 2020-2024 |
| Forecast Period | 2026-2035 |
| Report Coverage | Revenue Forecast, Market Dynamics, Competitive Landscape, Recent Developments |
| Segments Covered | By Robot Type (SCARA Robots, Articulated Robots, Parallel Robots, Collaborative Robots, Others), By End-Use Industry (Automotive, Electrical and Electronics, Metal and Machinery, Plastics, Rubber and Chemicals, Food and Beverages, Healthcare, Others) |
| Regional Analysis | North America – US, Canada; Europe – Germany, France, The UK, Spain, Italy, Rest of Europe; Asia Pacific – China, Japan, South Korea, India, Australia, Singapore, Rest of APAC; Latin America – Brazil, Mexico, Rest of Latin America; Middle East & Africa – GCC, South Africa, Rest of MEA |
| Competitive Landscape | Microsoft Corporation, KUKA AG, Wind River Systems Inc., Clearpath Robotics, Husarion Inc., Brain Corporation, Neobotix GmbH, Universal Robotics, ABB Ltd., FANUC, Yaskawa Electric Corporation, Denso, Omron Corporation, iRobot Corporation |
| Customization Scope | Customization for segments, region/country-level will be provided. Moreover, additional customization can be done based on the requirements. |
| Purchase Options | We have three licenses to opt for: Single User License, Multi-User License (Up to 5 Users), Corporate Use License (Unlimited Users and Printable PDF) |





























