
Quick Navigation
Report Overview
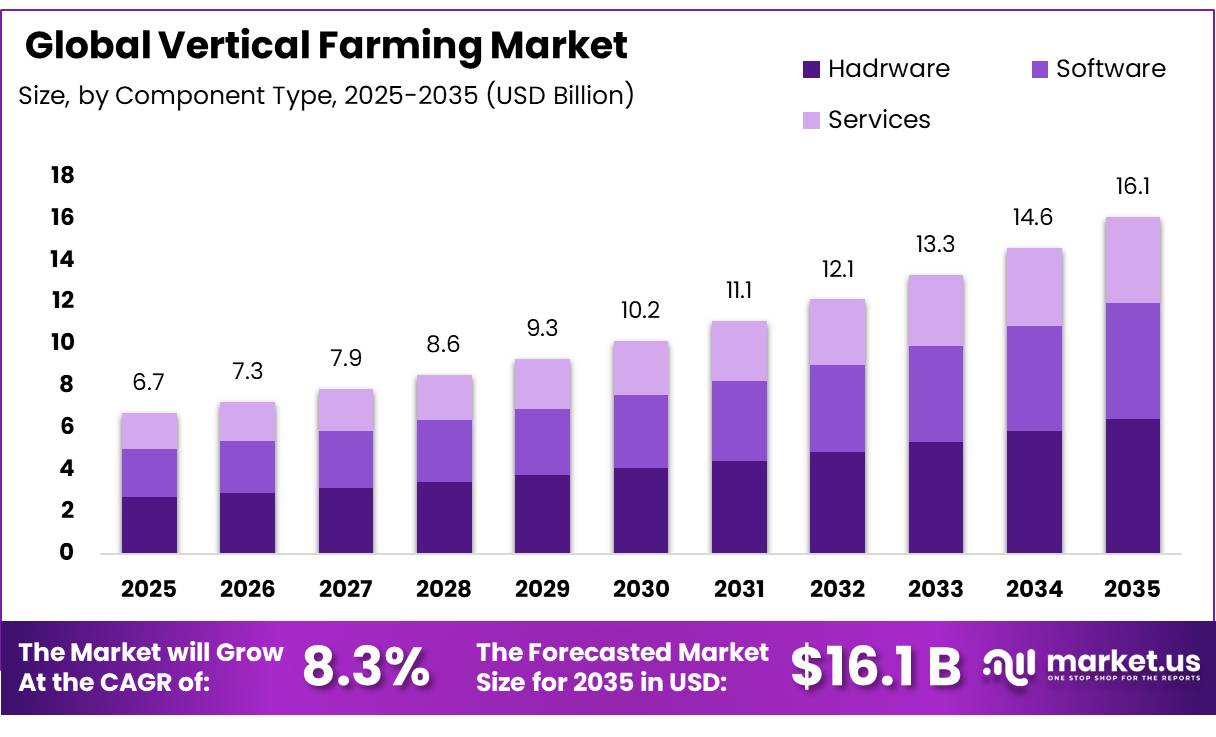
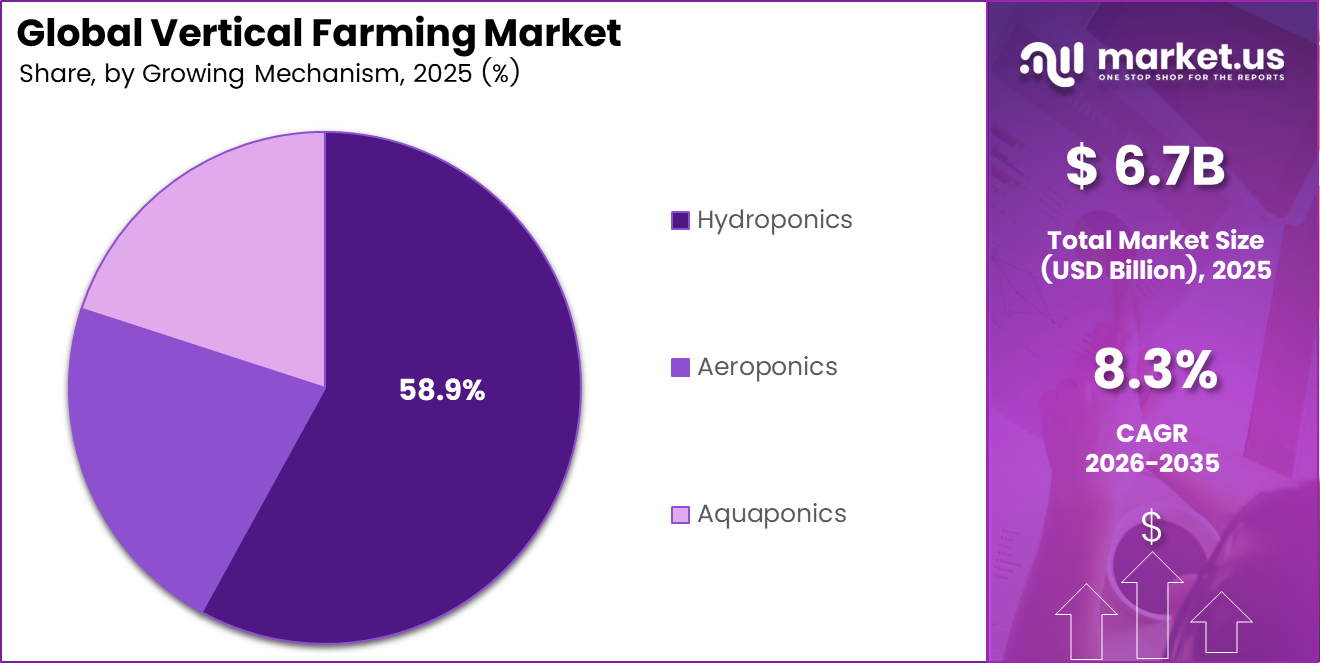
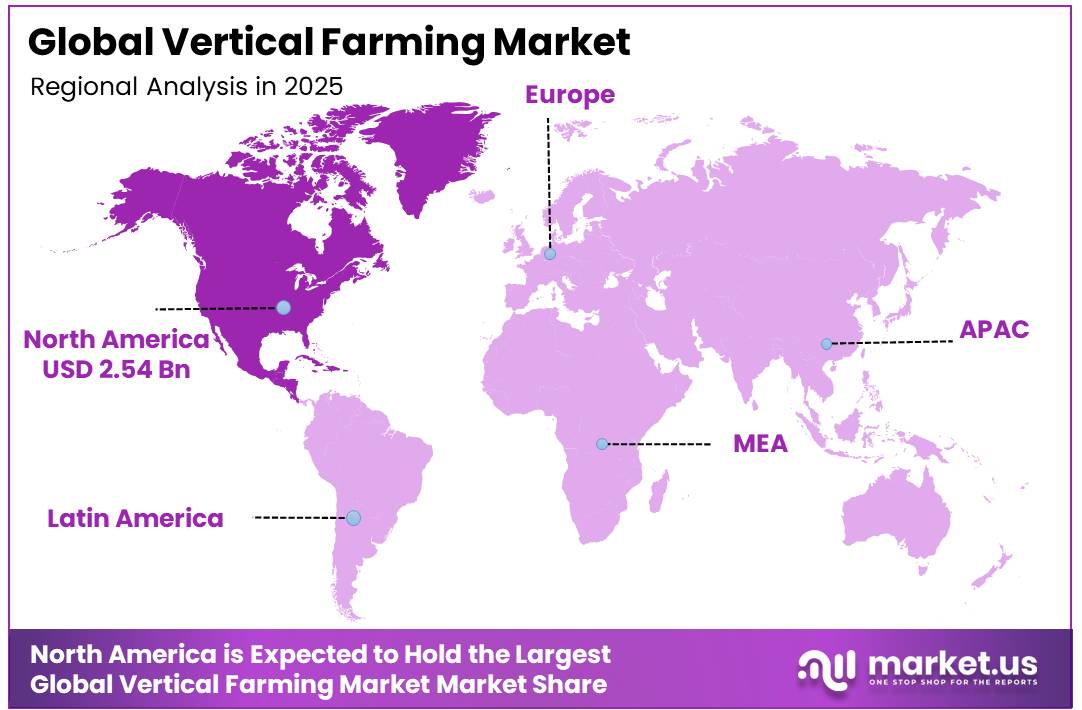
The Global Vertical Farming Market was valued at USD 6.7 billion, and between 2026 and 2035, this market is estimated to register a CAGR of 8.3%, reaching about USD 16.1 billion by 2035. In 2025, North America led the market, achieving over 37.9% share with a revenue of USD 2.5 billion.
The growth of the global vertical farming market is driven by changes in urban food security, unpredictable weather patterns, and limited natural resources. The main reason for the market’s growth is the quick rise in urban areas and the decreasing amount of usable farmland worldwide. Key factors pushing the industry forward include government rules that require secure local food supply chains and the rising costs of energy.
- According to 2025 data tracked by the U.S. Department of Energy (DOE), advanced commercial vertical farms have reduced localized lighting power footprints down to 15 Watts per square foot due to modern high-efficiency LED arrays exceeding 3.2 µmol/J efficiency. Even with these technological updates, electricity stays highly volatile, accounting for up to 40% of ongoing operational expenses (OpEx). This ongoing risk explains why hardware infrastructure captured 40.1% of global facility investment in 2025.
The market scope is technically characterized by developments in growing technique divisions, including hydroponics, aeroponics, and aquaponics, as well as scalable capacity designs ranging from localized modular shipping containers to industrial warehouse structures. Hydroponics remains the primary technical baseline due to water optimization, while aeroponic system adoption is quickly increasing.
The fastest-growing demand drivers are industrial decarbonization laws, urban real estate reclamation, and the removal of post-harvest logistical emissions. The future market forecast is dependent on the close integration of artificial intelligence (AI) algorithms, Internet of Things (IoT) edge sensors, and computer vision systems. This digital maturity converts ordinary facilities into autonomous bioreactors that dynamically adjust microclimate parameters.
Key Takeaways
- The global vertical farming market was valued at US$6.7 billion in 2025.
- The global vertical farming market is projected to grow at a CAGR of 8.3% and is estimated to reach US$16.1 billion by 2035.
- The Hardware segment dominates the component market with a 40.1% market share, driven by heavy upfront capital requirements for LEDs, HVAC, and automated systems.
- Hydroponics is the primary growing mechanism, commanding a clear majority share of 58.9% due to its established commercial reliability and efficient water loops.
- The Fruits, Vegetables, & Herbs crop category overwhelmingly leads the market at 72.2%, fueled by retail and consumer demand for local, fresh produce.
- Building-Based Vertical Farms remain the dominant structure type at 64.7%, driven by massive urban facility rollouts and higher volume output.
- North America is still the top market, with a 37.9% share. This is due to early use in commercial farming, a lot of investment from venture capital, and well-developed systems for delivering products to stores in cities.
Component Analysis
Hardware components lead the market segment over software and services.
In 2025, the Hardware category dominated the market, accounting for 40.1%. This dominance is fueled by the high initial capital costs required to engineer, purchase, and install the physical subsystems required to sustain controlled-environment agriculture (CEA) ecosystems.
This extensive baseline allocation includes solid-state lighting arrays, climate control frameworks, multi-tier racking configurations, automatic fertigation loops, and specialized sensor topologies. The physical underpinning of indoor horticulture necessitates significant upfront asset investment to create isolated microclimates capable of mitigating external environmental changes.
The Services segment, specifically Farming-as-a-Service (FaaS) and remote agronomic advising, is expected to grow between 2030 and 2035. This marketplace transformation is transforming vertical farming from a pure real estate and technology play to an outsourced, operational utility business.
Growing Mechanism Analysis
Hydroponics captures the majority of the vertical farming market.
In 2025, the Hydroponics category dominated the market, accounting for 58.9%. This supremacy stems from its long-standing operating stability, well-documented engineering standards, and demonstrated ability to deliver extremely accurate, water-dissolved nutrient formulations directly to the root zones of dense plant populations in the absence of soil.
Commercial arrangements use inert substrates such as rockwool, coco coir, or polyurethane foams to attach root structures while ensuring appropriate moisture-to-oxygen ratios. This technology serves as the technological foundation for modern commercial indoor production due to its predictable output measures.
The leadership of hydroponics is reinforced by low technical barriers to entry for facility laborers, highly standardized mechanical plumbing components, and significantly reduced biological operational risks relative to unproven methodologies. Financial institutions and venture capital funds show a clear preference for funding hydroponic systems due to their mature historical data, predictable crop yields, and easily calculable return on investment (ROI) metrics when scaling massive urban facilities.
Crop Type Analysis
Fruits, vegetables, and herbs dominate vertical farming crop production.
The Fruits, Vegetables, and Herbs section dominated the market, accounting for 72.2%. This dominance is driven by year-round urban demand for local, pesticide-free fresh produce, which the Food and Agriculture Organization (FAO) tracks across global supply chains. Mass production lines for loose-leaf lettuces, culinary herbs, and microgreens are the primary revenue generators for almost all big industrial facilities.
Short vegetative growth cycles, quick crop turnarounds, and compact plant layouts increase per-square-foot revenue velocity to meet retail delivery timeframes. The Flowers & Ornamentals section is poised for the fastest growth as operators diversify away from crowded salad green markets.
Specialist urban agriculture programs report an increase in high-value edible flowers for the luxury culinary and hotel markets. Growth is being driven by increasing cosmetic extraction needs and urban biophilic design trends, which fetch premium wholesale pricing, according to USDA floriculture trade statistics.
Structure Analysis
Building-based structures lead global vertical farming deployment.
The Building-Based Vertical Farms segment dominated the market with a 64.7% share. This supremacy stems from the ability of renovated warehouses, decommissioned factories, and custom multi-story complexes to optimize vertical stacking height and achieve economies of scale, as defined by the United States Environmental Protection Agency (EPA).
The Shipping-Container Vertical Farms industry is growing due to its decentralized, “plug-and-play” model. For example, disaster relief logistics briefs from emergency management agencies show that 40-foot insulated freight container modifications are becoming more common in difficult temperature zones.
Drawing on NIST-verified modular building rules, drivers include inexpensive initial capital costs and the ability to drop self-contained modules onto island settlements or tight urban areas without cumbersome zoning approvals.
Key Market Segments
By Component
- Hardware
- Software
- Services
By Growing Mechanism
- Aeroponics
- Hydroponics
- Aquaponics
By Crop Category
- Fruits, Vegetables, & Herbs
- Flowers & Ornamentals
By Structure
- Building-Based Vertical Farms
- Shipping-Container Vertical Farms
Opportunity Analysis
High-value berry & tomato scale-up
This represents a growth opportunity rather than a current market driver, as vertical farming remains concentrated in leafy greens and herbs. Strawberries and tomatoes are promising crops, but they have not yet reached full commercial scale. Capturing even 1%–2% of premium urban demand could significantly expand the revenue base, particularly as these crops may achieve selling prices 2–4 times higher than commodity lettuce and improve gross margins by 600–1,100 basis points once production stabilizes.
Vertical systems can produce 10–20 times more yield per acre than open-field farming for suitable crops while reducing weather-related risks. Expanding into high-value fruiting crops could add an estimated 2.8 percentage points to sector CAGR by 2035, especially across Japan, the Gulf, North America, and Europe, where import substitution, freshness premiums, and pesticide-light production support higher capital investment.
Opportunities impact
| Opportunity | (~) % Potential CAGR Upside | Geographic Relevance | Execution Window |
|---|---|---|---|
| High-value berry & tomato scale-up | +2.8% | North America, Japan, the Gulf, EU | Medium term (2-4 years) |
| Retail-to-foodservice platform shift | +1.9% | North America core, UK, EU, developed APAC | Short term (≤ 2 years) |
| Energy-linked farm monetization | +2.2% | EU, Nordics, North America, Japan | Medium term (2-4 years) |
| Emerging-market modular microfarms | +2.5% | India, Southeast Asia, the Middle East, and Africa’s urban hubs | Medium term (2-4 years) |
| Genetics, IP & licensing layer | +1.6% | Global, led by the U.S., the EU, Japan, and Israel | Long term (≥ 4 years) |
| Distressed asset roll-up & retrofit | +2.1% | U.S., UK, Nordics, Western Europe | Short term (≤ 2 years) |
Challenges Analysis
Power Cost Volatility
Vertical farming’s main operating restraints in 2026 are lighting, cooling, dehumidification, pumping, and automation, which depend heavily on purchased electricity. Energy can account for up to 40% of operating costs, compared with about 25% in 2021 for some operators. A 15%–25% increase in industrial electricity tariffs may raise harvested-unit costs by 6%–10% and extend project payback periods by 12–24 months.
Operators often respond by reducing lighting intensity, slowing crop cycles, or limiting climate control during peak-price periods, which lowers productivity and market growth. Long-term mitigation includes renewable-power contracts, heat recovery, dynamic lighting systems, lower-cost locations, and improved crop scheduling. However, these measures generally require 24–48 months to deliver stable benefits because they involve new capital investment, grid connections, and software optimization.
Challenges impact
| Challenge | (~) % CAGR Friction Drag | Geographic Relevance | Mitigation Horizon |
|---|---|---|---|
| Power Cost Volatility | -1.8% | EU power markets, North America core, APAC import-dependent cities | Medium term (2-4 years) |
| Skilled CEA Labor Gaps | -1.2% | North America core, Western Europe, Gulf urban hubs, advanced APAC | Medium term (2-4 years) |
| Crop Economics Narrowness | -1.5% | North America leafy-greens clusters, EU retail hubs, Japan, Singapore | Long term (≥ 4 years) |
| Biosecurity Compliance Burden | -0.8% | U.S. compliance markets, EU regulatory hubs, export-oriented APAC | Short term (≤ 2 years) |
| Technology Integration Instability | -1.0% | Global scale-up projects, retrofit facilities, multi-site operators | Medium term (2-4 years) |
| Capital Efficiency Reset | -1.6% | U.S. venture-backed operators, Europe expansion markets, APAC growth corridors | Long term (≥ 4 years) |
Driver Analysis
LED efficiency and dynamic energy optimization
LED efficiency and dynamic energy optimization are major growth drivers for vertical farming because they reduce electricity use per kilogram of produce. DOE-supported guidance indicates that LEDs can lower power consumption by about 24%–30% compared with high-pressure sodium lighting. Full conversion of indoor horticultural lighting could reduce annual electricity use to 6.3 TWh, delivering a 34% energy saving and approximately USD 350 million in cost savings.
For vertical farms, where lighting and climate control represent major operating expenses, efficient LEDs, automated dimming, and tariff-based scheduling can strengthen gross margins. Operators are increasingly replacing fixed lighting schedules with software-controlled systems that adjust energy use according to crop requirements and electricity prices. This shift is particularly important in Europe, Japan, South Korea, and major U.S. cities with volatile power costs.
Drivers impact
| Driver | (~) % Impact on CAGR Forecast | Geographic Relevance | Impact Timeline |
|---|---|---|---|
| Retail-local supply premium for leafy greens and herbs | +2.4% | North America core, EU urban clusters, Japan, Singapore, Gulf cities | Short term (≤ 2 years) |
| LED efficiency and dynamic energy optimization | +2.1% | North America core, EU, Japan, South Korea, APAC corridors | Medium term (2-4 years) |
| Food security policy and import substitution programs | +1.9% | Singapore, GCC, Japan, island economies, dense import-dependent cities | Medium term (2-4 years) |
| Automation-led labor cost compression | +1.7% | North America, Western Europe, Japan, Australia | Short term (≤ 2 years) |
| Crop portfolio expansion beyond lettuce into berries and vine crops | +1.5% | U.S., EU, Japan, Middle East premium retail | Long term (≥ 4 years) |
| Asset-light retrofit and modular facility deployment | +1.3% | North America spill-over, EU secondary cities, APAC metros, South America pilot zones | Short term (≤ 2 years) |
Restraint Analysis
Power-cost intensity
A major restraint for vertical farming is that enclosed facilities depend continuously on LEDs, HVAC, dehumidification, pumps, and control systems. Some high-capacity UK sites faced electricity network standing-charge increases of about 94% from April 2026, potentially adding hundreds of thousands of pounds—and nearly £1 million annually for certain large facilities. UK electricity prices of around £56/MWh also remain well above approximately £34/MWh in some competing European horticulture markets.
Higher electricity costs directly reduce EBITDA and may extend project payback periods by 12–24 months in expensive urban locations. When power represents 20%–35% of operating costs, gross margins may decline by 300–600 basis points, forcing operators to reduce lighting hours, limit crop varieties, or delay expansion. As a result, investment is shifting toward regions with stable electricity prices and facilities supported by long-term power agreements or on-site solar and storage systems.
Restraints impact
| Restraint | (~) % Impact on CAGR Forecast | Geographic Relevance | Impact Timeline |
|---|---|---|---|
| Power-cost intensity | -2.4% | UK, EU, Japan, urban NA core | Short term (≤ 2 years) |
| Capital scarcity | -2.0% | North America core, UK, EU, Gulf | Medium term (2-4 years) |
| Imported equipment friction | -1.5% | EU, UK, NA, APAC corridors | Short term (≤ 2 years) |
| Compliance cost load | -1.1% | EU, UK, North America, Singapore | Medium term (2-4 years) |
| Labor-tech bottlenecks | -1.0% | North America, Western Europe, Japan | Medium term (2-4 years) |
| Crop-margin ceiling | -1.8% | Global, strongest in mass retail markets | Long term (≥ 4 years) |
Geopolitical Impact Analysis
Geopolitical Waves: Energy Cost Rise and Disruptions to Logistics Drive Margins Thin
Geopolitical friction has clogged logistics networks, raising the cost of raw materials and industrial components. Hardware procurement spending is hampered by trade tariffs, freight re-routing, and raw material inflation. Simultaneously, higher interest rates imposed globally to counteract war-induced inflation have raised the cost of capital, reducing the availability of upfront project funding.
Conversely, the disruption of Black Sea agricultural exports has transformed localized vertical farming into a critical asset for national infrastructure resilience. Nations across Europe, Asia-Pacific, and the Middle East are treating vertical farms as decentralized food security solutions. Government mandates and tech-matching grants are accelerating, directly backing “plug-and-play” modular shipping containers and industrial warehouse networks to guarantee year-round food security independent of vulnerable open-field grain and fertilizer imports.
The impact on current market operations is due to high energy price volatility and supply inflation. Ongoing fighting has disturbed global fossil fuel baselines, forcing European natural gas prices to rise by up to 40% in 2026. Vertical farms demand huge, constant electrical loads for multi-spectrum LED arrays and HVAC systems, and power spikes have significantly reduced profit margins. Grid blackouts in crisis zones such as Ukraine have caused facilities to quickly construct on-site generators, resulting in unforeseen operational costs and plant growth cycles of 5 to 7 days.
Regional Analysis
North America Held the Largest Share of the Global Vertical Farming Market.
In 2025, North America dominated the vertical farming industry, accounting for 37.9%. This dominance stems from the early commercial adoption of climate-controlled facilities, large venture capital density, and highly developed urban retail distribution networks. For example, data from domestic specialty crop awards demonstrates that large-scale warehouse farms along major U.S. logistics corridors use automated material-handling robotics to process and supply fresh greens in a single day’s drive.
Leadership is strengthened by significant federal financial systems, including urban agricultural grant programs, as well as serious domestic susceptibility to weather interruptions and drought in key open-field production zones. Furthermore, highly developed retail grocery supply networks offer consistent, multi-year volume guarantees, making front-loaded equipment expenditures financially feasible for major corporate operators.
The Asia Pacific area is expected to generate the strongest growth, making it the fastest-growing region on the global map. According to the World Population Review’s baseline urbanization demographics, exponential expansion in megacity populations is continually reducing viable agricultural footprints and increasing urban food demand.
Extreme demographic pressures, urbanization, and acute land scarcity all fuel growth throughout densely populated island states. Initiatives tracked by government regional investment frameworks, such as technology-matching funds and clean-energy subsidies for indoor farms, act as powerful accelerators for rapidly scaling production capacities.
Key Regions and Countries Covered in this Report
- North America
- The US
- Canada
- Europe
- Germany
- France
- The UK
- Spain
- Italy
- Russia & CIS
- Rest of Europe
- APAC
- China
- Japan
- South Korea
- India
- ASEAN
- Rest of APAC
- Latin America
- Brazil
- Mexico
- Rest of Latin America
- Middle East & Africa
- GCC
- South Africa
- Rest of MEA
Key Players Analysis
The global vertical farming market is extremely fragmented and strongly competitive, with no evidence of a monopolistic or oligopolistic configuration. There is no dominating corporation or small number of companies that dominate pricing points or output volumes. Instead, the marketplace is distinguished by a low concentration of market power, with a few dozen well-funded regional leaders competing directly with hundreds of localized micro-growers and modular container operators.
Market share is rapidly changing toward financial resilience and technical maturity over pure facility square footage. Following recent market disruptions induced by high global energy price volatility, market share is shifting from purely experimental companies to those with optimized thermodynamic engineering and automated material handling.
Cash-rich agriculture corporations and technology firms are selectively purchasing faltering regional facilities’ proprietary software patents and farm operating systems in order to strengthen regional networks, yet no single entity has achieved a dominating market-clearing position.
The Major Players in The Industry
- AGEYE Technologies
- American Hydroponics
- Argus Control Systems Limited
- CubicFarm Systems Corp.
- EVERLIGHT ELECTRONICS CO., LTD.
- FOSHAN REINFA AGTECH CO., LTD.
- iFarm
- Intelligent Growth Solutions Limited
- LOGIQS B.V.
- OnePointOne
- Signify Holding
- Vertical Farm Systems
Key Development
- In May 2026, AGEYE Technologies established itself as a key pioneer in the vertical farming market. The company has shifted from providing isolated sensors to delivering fully integrated automation, agentic AI, and modular turnkey systems.
- In March 2026, Vertical Farm Systems announced the completion of a 10,000 m² automated vertical farming facility in Melbourne Airport precinct. The project, valued at AUD 150 million, integrates proprietary robotics, renewable energy, and closed-loop water recycling. The facility is expected to produce 3.4 million kg of herbs and leafy greens annually, with only 15 staff operating 25 robotic systems.
Report Scope
| Report Features | Description |
|---|---|
| Market Value (2025) | USD 6.7 Bn |
| Forecast Revenue (2035) | USD 16.1 Bn |
| CAGR (2026-2035) | 8.3% |
| Base Year for Estimation | 2025 |
| Historic Period | 2020-2024 |
| Forecast Period | 2026-2035 |
| Report Coverage | Revenue Forecast, Market Dynamics, Competitive Landscape, Recent Developments |
| Segments Covered | By Component (Hardware, Software, Services), By Growing Mechanism (Aeroponics, Hydroponics, Aquaponics), By Crop Category (Fruits, Vegetables & Herbs, Flowers & Ornamentals), By Structure (Building-Based Vertical Farms, Shipping-Container Vertical Farms) |
| Regional Analysis | North America – The US & Canada; Europe – Germany, France, The UK, Spain, Italy, Russia & CIS, Rest of Europe; APAC- China, Japan, South Korea, India, ASEAN & Rest of APAC; Latin America- Brazil, Mexico & Rest of Latin America; Middle East & Africa- GCC, South Africa, & Rest of MEA |
| Competitive Landscape | AGEYE Technologies, American Hydroponics, Argus Control Systems Limited, CubicFarm Systems Corp., EVERLIGHT ELECTRONICS CO. LTD., FOSHAN REINFA AGTECH CO. LTD., iFarm, Intelligent Growth Solutions Limited, LOGIQS B.V., OnePointOne, Signify Holding, Vertical Farm Systems |
| Customization Scope | Customization for segments, region/country-level will be provided. Moreover, additional customization can be done based on the requirements. |
| Purchase Options | We have three licenses to opt for: Single User License, Multi-User License (Up to 5 Users), Corporate Use License (Unlimited Users and Printable PDF) |


