Quick Navigation
Company Overview
Nestlé S.A. Statistics: Nestlé S.A. is a global food and beverage leader engaged in the manufacturing, processing, and distribution of a vast portfolio of consumable goods catering to retail, hospitality, and healthcare sectors. The company’s diverse portfolio encompasses over 2,000 brands, spanning major categories such as coffee, pet care, dairy, prepared meals, confectionery, bottled water, cereals, ice cream, nutrition, and plant-based foods. Nestlé also offers specialized health science and food service products. The company operates in 7 business segments, namely liquid and powdered beverages, ice cream and milk products, nutrition and health science, pet care, cooking aids and prepared dishes, confectionery, and water.
Nestlé operates 337 factories across 75 countries and maintains a strong presence in 185 nations, reflecting its expansive global footprint. Its operations are supported by a robust supply chain and localized production capabilities to meet regional consumer demands efficiently.
The company’s key product lines include coffee (Nescafé, Nespresso), pet care (Purina), culinary and dairy (Maggi, Nestlé Milk), chocolates and confectionery (KitKat, Milkybar), and bottled water (Perrier, S.Pellegrino). Nestlé’s products are designed to cater to diverse consumer needs, ranging from daily nutrition to indulgent experiences, with a focus on innovation and sustainability.
Geographically, Nestlé’s operations span countries including Australia, India, Brazil, China, the United States, France, South Africa, Japan, Mexico, the United Kingdom, Switzerland, and over 170 others, making it one of the most globally integrated companies in the consumer goods sector.
Nestlé S.A. History
1800’s
- 1866: The Anglo-Swiss Condensed Milk Company was founded, marking the beginning of Nestlé’s long-standing legacy in the global food industry.
- 1867: Henri Nestlé developed Farine Lactée, a nutritious infant cereal made of milk and flour, in Vevey, Switzerland.
1900’s
- 1905: The merger of Nestlé with the Anglo-Swiss Condensed Milk Company created a unified enterprise specializing in dairy-based nutrition.
- 1929: The acquisition of Peter, Cailler, Kohler, and Chocolats Suisses S.A. established Nestlé as a major player in the premium chocolate segment.
- 1934: The introduction of the Milo brand added a new dimension to Nestlé’s malt-based nutritional offerings.
- 1938: Nescafé was launched in Switzerland following two years of research, revolutionizing the global coffee industry.
- 1947: Nestlé merged with Alimentana Ltd., the producer of Maggi products, broadening its culinary product portfolio.
- 1948: The company introduced Nestea and Nesquik, expanding its beverage and cocoa-based product lines.
- 1971: Nestlé entered the German market with the acquisition of Ursina Franck AG.
- 1973: The acquisition of Stouffer strengthened the company’s presence in the frozen food segment.
- 1974: Nestlé took an equity stake in L’Oréal S.A., diversifying into personal care, though this holding was later reduced to 23.29% in 2014.
- 1985: The purchase of Carnation Company for USD 3 billion brought popular brands such as Carnation and Coffee-Mate into its portfolio.
- 1986: Nestlé founded Nespresso S.A. and introduced Herta, reinforcing its commitment to convenience and quality.
- 1988: The acquisition of Rowntree Mackintosh and Italian confectioner Perugina strengthened its chocolate and confectionery range.
- 1991: Joint ventures with General Mills (Cereal Partners Worldwide) and The Coca-Cola Company (Beverage Partners Worldwide) expanded Nestlé’s footprint in breakfast cereals and beverages.
- 1992: By acquiring Source Perrier S.A., Nestlé became the global leader in bottled water through its Nestlé Sources International division.
- 1997: The company created its Nutrition Strategic Business Division, later renamed Nestlé Nutrition in 2006.
- 1998: Nestlé acquired Italy’s Sanpellegrino Group and launched Nestlé Pure Life, strengthening its water business in emerging markets.
2000’s
- 2001: The acquisition of Ralston Purina led to the formation of Nestlé Purina Petcare, making the company a leader in pet nutrition.
- 2005: Nestlé expanded into frozen desserts by acquiring Delta Ice Cream for €240 million (USD 270.8 million).
- 2006: The acquisition of Novartis’s Medical Nutrition division for USD 2.5 billion reinforced Nestlé’s role in clinical nutrition.
- 2007: The company added Ovaltine to its portfolio, enhancing its malted beverage range.
- 2010: Nestlé acquired Kraft Foods’ frozen pizza business in North America for USD 3.7 billion, entering the quick-meal category.
- 2011: The company purchased a 60% stake in Hsu Fu Chi International Ltd. for about USD 1.7 billion, strengthening its position in China.
- 2012: The acquisition of Pfizer’s infant nutrition business for USD 11.9 billion expanded Nestlé’s presence in the pediatric nutrition segment.
- 2013: Nestlé expanded its Singapore R&D center with a USD 4.1 million investment and acquired U.S.-based Pamlab through Nestlé Health Science.
- 2014: The establishment of Nestlé Skin Health gave the company full ownership of the Galderma dermatology business, previously co-owned with L’Oréal.
- 2015: The launch of Cailler, Nestlé’s premium bean-to-bar Swiss chocolate, marked its entry into luxury e-commerce.
- 2017: Nestlé USA acquired Chameleon Cold-Brew and took a majority stake in Blue Bottle Coffee, strengthening its specialty coffee lineup. It also bought Atrium Innovations to boost its health and wellness segment.
- 2018: Nestlé secured global rights to market Starbucks consumer packaged goods and foodservice products. The same year, its joint venture with The Coca-Cola Company, Beverage Partners Worldwide, concluded.
- 2019: The company expanded its coffee range under the Starbucks brand, launching new products for global distribution.
Financial Analysis
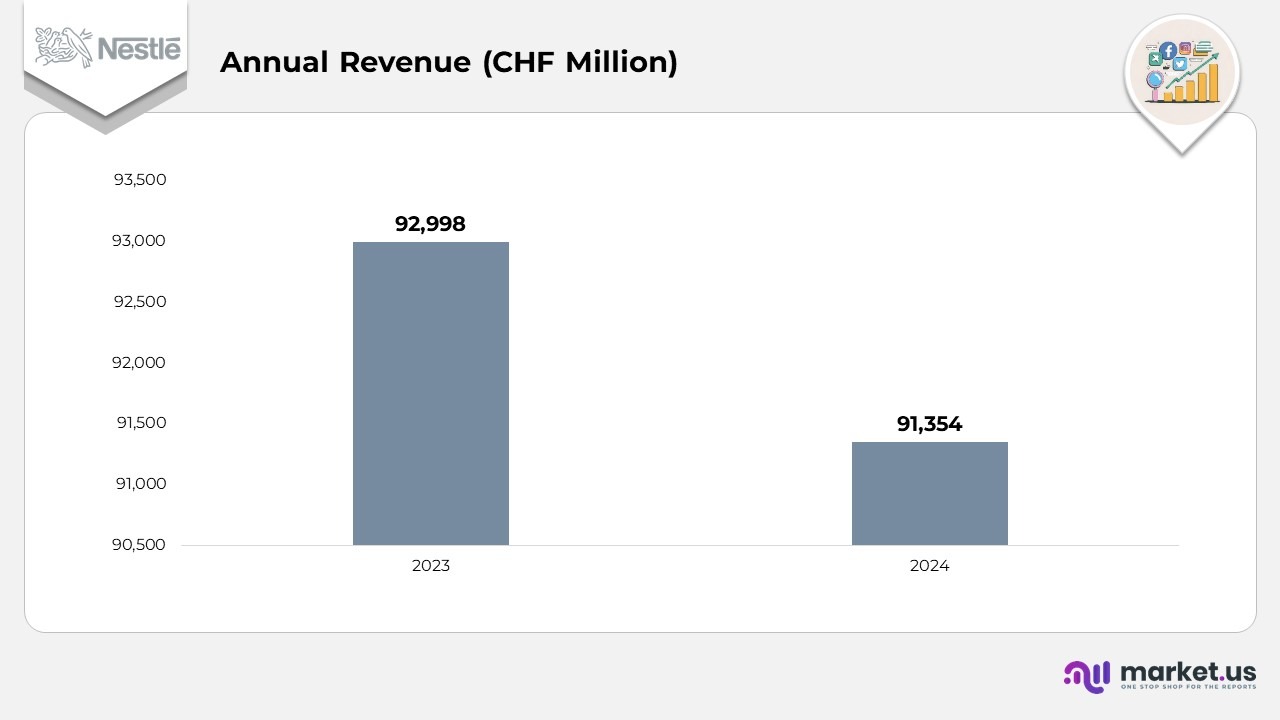
- Nestlé recorded total sales of 91,354 million CHF in 2024, marking a slight decline from 92,998 million CHF in 2023, reflecting a modest 8% year-over-year contraction primarily driven by currency pressures and softer demand in key markets.
- The company’s underlying trading operating profit reached 15,704 million CHF in 2024, compared to 16,053 million CHF in 2023, maintaining a stable operating margin of 2%, down marginally from 17.3% the previous year.
- Trading operating profit stood at 14,633 million CHF, up slightly from 14,520 million CHF in 2023, resulting in an improved margin of 0% versus 15.6% in the prior year.
- Net profit attributable to shareholders totaled 10,884 million CHF in 2024, compared to 11,209 million CHF in 2023, representing 9% of sales versus 12.1% previously, indicating steady profitability despite external market headwinds.
- Organic growth reached 2%, reflecting modest expansion amid challenging market conditions.
- Pricing growth stood at 5%, showing a cooling of inflation across most product categories after two consecutive years of sharp input cost increases and price hikes.
- Real internal growth (RIG) improved to 8%, indicating a return to positive territory, though overall demand remained subdued in several regions.
- Consumer sentiment remained cautious, particularly in markets that showed hesitancy toward established global brands.
- Additionally, deliberate actions taken to optimize customer inventory levels in the second half of the year trimmed full-year RIG by nearly 20 basis points.
Segmental Analysis
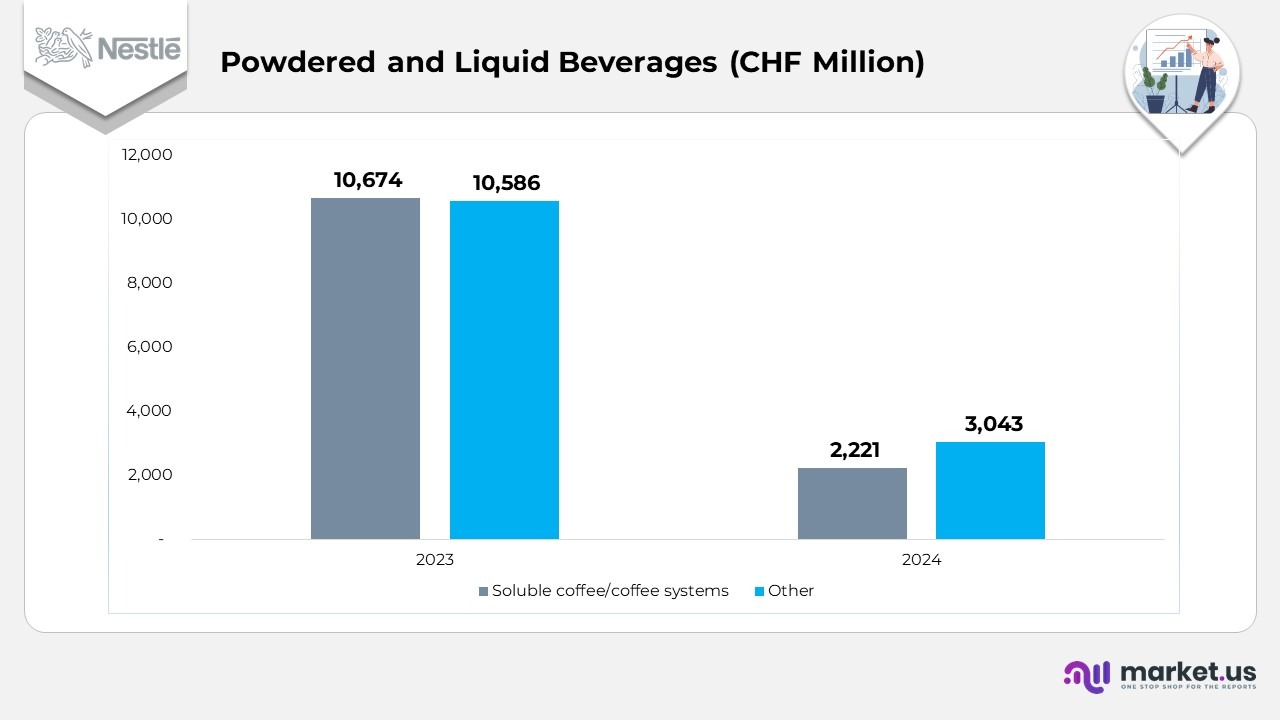
Powdered and Liquid Beverages
- The Powdered and Liquid Beverages division includes coffee, malt, cocoa, and other beverage lines within Nestlé’s global portfolio.
- It houses leading brands such as Nespresso, Nescafé, and Starbucks, which anchor its position in the coffee segment.
- The Powdered and Liquid Beverages category recorded total sales of 24,598 million CHF in 2024, slightly lower than 24,786 million CHF in 2023, indicating a modest contraction across certain beverage segments.
- Sales from soluble coffee and coffee systems rose marginally to 16,679 million CHF from 16,648 million CHF in 2023, supported by steady consumer interest in premium coffee varieties.
- The Other beverages segment reached 7,919 million CHF, compared with 8,138 million CHF in the previous year, reflecting softer demand in specific subcategories.
- The underlying trading operating profit stood at 4,920 million CHF in 2024, down from 5,130 million CHF in 2023, primarily due to inflationary cost pressures and unfavourable currency trends.
- Trading operating profit declined to 4,499 million CHF from 4,945 million CHF in 2023, underscoring tighter margins and subdued market momentum across key beverage lines.
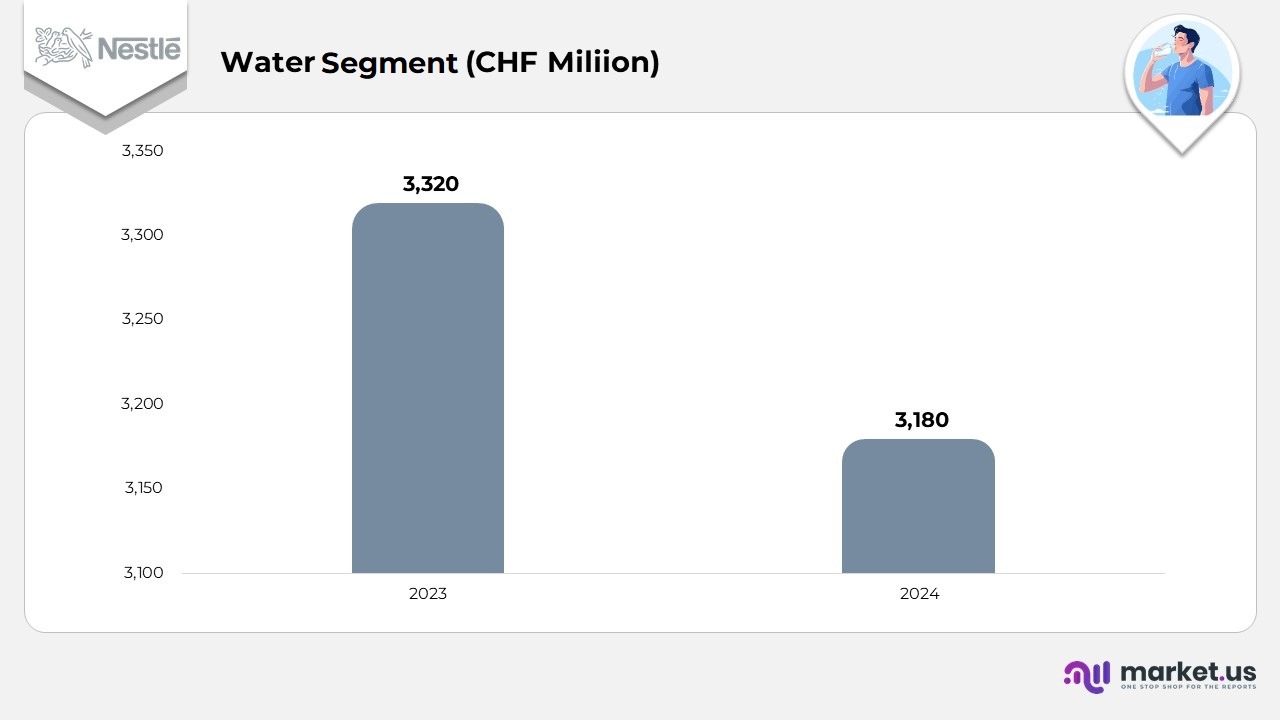
Water Segment
- Total sales reached CHF 3,180 million in 2024, compared to CHF 3,320 million in 2023, reflecting a modest decline due to lower bottled water demand in select regions.
- Underlying trading operating profit was CHF 297 million, indicating consistent performance amid cost pressures.
- Trading operating profit increased to CHF 259 million, supported by stronger operational efficiency and brand-driven pricing strategies.
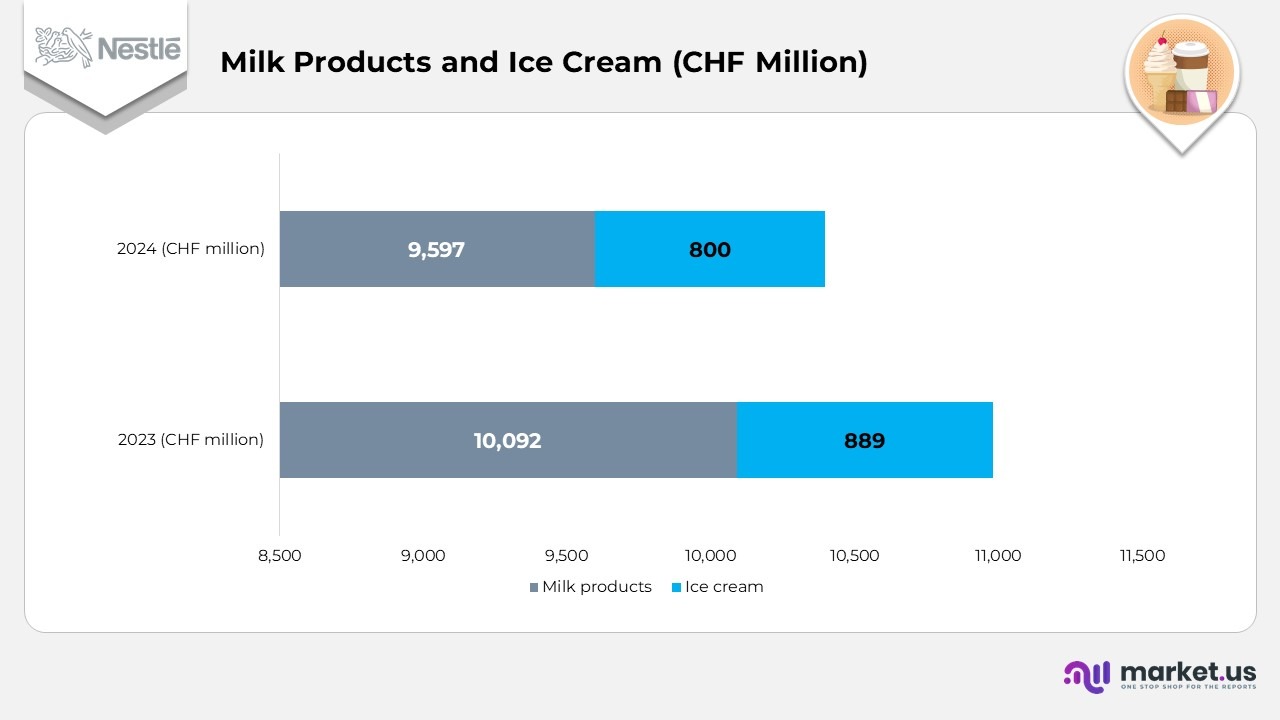
Milk Products and Ice Cream Segment
- Total sales reached CHF 10,397 million in 2024, down from CHF 10,981 million in 2023, due to the impact of seasonal trends and pricing normalization.
- Underlying trading operating profit was CHF 2,442 million, reflecting stability in dairy margins despite cost inflation.
- Trading operating profit reached CHF 2,393 million, aided by efficiency programs and product mix improvements across dairy and ice cream categories.
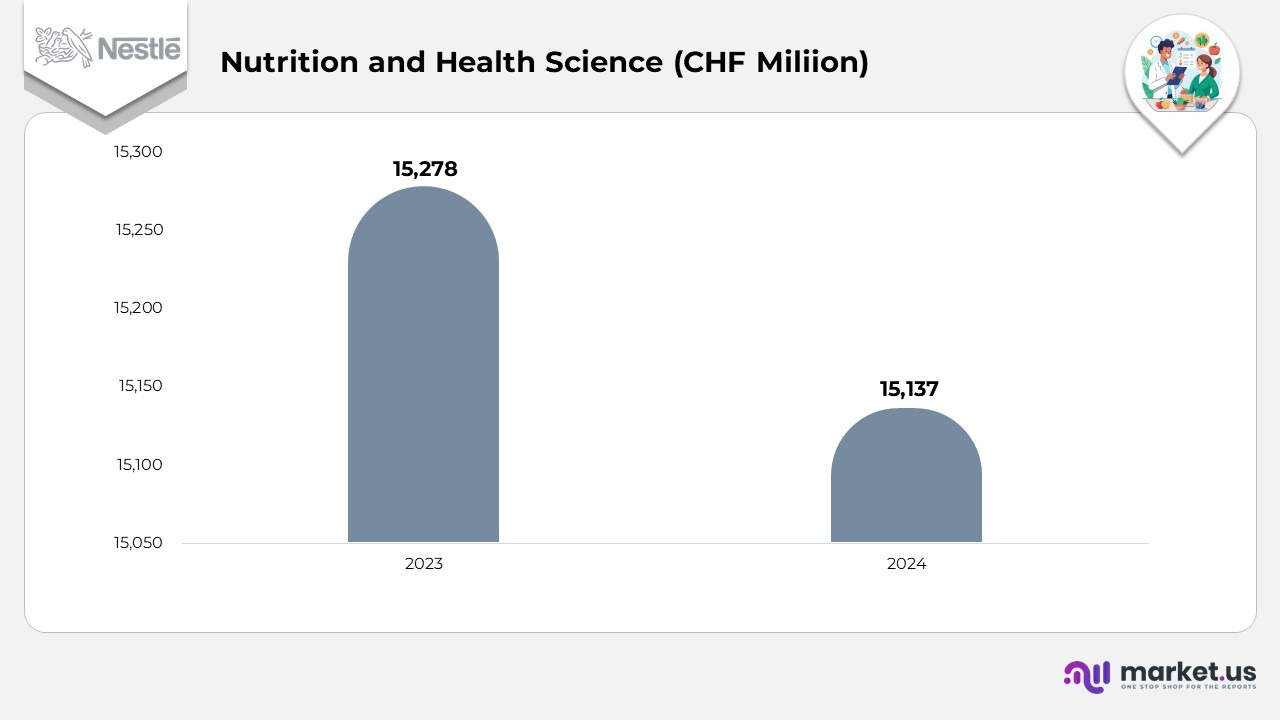
Nutrition and Health Science Segment
- The division generated CHF 15,137 million in sales during 2024, slightly below the CHF 15,278 million recorded in 2023, reflecting a post-pandemic normalization in demand for health products.
- Underlying trading operating profit improved to CHF 3,006 million, demonstrating operational resilience and innovation in the medical nutrition sector.
- Trading operating profit climbed to CHF 2,771 million, driven by strong performance in specialized health and wellness products.
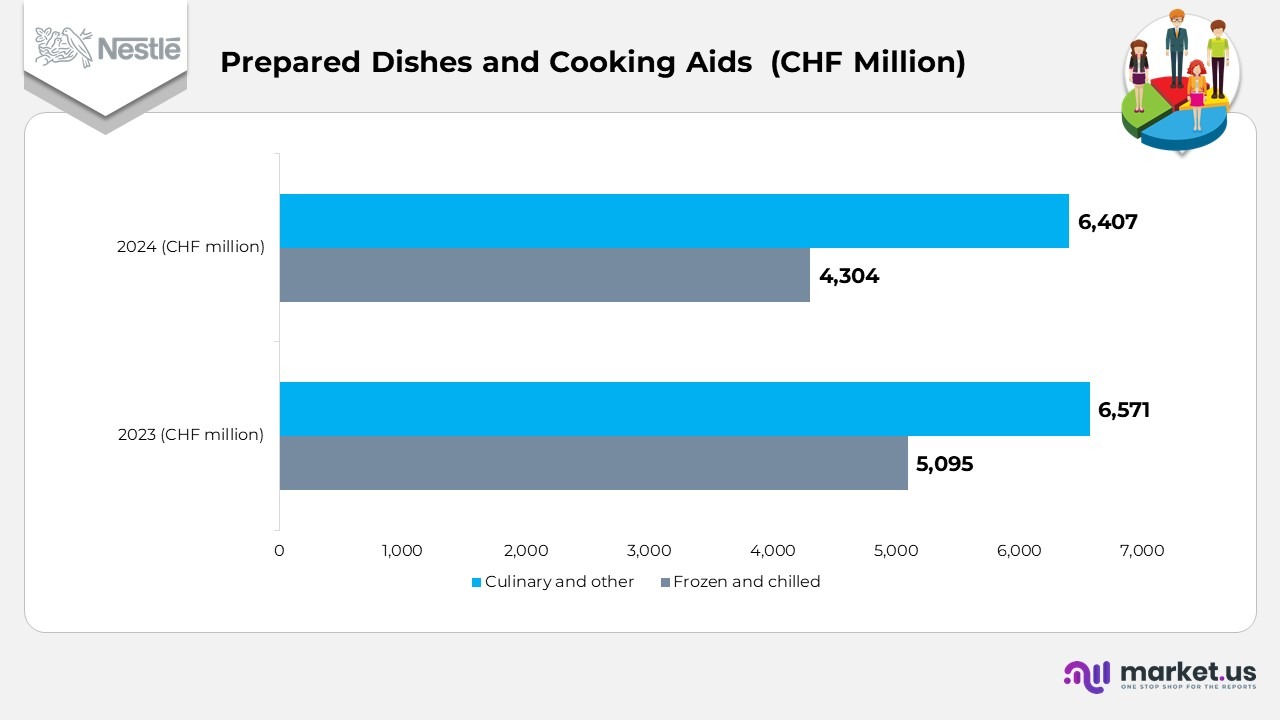
Prepared Dishes and Cooking Aids Segment
- Sales totaled CHF 10,711 million in 2024, compared to CHF 11,666 million in 2023, due to inflationary constraints and evolving consumer preferences toward fresh meal options.
- Underlying trading operating profit remained steady at CHF 2,137 million, reflecting effective cost control measures.
- Trading operating profit rose to CHF 2,000 million, supported by efficiency initiatives and a focus on value-driven meal solutions.
Confectionery Segment
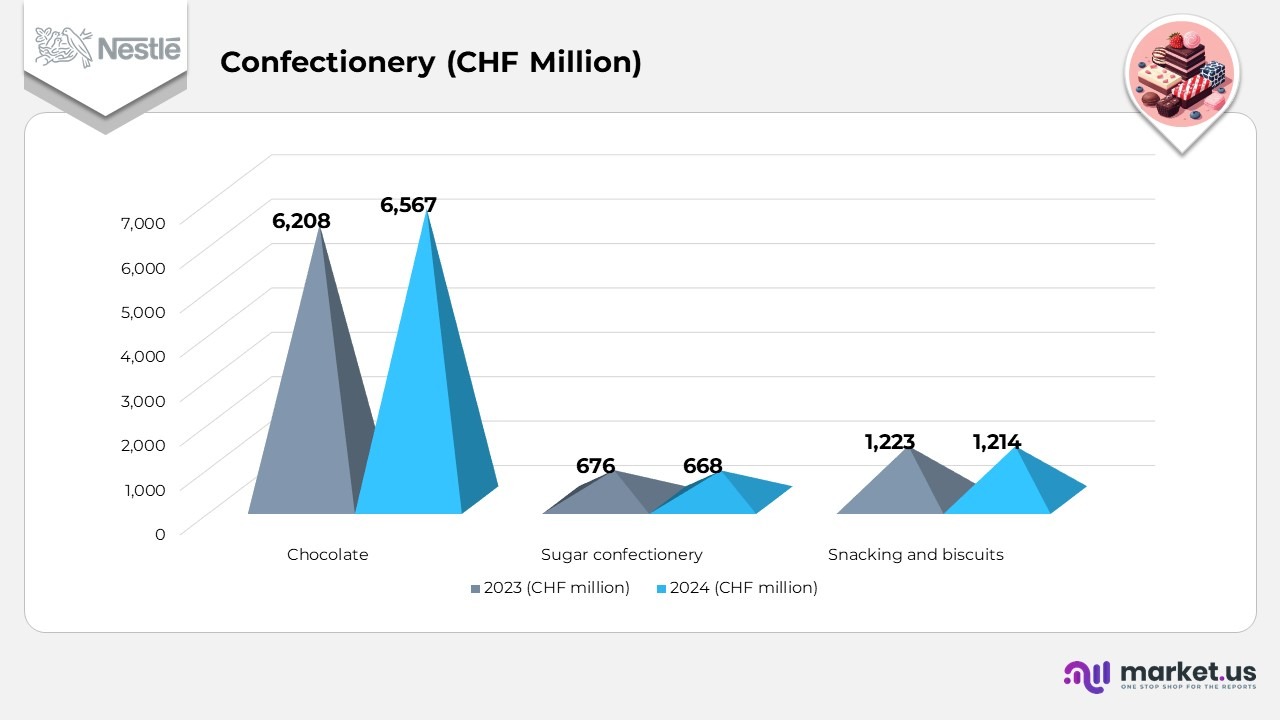
- The confectionery division reported total sales of CHF 8,449 million in 2024, an increase from CHF 8,107 million in 2023, supported by steady growth in premium chocolates and snacking categories.
- Chocolate sales rose to CHF 6,567 million, up from CHF 6,208 million, reflecting the success of seasonal launches and premium gifting ranges.
- Sugar confectionery contributed CHF 668 million, slightly below CHF 676 million, due to moderation in impulse purchases.
- Snacking and biscuits generated CHF 1,214 million, compared to CHF 1,223 million in the previous year. Driven by portfolio optimization and the introduction of healthier snacking alternatives.
- Underlying trading operating profit reached CHF 1,299 million, up from CHF 1,264 million, supported by improved pricing strategies and efficient supply chain operations.
- Trading operating profit rose to CHF 1,190 million, compared to CHF 1,131 million, showcasing margin stability amid input cost volatility.
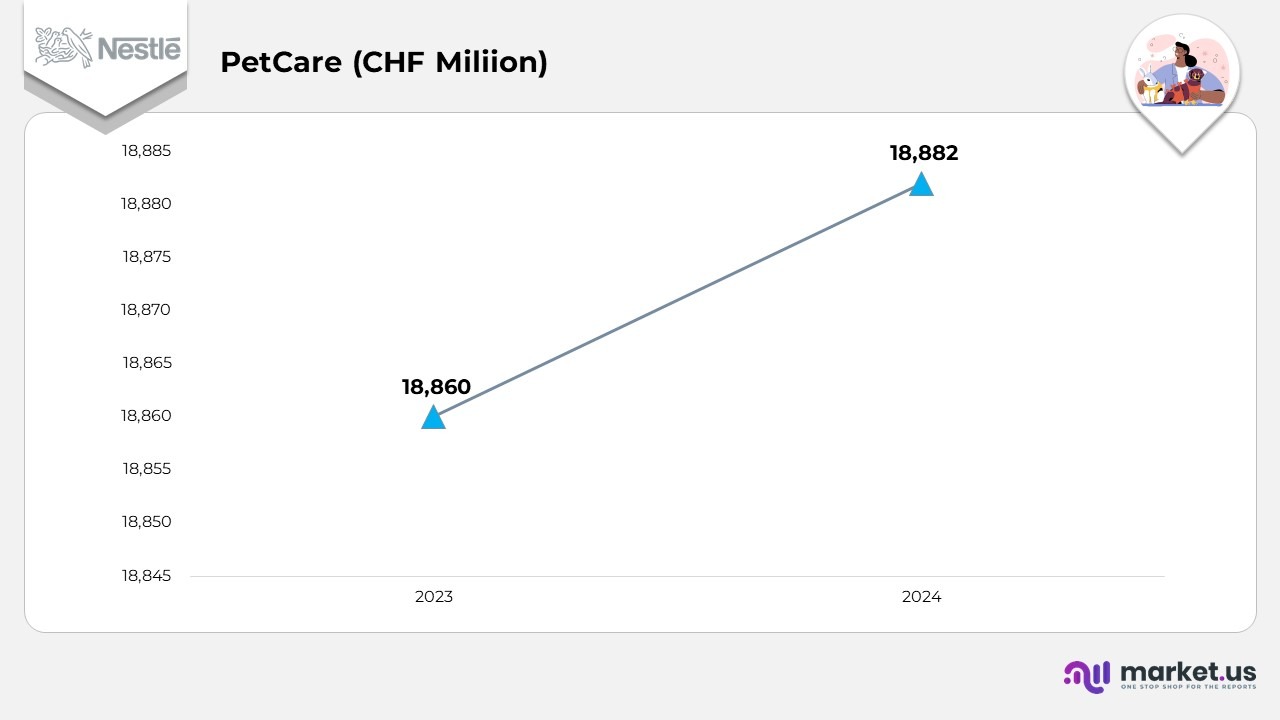
PetCare Segment
- The PetCare business recorded total sales of CHF 18,882 million in 2024, up from CHF 18,860 million in 2023. Driven by sustained demand for premium and functional pet nutrition products.
- Underlying trading operating profit increased to CHF 4,087 million, compared to CHF 3,912 million. Supported by brand strength and innovation in science-based formulations.
- Trading operating profit climbed to CHF 4,047 million, up from CHF 3,862 million. Reflecting improved cost management and expanding e-commerce sales channels.
(Source: Nestlé S.A. Annual Report
Geographic Revenue Analysis
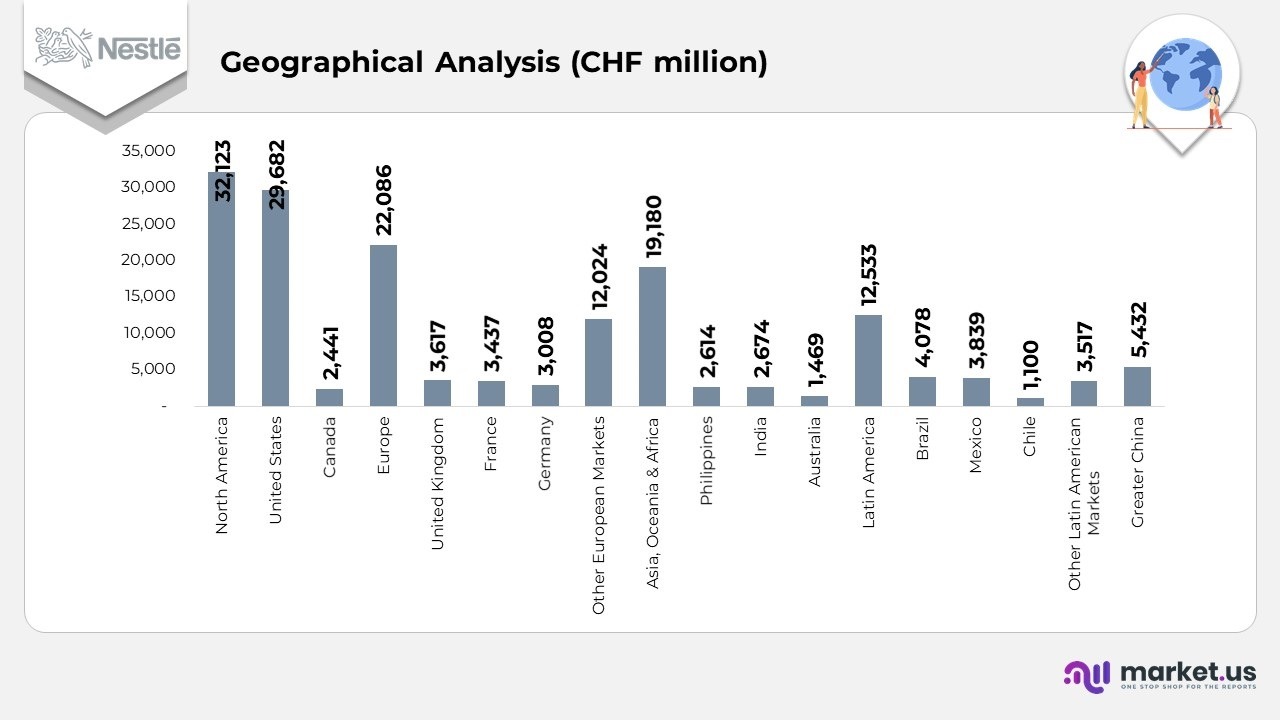
- North America recorded total sales of CHF 32,123 million in 2024, marking a 3% decline from the previous year. The United States contributed CHF 29,682 million, down 1.2%, while Canada reported CHF 2,441 million, a 3.1% decline, although the local currency showed a slight positive change of +0.3%.
- Europe generated CHF 22,086 million, reflecting a 9% decrease in Swiss francs. The United Kingdom posted a growth of +2.5% to reach CHF 3,617 million, while France declined by 3.1% to CHF 3,437 million, and Germany fell by 9.2% to CHF 3,008 million. Other European markets, including Switzerland, contributed CHF 12,024 million, representing a 3.5% year-over-year reduction.
- Asia, Oceania, and Africa accounted for CHF 19,180 million, representing a 3.5% decrease in revenue. India showed strong growth of +11.4%, reaching CHF 2,674 million, whereas the Philippines rose by 1% to CHF 2,614 million, and Australia registered CHF 1,469 million, up 1.3%.
- Latin America posted CHF 12,533 million in revenue, experiencing an 8% contraction. Brazil recorded CHF 4,077 million, down 2.2% in CHF but up +7.6% in local currency, while Mexico reached CHF 3,839 million, down 2.5% in CHF. Chile saw the steepest regional decline of 13.3%, totaling CHF 1,100 million.
- Greater China markets combined achieved CHF 5,432 million, marking a 7% fall, although local currency growth stood at +1.9%, indicating recovery from prior macroeconomic slowdowns.
(Source: Nestlé S.A. Annual Report)
Nestlé’s Global Manufacturing Footprint
- Nestlé operates one of the world’s largest manufacturing networks, comprising over 330 factories across 75 countries. Which underscores its global reach and operational diversity.
- In North America, the United States leads with 54 factories, while Canada runs 2, focusing on beverages, pet care, and prepared meal production.
- Across Europe, key production hubs include Germany (13), France (12), Italy (7), Spain (5), and Poland (5), supporting high demand for dairy, confectionery, and nutrition-based products.
- The Asia, Oceania, and Africa (AOA) region is home to major operations in India (8), China (6), Indonesia (6), and Australia (5), serving markets for nutrition, culinary products, and beverages.
- In Latin America, countries such as Brazil (8), Mexico (5), and the Philippines (6) serve as vital production bases, meeting the growing regional consumption.
- Nestlé maintains a robust manufacturing presence across Latin America and Greater China, supporting its regional and global operations.
- In Latin America (LATAM), Brazil leads with 13 factories, followed by Mexico (11), Venezuela (5), Colombia (4), and Argentina (6), showcasing strong regional diversification.
- Other key markets include Peru (4), Dominican Republic (4), Ecuador (2), and Guatemala (2), ensuring localized production for various product categories.
- Smaller yet strategic facilities operate in Bolivia (1), Chile (1), Panama (1), Trinidad and Tobago (1), and Uruguay (1). Expanding Nestlé’s footprint across Central and South America.
- In Greater China, the company operates 23 factories, highlighting its significant investment and scale in one of the world’s fastest-growing consumer markets.
(Source: Nestlé S.A. Annual Report)
Regional Sales and Workforce Distribution of Nestlé
- North America (NA) accounted for 2% of total sales in 2024, compared to 35.0% in 2023, with employee share decreasing from 14.7% to 14.2%.
- Europe (EUR) contributed 2% of sales in 2024, up from 24.0% in 2023, maintaining a stable workforce proportion of 28.9%.
- Asia, Oceania, and Africa (AOA) represented 0% of total sales in 2024, a slight drop from 21.4% in 2023. While employees accounted for 25.5% of the total.
- Latin America (LATAM) accounted for 13.7% of sales in both 2023 and 2024. With its workforce share increasing from 9% to 22.8%.
- Greater China (GC) remained steady with 9% of sales and 8.6% of employees in both years.
(Source: Nestlé S.A. Annual Report)
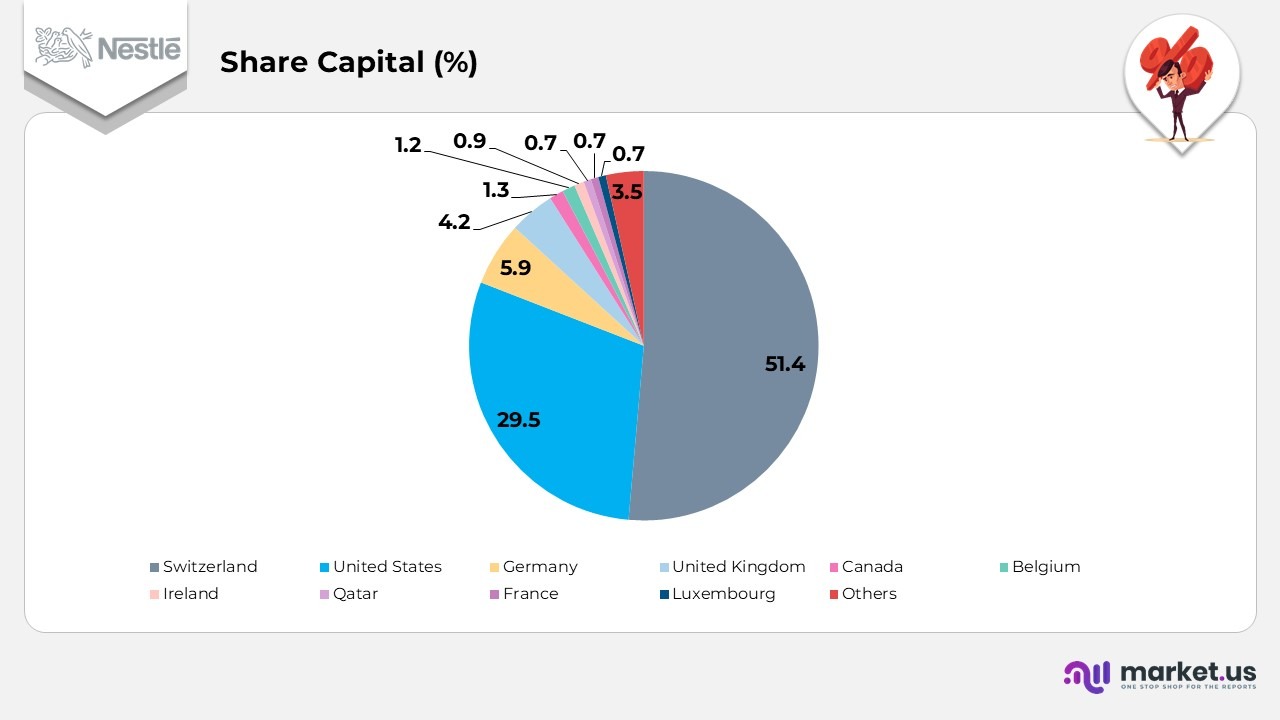
- Nestlé’s share capital distribution highlights a strong domestic and international investor base. With Switzerland holding the majority at 51.4%, reflecting its confidence in the home market.
- The United States ranks second with 29.5%, signifying significant participation from North American institutional investors.
- Germany accounts for 5.9%, followed by the United Kingdom at 4.2%, representing robust European investment support.
- Smaller but consistent stakes are held by Canada (1.3%), Belgium (1.2%), and Ireland (0.9%), indicating Nestlé’s widespread shareholder presence across Western markets.
- Additional international contributions come from Qatar (0.7%), France (0.7%), and Luxembourg (0.7%), reflecting the brand’s global appeal.
- The remaining 3.5% of share capital is distributed among other international investors, underscoring Nestlé’s diversified global ownership structure.
(Source: Nestlé S.A. Annual Report)
Patents of Nestlé
| Patent Title | Patent Number | Filed Date | Date of Patent |
|---|---|---|---|
| Process and device for the application of particles onto frozen confectionery | 12439936 | Dec 10, 2021 | Oct 14, 2025 |
| Infant formula | 12426617 | Dec 28, 2020 | Sep 30, 2025 |
| Methods and devices for heating or cooling viscous materials | 12426613 | Oct 4, 2024 | Sep 30, 2025 |
| Process of calibration of a roasting apparatus | 12408691 | Apr 27, 2021 | Sep 9, 2025 |
| Support and capsule for preparing a beverage by centrifugation | 12408686 | Jun 5, 2023 | Sep 9, 2025 |
| Compositions and methods using a nicotinamide adenine dinucleotide (NAD) precursor and at least one ketone or ketone precursor | 12403152 | May 24, 2019 | Sep 2, 2025 |
| Compositions for use in the promotion of intestinal muscle growth and development, and associated intestinal motility | 12403151 | Dec 20, 2018 | Sep 2, 2025 |
| Apparatus comprising a hygienic cooling system and method | 12397271 | Jun 28, 2021 | Aug 26, 2025 |
| Dietary supplement | 12397026 | Apr 21, 2023 | Aug 26, 2025 |
| Adaptive service unit of a beverage machine | 12390044 | Sep 27, 2019 | Aug 19, 2025 |
| Prevention of MCPD formation by auxiliary degumming | 12384984 | Nov 13, 2020 | Aug 12, 2025 |
| Maceration composition and method for preparing the same | 12382976 | Sep 2, 2019 | Aug 12, 2025 |
| Apparatus for depositing | 12376603 | Nov 5, 2020 | Aug 5, 2025 |
| Method for heating a preform and corresponding method for forming a container | 12377599 | Jul 30, 2021 | Aug 5, 2025 |
| Roasting apparatus | 12376617 | Jun 15, 2020 | Aug 5, 2025 |
| Pet food works that modulate vitamin D and bone mineral relaxed in a companion animal | 12370173 | Mar 3, 2023 | Jul 29, 2025 |
| Extensively hydrolysed infant formula | 12369612 | Oct 16, 2020 | Jul 29, 2025 |
| Kit for the preparation of a beverage in a centrifugal brewing device | 12371250 | Feb 23, 2022 | Jul 29, 2025 |
| Process for the production of a container for the preparation of a beverage in a beverage preparation device, and a container obtained by said process | 12365501 | Nov 16, 2022 | Jul 22, 2025 |
(Source: Justia Patents)
Recent Developments
- In February 2019, Nestlé.in introduced an exclusive range of Starbucks-branded coffee products. Expanding global accessibility and reinforcing its leadership in the premium coffee segment.
- In September 2018, Nestlé strengthened its health and wellness portfolio by acquiring a majority stake in Terrafertil. A leading natural foods producer and the world’s primary supplier of goldenberries.
- In April 2018, Nestlé Purina PetCare expanded its pet nutrition capabilities by acquiring a majority stake in Tails.com. A UK-based personalised dog food company, thereby enhancing its position in the fast-growing pet care customization market.
(Source: Nestlé Press Releases)