
Quick Navigation
- Introduction
- Editor’s Choice
- Web3 adoption statistics
- Web3 Project Participation and Corporate Involvement
- Awareness and Engagement Levels Across Web3 Users
- The Most Common Gateways Into the Web3 Ecosystem
- Web3 Usage Statistics
- Web3 User Demographics and Behavioral Statistics
- Web3 Gaming Statistics
- Web3 Job Statistics
- Web3 Security Risks and Hacking Trends
- Conclusion
Introduction
Web 3.0 Statistics: Web 3.0 marks the next transformative stage of the internet, built on decentralization, user-owned data, and intelligent, blockchain-enabled systems. As organizations increasingly explore trustless networks, token-based economies, and AI-enhanced data frameworks, the global shift toward Web 3.0 technologies is gaining strong momentum.
Adoption is rising across financial services, gaming, retail, social platforms, and enterprise workflows, supported by the growth of dApps, smart contracts, NFTs, and immersive metaverse environments. Improvements in blockchain scalability, edge computing, and privacy-focused tools are creating a more open, interoperable, and user-driven digital structure. The following statistics provide a comprehensive look at how Web 3.0 is expanding, offering measurable insights into user engagement, investment activity, emerging trends, and sector-wide evolution.
Editor’s Choice
- About 92% of people worldwide are familiar with cryptocurrency, with the highest levels of awareness in Nigeria, South Africa, and Brazil.
- The meme coin market cap surged by 500% in 2024, reaching nearly $120 billion.
- More than 46% of finance-related applications created by a software product engineering firm were built using Web 3.0 technologies.
- Close to 70% of individuals in emerging markets plan to use at least one Web3 service, compared with only 7% in developed regions.
- The overall Web3 ecosystem now holds a combined market capitalization of over US$27.5 billion.
- NFT awareness in the US has grown significantly, with 40% of Americans now familiar with NFTs, rising from 27% just two weeks earlier, and total awareness reaching 81%.
- Web 3.0 adoption is projected to grow by 50% within the next three years.
- Nearly 50% of crypto investors and traders belong to the millennial age group.
- Only 13% of US consumers feel confident that they understand the meaning of Web3.
- Among US internet users familiar with the term, 83% believe Web3 will enhance their overall happiness and well-being.
- About 57% of Americans have either purchased cryptocurrency or seriously considered doing so.
- With a 57% awareness rate, Bitcoin remains the most widely recognized cryptocurrency in the United States.
- The current estimated market capitalization of the Web3 ecosystem stands at $27.5 billion.
- The Web3 gaming sector is presently valued at approximately $3 billion.
- In 2022, the Web3 industry recorded a 50% rise in regular daily unique active wallets compared to 2021.
- Gaming represented 49% of total daily blockchain activity in 2022.
- During Q3 2023, an average of 786,766 daily unique active wallets were engaged in blockchain gaming.
Web3 adoption statistics
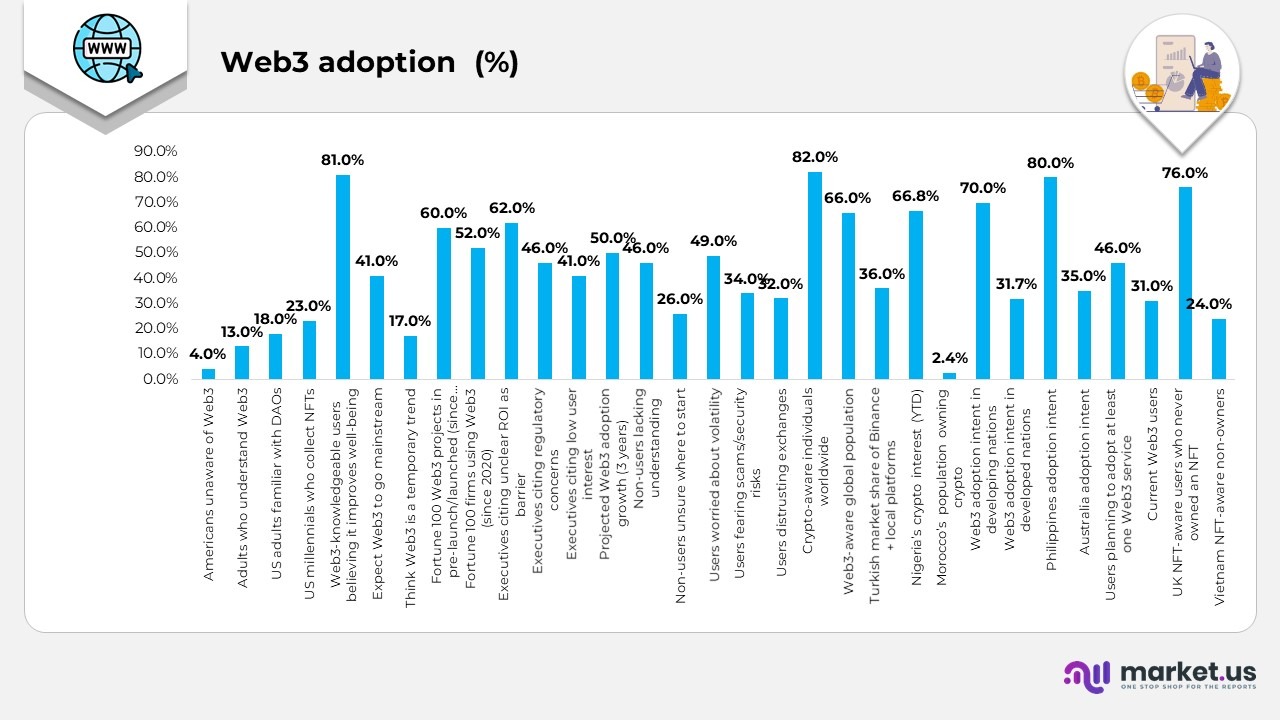
- About 4% of American adults have never heard the term Web3.
- Research indicates that only 13% of adults fully understand what Web3 actually means.
- Just 18% of adults in the US are familiar with DAOs.
- Around 23% of US millennials identify as NFT collectors.
- Among the 13% who understand Web3, nearly 81% believe it will enhance their overall well-being and happiness.
- Approximately 41% expect Web3 to become mainstream in the coming years, while 17% view it as a temporary trend.
- Since January 2022, nearly 60% of Web3-related projects initiated by Fortune 100 companies are either in pre-launch or fully launched stages.
- Nearly 52% of Fortune 100 companies have adopted Web3 technologies since early 2020.
- Around 62% of Fortune 500 executives cite limited ROI clarity as the key hurdle to Web3 adoption, while 46% are concerned about insufficient regulations, and 41% believe user interest remains low.
- Web 3.0 usage is projected to grow by 50% within the next three years.
- Limited understanding remains a major barrier: 46% of non-users cite a lack of familiarity, and 26% are unsure how to get started.
- The growing use of Web 3.0-based cryptocurrencies to automate online transactions is driving industry adoption.
Moreover
- Market instability is a major concern for users: 49% worry about price volatility, 34% fear scams and security risks, and 32% question the reliability of centralized exchanges.
- Government policies play a key role in adoption, with 26% of crypto users uneasy about regulatory actions and 18% concerned about discouraging government attitudes, especially in countries such as India and Canada.
- Global awareness remains high: 82% know about crypto, and 66% understand at least some aspects of Web 3, with Europe showing stronger awareness than Japan and several emerging markets.
- Social platforms dominate information channels, with 30–40% of crypto users relying on YouTube, social media, and crypto-focused websites, compared with only 16–26% who use mainstream financial news sources.
- From 2020 to 2023, the United States consistently ranked among the top 10 nations for crypto adoption based on transaction volume.
- The US also placed second globally for on-chain retail value received from DeFi protocols.
- In Turkey, Binance leads local crypto usage, while platforms such as BtcTurk PRO, Paribu, and Binance TR together account for roughly 36% of market activity.
- In Africa, Nigeria shows exceptionally strong demand, recording 8% year-to-date crypto interest, more than seven times that of the next country, while Kenya ranks 15th globally.
Further
- South Africa saw a major milestone when retailer Pick’n Pay enabled Bitcoin payments across 1,628 stores, one of the largest physical retail crypto rollouts worldwide.
- Ghana demonstrates emerging potential for crypto expansion, according to blockchain analytics observations.
- In Morocco, about 0.9 million people, or 2.4% of the population, own cryptocurrency, making the country first in North Africa and among the global top 50 by ownership rate.
- Web3 interest is significantly higher in developing regions, where 70% of individuals plan to adopt at least one Web3 service, compared with just 7% in developed nations.
- The Philippines shows strong intent, with nearly 80% planning to engage with Web3 services, while only 35% in Australia share the same intent.
- Overall, 46% of surveyed users intend to adopt at least one Web3 service, well above the current 31% active user base, indicating growing optimism.
- Plans to use multiple Web3 services are rising sharply: interest in three or more services is 3× higher, and twice as many people aim to use at least two services in the future.
- NFT participation varies widely across markets 76% of NFT-aware individuals in the UK have never owned one, compared with only 24% in Vietnam, showing far stronger engagement in Southeast Asia.
(Source: TelecomsTechNews, Survey Monkey, Statista, Coinbase, UTA & Vox Media, CoinGecko, Triple-A, Chainalysis, Binance TR, Web3 industry reports, regional crypto adoption studies, blockchain analytics platforms, market surveys)
Web3 Project Participation and Corporate Involvement
- Major global brands such as Starbucks, Salesforce, Nike, and JP Morgan integrated Web3 initiatives into their operations in 2024.
- By the end of 2022, approximately 23,343 Web3 developers were actively working on new or ongoing projects.
- According to Crunchbase, Web3 ventures secured nearly $16 billion in funding during early 2022, compared with just $3.6 billion raised in 2023
(Source: GTIA)
Awareness and Engagement Levels Across Web3 Users
- Studies by UTA and Vox Media reveal that 87% of Americans aged 13–56 would interact with their favourite celebrities in the metaverse.
- Around 51% of Gen Z anticipate performing part of their future work in the metaverse, with 48% of millennials expressing the same expectation.
- Nearly 54% of American consumers report never having heard of the term Web3.
- About 23% of millennials currently own NFTs.
- Close to 50% of all crypto traders and investors fall within the millennial age group.
- The Web3 user base consists of roughly 40% millennials, 30% Gen Z, and 15% Gen X.
(Source: GTIA)
The Most Common Gateways Into the Web3 Ecosystem
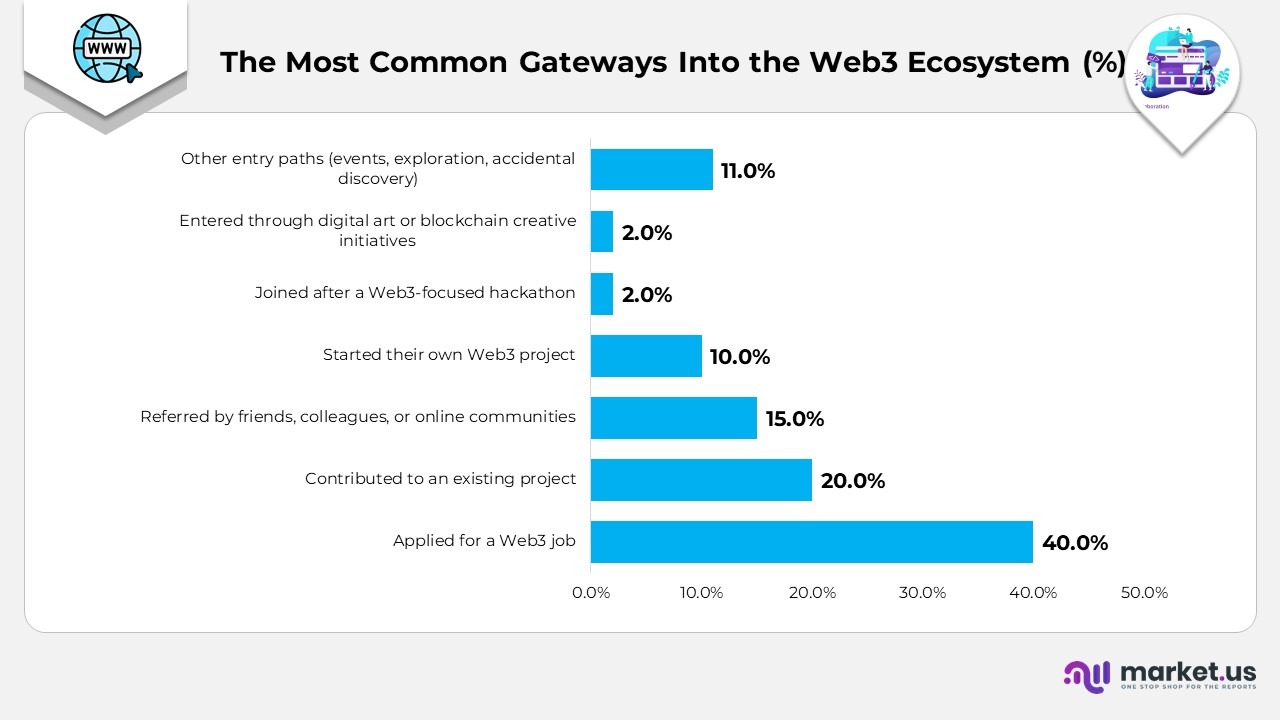
- 40% of respondents said their first step into Web3 was applying for a job in the space.
- 20% entered Web3 by contributing to an existing project or multiple projects.
- 15% were introduced to Web3 through referrals from friends, colleagues, or online communities.
- 10% began their Web3 journey by launching their own personal project.
- 2% got involved after participating in a Web3-focused hackathon.
- 2% discovered Web3 through involvement in digital art or creative blockchain initiatives.
- 11% mentioned other entry routes, including online exploration, events, or accidental discovery.
(Source: GTIA)
Web3 Usage Statistics
- The average daily unique active wallets (dUAW) interacting with decentralized apps grew from 1.58 million in 2021 to 2.37 million in 2022, demonstrating strong year-over-year growth.
- High-risk DApps recorded the fastest growth, with dUAW rising by 291% to an average of 145,000 in 2022, while social DApps increased by 208% to an average of 46,000 daily active wallets.
- Gaming DApps drove the largest share of Web3 adoption, with average daily active wallets rising by 86% from 2021 to reach 15 million in 2022, making it the leading category by usage.
- DeFi DApps ranked second in activity, averaging 652,000 daily active wallets in 2022, though annual growth was limited to just 2%.
- The Web3 gaming sector processed 7.44 billion transactions in 2022, a 94.17% increase from the previous year.
- In 2022, gaming accounted for 49% of all blockchain activity, while DeFi represented 28%. The year prior, DeFi had led with 41% of activity compared to gaming’s 39%, before the shift in dominance.
- Splinterlands maintained its position as the top Web3 game in 2022, averaging 217,914 monthly unique active wallets, up 78% from the previous year.
- By Q3 2023, gaming’s dominance had diluted, with games making up 35% of blockchain activity, DeFi 24%, NFTs 12%, and social DApps 11%.
- Alien Worlds emerged as the most played Web3 game in Q3 2023, with 527,000 quarterly unique active wallets, followed by Sweat Economy at 385,000, while Splinterlands ranked third with 148,000.
(Source: Statista)
Web3 User Demographics and Behavioral Statistics
- Nearly 50% of individuals who actively buy or sell cryptocurrency are millennials, reflecting their greater digital fluency and preference for well-established, thoroughly vetted crypto assets.
- Crypto literacy shows clear demographic differences: men aged 25–34 possess the strongest understanding of digital currencies. In contrast, women and older adults show comparatively lower levels of familiarity, highlighting both age and gender gaps in Web3 knowledge.
- Interest in the metaverse continues to expand across the business sector, with 67% of surveyed organizations already exploring or implementing metaverse initiatives.
- Despite women comprising a substantial share of the gaming community 45% in the US and 40–45% in China, their enthusiasm for metaverse participation remains notably lower than that of men.
- Urban populations are increasingly enthusiastic about engaging with the metaverse, with 68% expressing a willingness to participate. This trend is fueled primarily by Gen Z (ages 18–25) and Millennials (25–40), with a slightly higher representation of higher-income individuals earning more than $65,000
(Source: Industry demographic surveys, global metaverse adoption reports, crypto literacy studies, gaming participation research, Web3 behavioral trend analyses)
Web3 Gaming Statistics
- The Web3 gaming market is projected to soar from $4.6 billion in 2022 to $65.7 billion by 2027, driven by increased investor interest, the rise of NFTs, and growth in active blockchain wallets.
Source: Nasdaq - In Q3 2023, Web3 gaming projects raised around $600 million, bringing total annual funding to $2.3 billion with venture capital firms continuing to anchor growth despite a broader market cooldown.
- Gaming activity accounts for 45% of all blockchain transactions, underscoring the dominance of play-to-earn ecosystems and in-game token economies.
- Security remains a major challenge: the Web3 game Axie Infinity suffered a $625 million crypto hack, underscoring persistent vulnerabilities such as phishing, fake identities, and protocol manipulation.
- The average gamer spends $76 per month on gaming, adding up to nearly $58,000 over a lifetime. Millennials spend the most ($86 per month), suggesting strong future spending potential when Web3 monetization models are included.
(Source: TheGamer, Washington Post, DappRadar, Binance)
Web3 Job Statistics
- US-based job postings mentioning blockchain, Ethereum, bitcoin, or cryptocurrency surged by 395% between 2020 and 2021, signaling a rapid expansion of the Web3 workforce.
- Blockchain ranked as the most in-demand skill in 2020, surpassing AI, machine learning, and cloud computing, reflecting its growing enterprise relevance.
- Entry-level and mid-career salaries in Web3 roles significantly exceed traditional tech averages, as companies compete for qualified blockchain talent.
- As of October 2023, the average salary for a US blockchain developer was $101,705 per year, with an additional $7,547 in bonuses and benefits, for a total of $109,251 annually.
(Source: TheGamer, Washington Post, DappRadar, Binance)
Web3 Security Risks and Hacking Trends
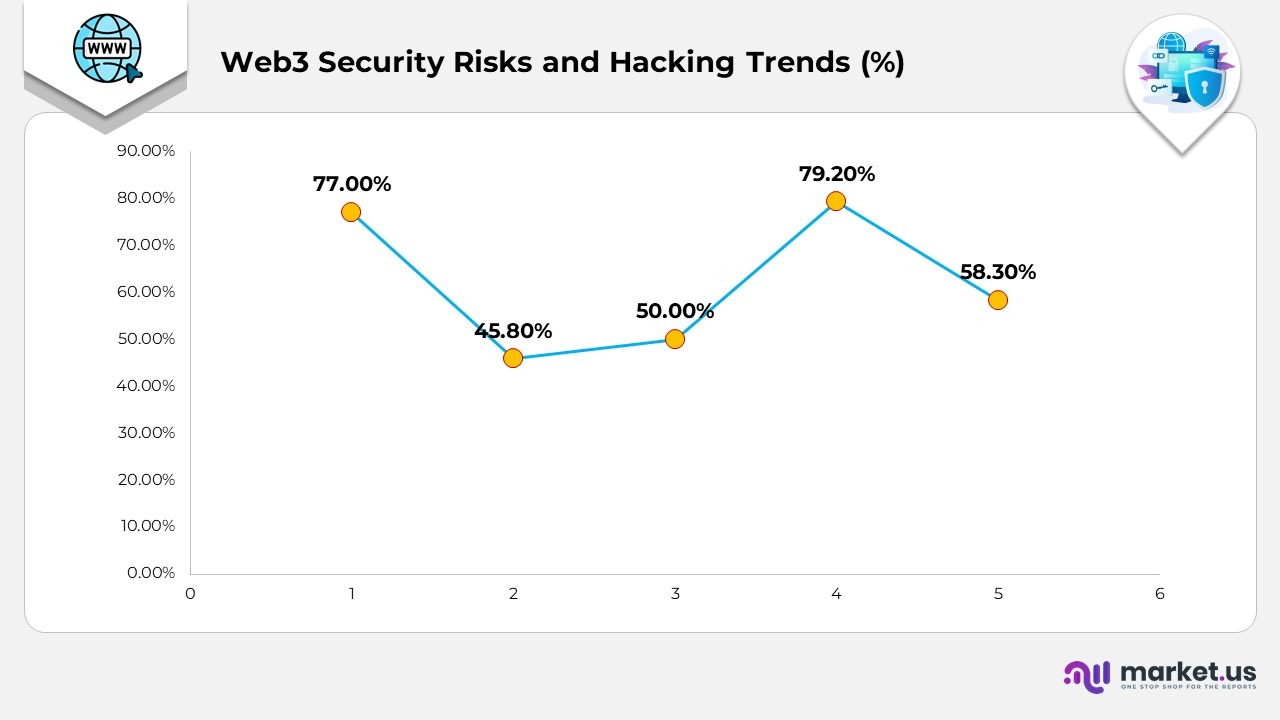
- A recent Tidio survey shows that 77% of respondents believe the metaverse has the potential to cause serious harm to society, with the top concerns being addiction to virtual environments, privacy risks, and mental health challenges.
- Web3 security firm Beosin reported that in Q2 2022, losses from Web3-related scams and exploits exceeded $718 million.
- The report recorded 48 major hacking incidents, each responsible for losses exceeding $100 million, while 28 caused losses between $1 million and $10 million.
- Smart contract vulnerabilities were the most exploited attack method, accounting for 45.8% of all incidents and resulting in roughly $138 million in losses, slightly down from 50% in Q1.
- DeFi projects remain the most frequently targeted category, accounting for approximately 79.2% of all Web3 attacks.
- Hackers transferred around $418.89 million of the stolen funds to Tornado. Cash, representing 58.3% of the total amount siphoned in the quarter.
- The quarter also saw 43 rug-pull incidents, resulting in combined losses of about $34.27 million; meanwhile, Discord experienced more than 151 hacking incidents, with phishing and rug pulls especially common in May and June.
- Ethereum alone suffered losses of roughly $381.35 million during the same period due to widespread hacking activity.
(Source: Tidio Survey, Beosin Q2 2022 Web3 Security Report, Blockchain Attack Data, Tornado.Cash Analysis, Ethereum Network Exploit Reports)
Conclusion
Web3 statistics consistently show a digital ecosystem that is expanding in scale, sophistication, and global participation. Awareness is rising, developers are building more actively than ever, and users are engaging across gaming, finance, NFTs, and enterprise applications with increasing confidence. Growth remains particularly strong in emerging markets, supported by higher adoption intent and growing investment momentum. While barriers such as security concerns, regulatory uncertainty, and limited public understanding still shape the pace of mainstream integration, the overall direction is undeniably upward.
The continued influx of startup funding, corporate entry, and user interest highlights Web3’s shift from concept to practical reality. As the technology evolves, Web3 is positioned to redefine digital ownership, reshape online economies, and support a more decentralized, user-driven internet in the years ahead.