Quick Navigation
- Company Overview
- Sysco Corporation History
- Employee Analysis
- Financial Analysis
- Segmental Analysis
- Year-on-Year Product Mix Evolution of Sysco Corporation
- Customer Type Distribution Analysis for Sysco Corporation
- Sysco Corporation Amortization Expense Trends and Future Projections
- Geographic Revenue Analysis
- Supply Chain Management System Patents of Sysco
- Recent Developments
Company Overview
Sysco Statistics: Sysco Corporation is a global leader in the selling, marketing, and distribution of food and related products to businesses that prepare meals outside the home. During fiscal 2025, the company served approximately 730,000 customer locations, including restaurants, hotels, healthcare facilities, schools, entertainment venues, and other foodservice establishments.
Sysco operates across 4 primary business segments: U.S. Foodservice Operations, International Foodservice Operations, SYGMA, and other segments. The company operates 339 distribution centres in 10 countries, employing nearly 75,000 colleagues who serve customers across the United States, Canada, Costa Rica, Ireland, France, and other key international markets.
As of June 28, 2025, Sysco operated 337 distribution facilities throughout North America and Europe. Its transportation fleet of around 19,000 delivery vehicles, primarily refrigerated, ensures the safe movement of perishable and frozen goods. Approximately 91% of these vehicles are owned by the company, while the remainder are leased.
Sysco Corporation History
1900’s
- In 1969, Sysco Corporation was founded in Houston, Texas, by bringing together several regional food distributors to create a nationwide foodservice network.
- In 1970, Sysco became a publicly traded company on the New York Stock Exchange (NYSE) and began expanding rapidly through the acquisition of smaller foodservice distributors strategically located across the U.S.
- 1976 The acquisition of Mid-Central Fish and Frozen Foods Inc. strengthened Sysco’s frozen food distribution capabilities nationwide.
- In 1981, the company established Compton Foods in Kansas City to expand into meat processing and frozen dinner distribution. That same year, Sysco acquired Lankford Produce in Maryland, which was later renamed Sysco Eastern Maryland.
- In 1984, Sysco continued its expansion by purchasing three PYA Monarch operations, thereby extending its national reach.
- In 1988, the acquisition of CFS Continental, the third-largest food distributor in the U.S., marked a major milestone in Sysco’s growth.
- By 1990, Sysco had completed 43 acquisitions. It purchased Scrivner Inc., an Oklahoma-based distributor, renaming it Sysco Food Service of Oklahoma Inc.
- In 1991, Sysco created SYGMA, a specialized distribution network for chain restaurants, and expanded further by acquiring four of Scrivner’s northeastern distribution firms.
- In 1992, the company purchased Tartan Foods and Perloff Brothers Inc., thereby strengthening its regional supply coverage.
- In 1993, Sysco acquired the St. Louis division of Clark Foodservice Inc., renaming it Sysco Food Service of St. Louis Inc. Additionally, Sysco acquired Ritter Food Corporation of New Jersey, renaming it Ritter Sysco Food Services Inc.
- In 1995, despite significant turnover, Sysco’s market share remained under 10%, reflecting the highly fragmented nature of the foodservice industry.
- 1996–1997: Sysco expanded into Canada through the acquisition of Strano Foodservice in Ontario and Alaska Fish and Farm Inc., thereby extending its operations to new territories.
2000’s
- In 2002, the company acquired Serca Foodservices Inc. from the Oshawa Group and renamed it Sysco Canada. It also purchased Asian Foods Inc., North America’s largest Asian food wholesaler.
- In 2008, Sysco introduced a new logo featuring a green leaf in the letter ‘y’, symbolizing its commitment to sustainability and food quality.
- In 2009, Sysco entered the Irish market by acquiring Pallas Foods, the country’s largest food distributor, and Keelings Group Ltd.’s foodservice division.
- In 2012, Pallas Foods acquired Crossgar Foodservice, a Northern Ireland-based meat and poultry supplier, thereby strengthening Sysco’s U.K. and Irish presence.
- In 2016, Sysco purchased Brakes Group from Bain Capital, significantly expanding its European footprint and establishing a strong presence across the U.K. and Western Europe.
Employee Analysis
- As of June 28, 2025, Sysco employed approximately 75,000 people, comprising 51,000 employees in the U.S. and 24,000 employees internationally.
- This marked a slight decrease compared to 76,000 total employees reported as of June 29, 2024, reflecting workforce optimization and productivity initiatives.
- Nearly 99% of U.S.-based employees were classified as full-time, defined as individuals working 30 or more hours per week, underscoring Sysco’s commitment to a stable, full-time workforce.
- Around 14% of the company’s total employees were represented by labor unions, primarily including the International Brotherhood of Teamsters and unions based in France and Sweden.
- Approximately 14% of unionized employees are covered by collective bargaining agreements scheduled for renegotiation in fiscal 2026, indicating continued collaboration with labor organizations.
(Source: Sysco Corporation Annual Report)
Financial Analysis
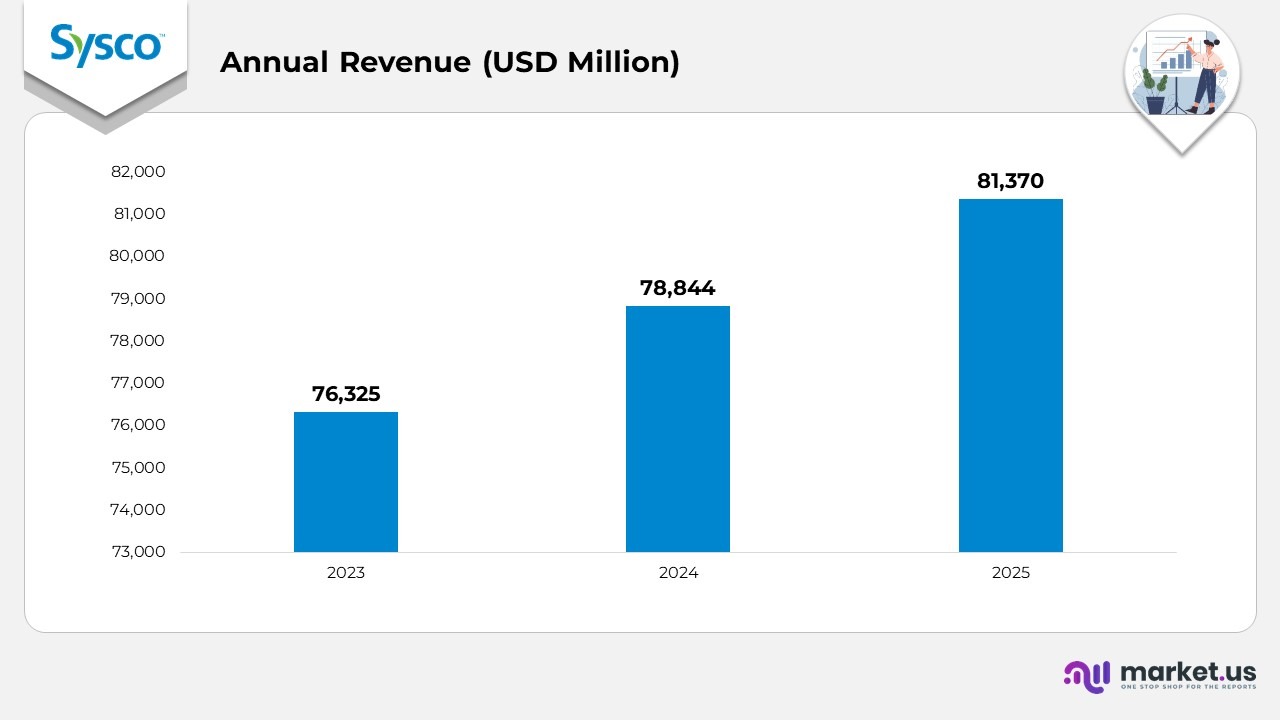
- In 2023, Sysco Corporation recorded an annual revenue of 76,325 million USD, establishing a solid base following consistent market recovery and stable foodservice operations.
- In 2024, revenue increased to 78,844 million USD, representing a 3% year-over-year (YoY) growth. This rise was driven by improved demand from the restaurant and hospitality sectors, along with pricing adjustments and supply chain efficiencies.
- In 2025, the company’s revenue further advanced to 81,370 million USD, indicating a 2% YoY growth over 2024. The continued upward trend reflects Sysco’s expanding customer base, operational streamlining, and growth in the international segment.
Segmental Analysis
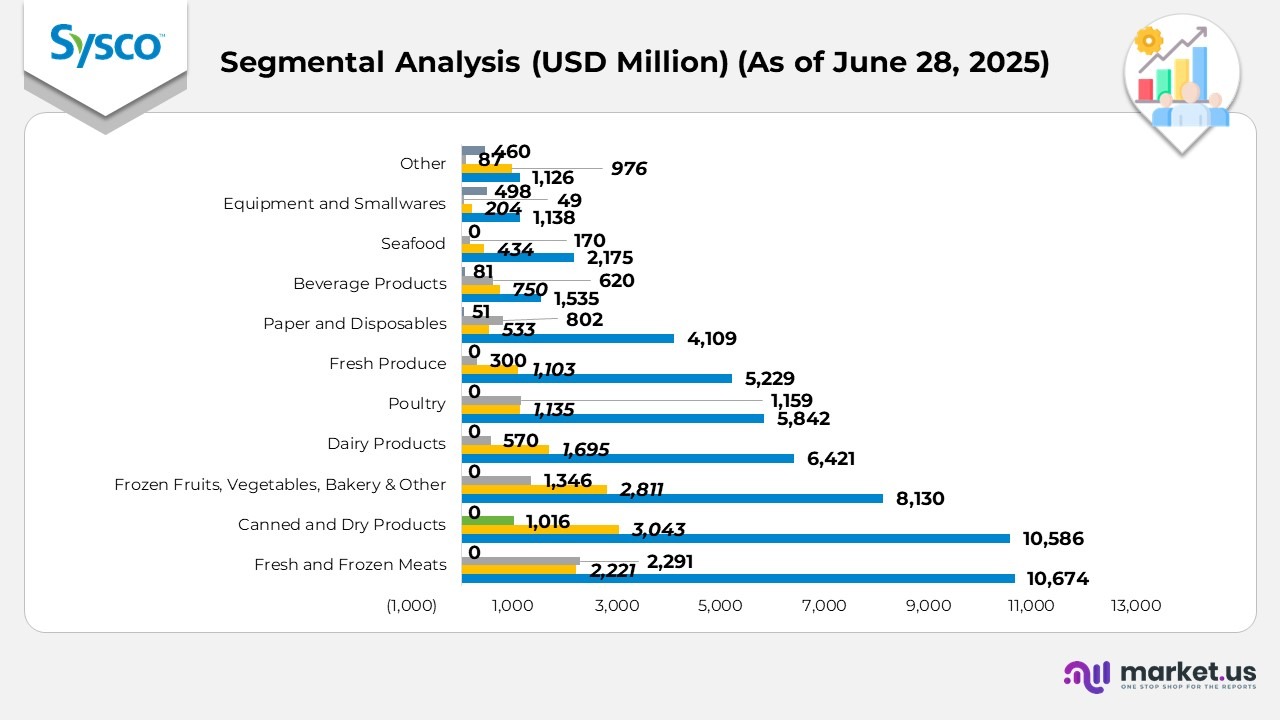
- During the fiscal year ended June 28, 2025, fresh and frozen meats remained Sysco’s largest revenue generator with total sales of $15,186 million. The category included $10,674 million from U.S. Foodservice Operations,$2,221 million from international markets, and $2,291 million from SYGMA, reflecting sustained protein demand across restaurant and institutional segments.
- Canned and dry products contributed $14,645 million, led by $10,586 million from U.S. operations and $3,043 million from international divisions. This steady performance was supported by continued reliance on shelf-stable goods within food distribution networks.
- Frozen fruits, vegetables, bakery, and other frozen products generated $12,287 million, with $8,130 million coming from U.S. operations and $2,811 million from international business. The segment benefited from consistent demand for frozen and ready-to-use food products across both retail and institutional customers.
- Dairy products achieved $8,086 million in revenue, driven by $6,421 million in U.S. operations and $1,695 million The category maintained stability as dairy-based ingredients remained essential across Sysco’s foodservice channels.
- Poultry recorded $8,132 million in total revenue, including $5,842 million from the U.S., $1,135 million from international markets, and $1,159 million from SYGMA. This growth reflects increased poultry consumption and menu diversification in the hospitality and restaurant industries.
Further
- Fresh produce totaled $6,632 million, supported by $5,229 million from U.S. operations and $1,103 million The consistent figures underscore Sysco’s reliable fresh food supply chain and the rising demand for health-oriented food options.
- Paper and disposables accounted for $5,495 million, comprising $4,109 million from U.S. sales and $533 million from international markets. The segment continued to benefit from growing adoption of sustainable packaging solutions.
- Beverage products generated $2,986 million in revenue, with $1,535 million coming from the U.S. and $ 1,451 million from international markets. The category maintained steady growth through Sysco’s partnerships with beverage suppliers and expanded distribution programs.
- Seafood reached $2,779 million in total sales, including $2,175 million from U.S. operations and $434 million from international markets. The performance was supported by the recovery of the restaurant dining sector and improved stability of the seafood supply.
- Equipment and smallwares posted $1,889 million in revenue, with $1,138 million from U.S. operations and $204 million from international business. The strong growth highlights increased investments in foodservice equipment modernization.
- Other products generated $2,649 million, supported by $1,126 million from U.S. operations and $976 million from international markets. This category’s growth was driven by Sysco’s expansion into auxiliary and specialty product offerings.
(Source: Sysco Corporation Annual Report)
Year-on-Year Product Mix Evolution of Sysco Corporation
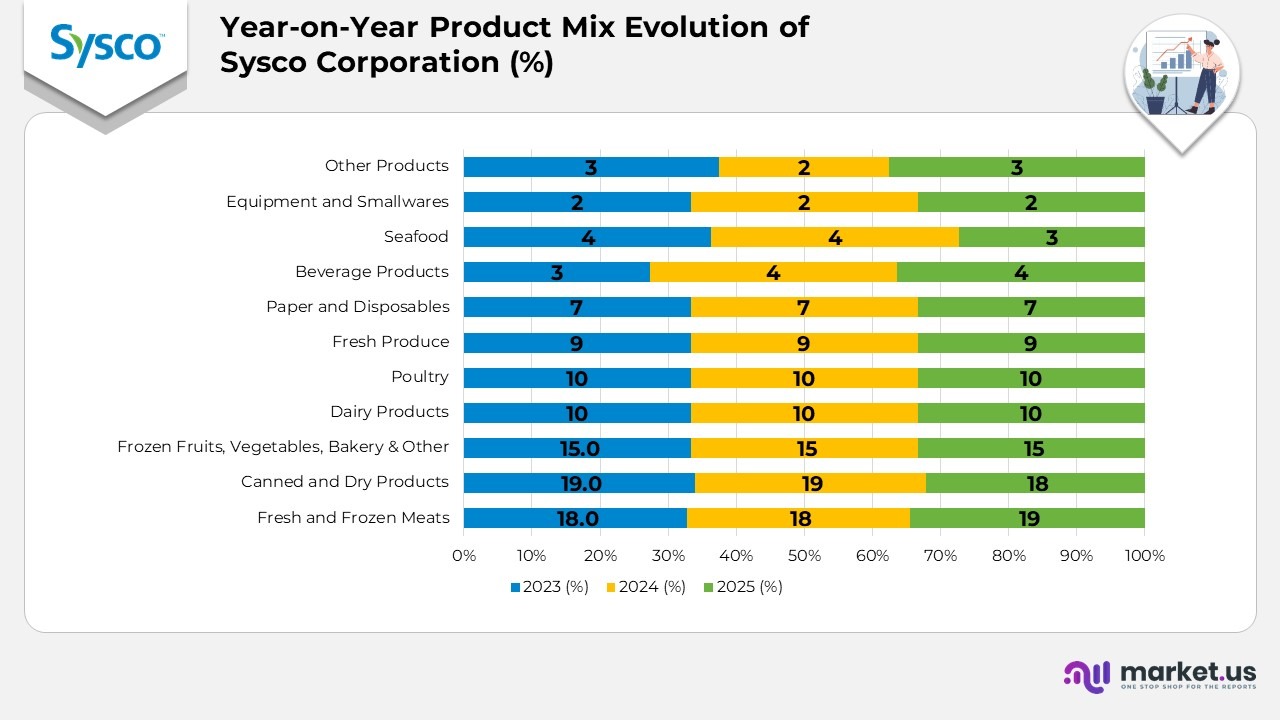
- Fresh and frozen meats remained the cornerstone of Sysco Corporation’s product mix, increasing from 18% in 2023 to 19% in 2025, driven by strong protein demand from restaurants, caterers, and institutional buyers, which reinforced Sysco’s leadership in meat distribution.
- Canned and dry products eased slightly from 19% in 2023 to 18% in 2025, indicating a return to normal purchasing levels after previous spikes in demand for shelf-stable foods.
- Frozen fruits, vegetables, bakery, and other frozen categories maintained a consistent 15% share across the three years, reflecting steady consumption of convenient, ready-to-cook items in both domestic and international markets.
- Dairy products accounted for a stable 10% share each year, underscoring Sysco’s reliable dairy supply chain and the continuous use of dairy ingredients in commercial food preparation.
- Poultry held firm at 10% throughout 2023-2025, supported by consistent menu integration and consumer preference for protein variety across foodservice outlets.
Moreover
- Fresh produce sustained a 9% share for the period, highlighting Sysco’s robust sourcing network and steady demand for fresh, health-oriented foods from restaurants and institutional clients.
- Paper and disposables contributed a stable 7%, underscoring Sysco’s commitment to sustainable packaging solutions and the steady demand for hygiene and disposable products across the hospitality and catering sectors.
- Beverage products rose from 3% in 2023 to 4% in 2024 and stayed at 4% in 2025, marking a gradual expansion in Sysco’s beverage partnerships and institutional sales programs.
- Seafood declined from 4% in 2023 to 3% in 2025, primarily due to global sourcing challenges and shifting cost dynamics in seafood procurement.
- Equipment and smallwares consistently represented 2% of the total mix across the three years, reflecting Sysco’s continued focus on kitchen tools and support equipment for operational efficiency.
- Other product categories fluctuated between 3% in 2023, 2% in 2024, and 3% in 2025, demonstrating Sysco’s adaptability in catering to emerging and specialized customer requirements.
(Source: Sysco Corporation Annual Report)
Customer Type Distribution Analysis for Sysco Corporation
- Restaurants remained the primary customer group for Sysco, holding a 62% share in both 2023 and 2024, before slightly easing to 60% in 2025, indicating steady dominance in the foodservice sector, accompanied by gradual growth in non-restaurant segments.
- Education and government institutions represented 8% in 2023, dipped to 7% in 2024, and returned to 8% in 2025, indicating a rebound in public sector meal programs and institutional catering demand.
- Healthcare customers contributed 7% in 2023 and 2024, increasing to 8% in 2025, driven by rising demand from hospitals, clinics, and long-term care facilities expanding their foodservice operations.
- Travel and leisure accounted for 8% in 2023, declined to 6% in 2024, and improved to 7% in 2025, reflecting a gradual recovery in tourism, hospitality, and airline catering activities.
- Other customer categories accounted for 15% in 2023, 18% in 2024, and 17% in 2025, demonstrating Sysco’s growing presence in diversified markets, including corporate catering, retail, and specialty distribution.

(Source: Sysco Corporation Annual Report)
Sysco Corporation Amortization Expense Trends and Future Projections
- Sysco Corporation reported an amortization expense of $147 million in 2025, compared to $142 million in 2024 and $126 million in 2023, reflecting a gradual increase driven by ongoing recognition of intangible asset values.
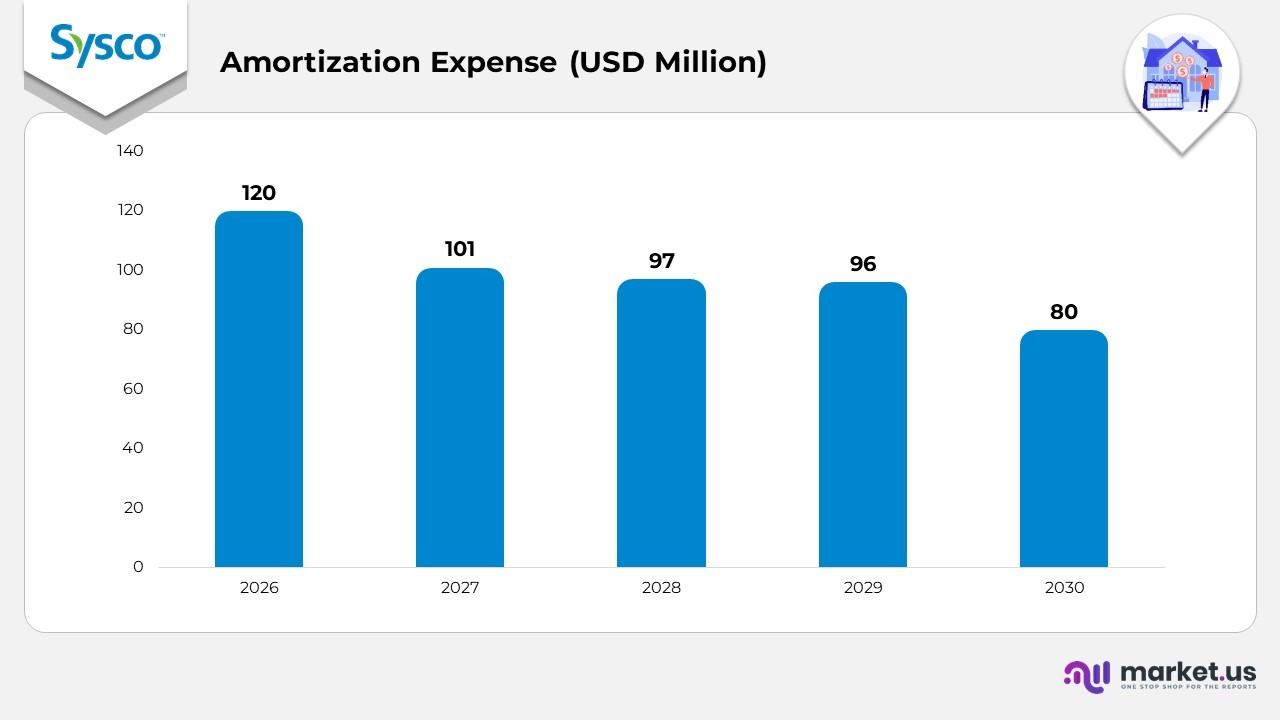
- The estimated amortization expense for 2026 is projected at $120 million, marking the beginning of a gradual decline in future expenses.
- For 2027, Sysco expects amortization costs to total $101 million, indicating a continued reduction as older intangible assets approach full amortization.
- The projected amortization expense for 2028 is $97 million, showing a stable downward progression in line with asset maturity.
- In 2029, amortization is expected to slightly decrease to $96 million, maintaining consistency with prior-year trends.
- By 2030, the amortization expense is anticipated to decline further to $80 million, reflecting fewer active amortizable assets on the company’s balance sheet.
(Source: Sysco Corporation Annual Report
Geographic Revenue Analysis
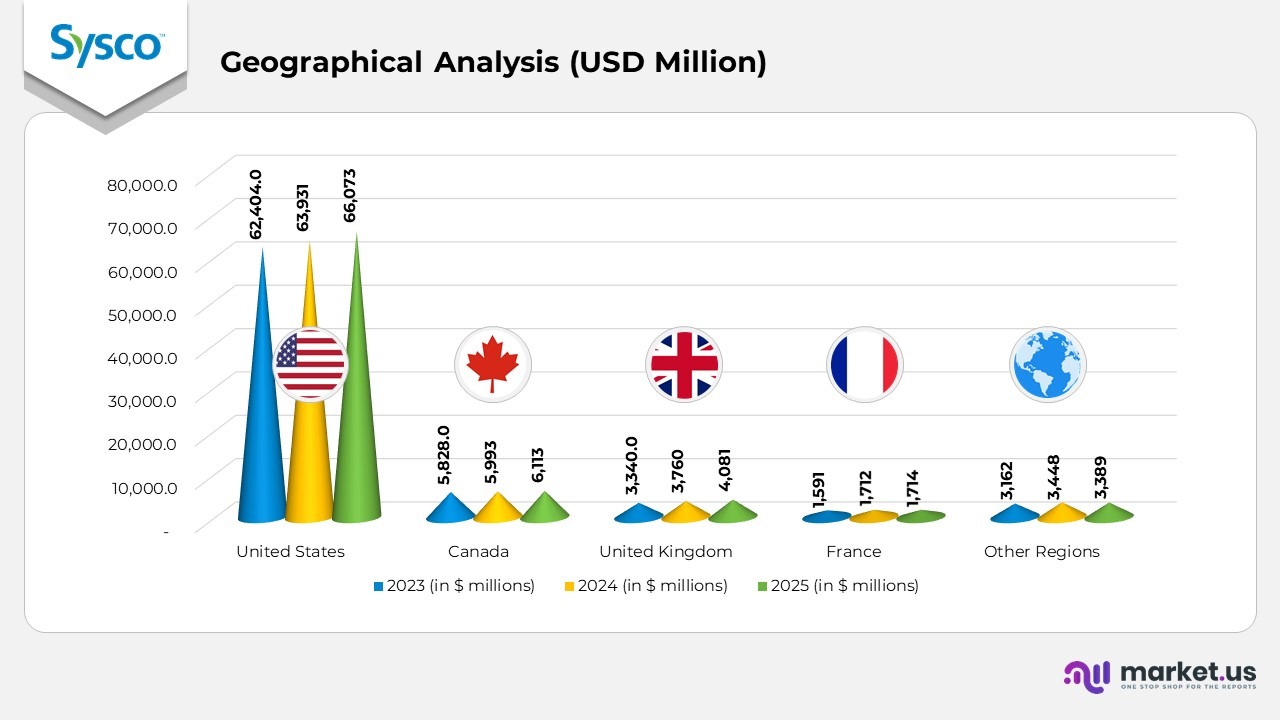
- United States sales were $62.404 billion in 2023, $63.931 billion in 2024, and $66.073 billion in 2025, showing steady expansion with 3.4% growth in 2024 and 3.3% in 2025, supported by rising foodservice demand and a strong restaurant recovery across the country.
- Canada recorded $ 5,828 million in 2023, $ 5,993 million in 2024, and $ 6,113 million in 2025, reflecting moderate yet consistent gains with 2.8%growth in 2024 and 2.0% in 2025, driven by stable catering and hospitality segments.
- United Kingdom revenue improved from 3,340 million in 2023 to 3,760 million in 2024 and 4,081 million in 2025, showing solid increases of 6% in 2024 and 8.5% in 2025 as Sysco strengthened its market penetration and supply chain reach in the region.
- France achieved 1,591 million in 2023, 1,712 million in 2024, and 1,714 million in 2025, indicating a 7.6% growth in 2024, followed by stable performance in 2025, reflecting a mature market with consistent demand from hospitality and institutional clients.
- Other regions posted $ 3,162 million in 2023, $ 3,448 million in 2024, and $ 3,389 million in 2025, translating to 9.0% growth in 2024 and a minor 1.7% dip in 2025, mainly due to mixed performance across emerging markets and currency fluctuations.
(Source: Sysco Corporation Annual Report
Supply Chain Management System Patents of Sysco
| Patent Title | Publication Number | Type | Filing Date |
|---|---|---|---|
| Supply Chain Management System | 20110064557 | Application | November 18, 2010 |
| Supply Chain Management System | 20110066576 | Application | November 18, 2010 |
(Source: Justia Patents)
Recent Developments
-
- In December 2024, Sysco formed a partnership with Square to empower restaurants of all sizes with advanced digital tools. The collaboration focuses on enhancing restaurant operations through technology integration, enabling foodservice businesses to streamline their ordering, payment, and management systems.
- In November 2024, Sysco contributed $10,000 to the Northern Illinois Food Bank as part of its Nourishing Neighbours initiative. The program donates a portion of proceeds from Sysco-branded product sales to community organizations, reinforcing the company’s commitment to fighting hunger and supporting local communities.
- In November 2023, Sysco introduced its One Planet. One Table. product assortment, an initiative designed to promote sustainability and climate-conscious sourcing. Through this effort, Sysco aims to foster partnerships that advance environmental stewardship and encourage industry-wide collaboration on sustainability goals.
- In October 2023, Sysco announced plans to acquire Edward Don & Company (DON), a leading supplier of foodservice equipment and supplies. The acquisition enhances Sysco’s capabilities in specialty equipment distribution, expands its product portfolio, and strengthens its position as a one-stop solution provider for customers across the foodservice industry.
(Source: Sysco Corporation Press Releases)